
 ?Mathematical formulae have been encoded as MathML and are displayed in this HTML version using MathJax in order to improve their display. Uncheck the box to turn MathJax off. This feature requires Javascript. Click on a formula to zoom.
ABSTRACT
Neighbourhood socioeconomic change is often related to structural processes that transform urban income compositions. In the Netherlands, restructuring of the welfare state and the housing market are examples. The paper examines the role of structural processes in neighbourhood income change in four Dutch cities (1999–2014) by decomposing total change into contributions of three factors: reordering of neighbourhood hierarchies; increasing inequality; and income growth. Results show regional variation in change components. Amsterdam and Utrecht stand out in contributions of growth; Amsterdam and the Hague in contributions of inequality. All cities’ core neighbourhoods are upgraded through reordering, a pattern often masked by increasing inequality.
JEL:
INTRODUCTION
North European cities are considered relatively resilient to pervasive socio-spatial inequalities as a result of strong welfare states that redistribute incomes and housing-market systems that provide social and public housing (Kazepov, Citation2005; Tammaru et al., Citation2019). Dutch cities are exemplary in this respect, and especially the capital Amsterdam is considered a model ‘just city’ with regard to its housing market structure (Fainstein, Citation2010). However, the Dutch welfare state has taken a neoliberal turn, which is characterized by the promotion of homeownership, the shrinkage of the social housing sector and reduced access to social housing. This turn has generated a broad discourse on the implications of neoliberal policies for the socio-spatial structures of Dutch cities, including increasing levels of inequality and spatial polarization (Groot & de Groot, Citation2013; Buitelaar et al., Citation2016); gentrification and displacement (Bolt et al., Citation2009; Hochstenbach & van Gent, Citation2015; Uitermark & Bosker, Citation2014; van Gent, Citation2013); and the suburbanization of poverty (Boterman & van Gent, Citation2014; Hochstenbach & Musterd, Citation2018).
Research on the processes underlying neighbourhood socioeconomic change, including research in the Dutch context (Bailey et al., Citation2017; Hochstenbach & van Gent, Citation2015; Teernstra, Citation2014), has focused on individual residential and social mobility as driving processes of neighbourhood change. However, changes in the socio-spatial structures of cities are largely driven by structural processes. These structural processes can lead to changes in income compositions of an urban area, which can manifest themselves in increasing inequality among its neighbourhoods and in income growth or decline across all of its neighbourhoods (Modai-Snir & van Ham, Citation2018a). Part of the socioeconomic change that neighbourhoods undergo relates to those higher level processes regardless of their intrinsic characteristics. However, when it comes to the analysis of neighbourhood change, most existing research overlooks their actual effect. This paper argues that structural processes need to be taken into account when investigating neighbourhood income changes in Dutch cities, especially in the context of a transforming welfare state and housing market. Understanding the extent of the role of structural processes could affect urban policies: A strong impact on neighbourhood fortunes means a weaker relative impact of their intrinsic characteristics. This may point to a diminishing effectiveness of policies that specifically target neighbourhoods, as opposed to those that focus on socioeconomic structures of entire urban areas.
This paper presents an empirical study of the distributional processes underlying neighbourhood change in Dutch cities, with a main objective of exposing the effect of structural processes. To isolate the role of different structural processes, it takes a non-traditional approach. We use a decomposition method from income mobility research (Van Kerm, Citation2004) that splits total change into contributions of separate distributional processes. This method has recently been applied to understand income-related change among neighbourhoods of a single urban area (Modai-Snir & van Ham, Citation2018a) and is capable of distinguishing between three change factors: (1) reordering of the relative positions of neighbourhoods within the urban neighbourhood hierarchy (defined as the ‘ladder’ of neighbourhood socioeconomic statuses); (2) increasing inequality among neighbourhoods; and (3) income growth or decline across the entire neighbourhood hierarchy (Modai-Snir & van Ham, Citation2018a). The latter two are considered ‘structural factors’ because they involve a change of the neighbourhood hierarchy of an urban area. The decomposition is applied to data on yearly average incomes of all neighbourhoods in each of the four largest cities in the Netherlands (Amsterdam, Rotterdam, The Hague and Utrecht) over the period 1999–2014, obtained by aggregating geocoded individual-level data from Statistics Netherlands (CBS) to geographically consistent neighbourhood units.
Using the decomposition method, this paper assesses the extent to which each of the three processes played a role in changing neighbourhood socioeconomic conditions in each city. Considering the distinctive circumstances of each city, which will be outlined in the following section, structural processes can have different impacts on neighbourhoods in different cities. Therefore, the paper addresses the following questions:
• Does increasing inequality in Dutch cities translate into patterns of neighbourhood change?
• To what extent are neighbourhoods influenced by divergent income growth among the cities?
• What is the impact of neighbourhood reordering on changing locations of socioeconomic classes within each city?
• How do these different processes intersect?
SOCIO-SPATIAL RESTRUCTURING AND NEIGHBOURHOOD CHANGE IN DUTCH CITIES
Socio-spatial change in contemporary urban areas is greatly affected by global processes, but it is conditioned by local contexts. For example, increases in urban inequality and segregation have been most extreme in market-dominated American cities (e.g., Reardon & Bischoff, Citation2011), whereas the effects of these processes have been cushioned in European cities because of national welfare states and interventionist traditions (Kazepov, Citation2005; van Kempen & Murie, Citation2009). Recently, however, it has been shown that many European cities also experienced trends of increasing socio-spatial inequality, which to some extent can be attributed to the weakening of welfare states (Tammaru et al., Citation2015). The effects of welfare-state restructuring on urban socio-spatial structures are twofold: first, changing redistributive policies fail to constrain inequality as effectively as before; and second, more market-oriented approaches in the domains of housing and urban renewal accelerate the translation of inequalities into spatial divisions (van der Wusten & Musterd, Citation1998). The Netherlands housing market was heavily regulated until the 1990s, which, combined with a strong social-housing sector, has led international commentators to label especially Amsterdam as a model just city (Fainstein, Citation2010). Since then, the privatization and liberalization of the Dutch housing market spurred gentrification, displacement and the strengthening of urban divisions (Boterman & van Gent, Citation2014; Uitermark & Bosker, Citation2014).
Increasing urban inequality is a major concern for contemporary cities. Often, it reflects the effect of increasing national-level inequality, which occurred in most developed countries in the past decades (Organisation for Economic Co-operation and Development (OECD), Citation2015a). In the Netherlands this is not the case, as national income-inequality levels are among the lowest and inequality increases during recent decades were modest (OECD, Citation2015b). Nevertheless, income inequality is on the rise in the largest Dutch cities (Groot & de Groot, Citation2013; Buitelaars et al., Citation2016), which draws special attention to the urban and regional scale in analysing inequality processes. The urban inequality trend followed housing-market restructuring of which a central feature was the promotion of homeownership at the expense of the social housing sector. Riding on new homeownership policies and on a shift towards local urban governance, municipalities were able to influence income structures in their cities by modifying compositions of their housing stocks (van Gent, Citation2013). This involved an increased focus on developing housing for affluent households at the expense of affordable housing for low-income households (Kadi & Musterd, Citation2015; Van Kempen & Van Weesep, Citation1994). These developments underlie the increasing residential segregation by affluence in Amsterdam (Musterd & van Gent, Citation2015).
The share of social housing in Dutch cities reached its peak during the 1990s. In Amsterdam, it reached a high of 55% in 1995 (Musterd, Citation2014). Despite privatization and liberalization, the Dutch housing market is still highly regulated and social housing provision is substantial compared with more liberal housing market regimes. Of the cities studied in this paper, Amsterdam and Rotterdam have higher proportions of social housing units (45.8% and 46.8%, respectively, as of 2012) compared with The Hague and Utrecht (33.3% and 33.9%, respectively, as of 2012).Footnote1 The large share of social housing ensures affordability within city boundaries, which has a particularly strong effect in (over)heating housing markets. Low-income households in the Netherlands are less likely to be priced out of cities compared with more liberal housing markets such as in the United States, where in many cities even the middle class is being priced out (Shaw, Citation2018). However, retaining low-income populations within cities in parallel with a growing share of high-income population results in higher levels of urban inequality and income polarization.
Polarization was most evident in Amsterdam during the period 2006–12 (Buitelaars et al., Citation2016), conforming with the Global City thesis (Sassen, Citation1991) which associated polarization in global cities with changing occupational structures. Polarization is likely to have been supported by changes in housing stock compositions, with more emphasis on owner-occupied housing and less on social renting. The effect of polarization on urban neighbourhood hierarchies has been demonstrated in cities around the world, where proportions of rich and poor neighbourhoods increased at the expense of middle-income neighbourhoods (Booza et al., Citation2006; Hulchanski, Citation2011; Modai-Snir & van Ham, Citation2018b). The policy goals of Amsterdam’s municipality with regard to the housing stock and population composition were to increase the upper class at the expense of lower class households, with little change to the proportion of the middle-class segment (van Gent, Citation2013). Thus, polarization in Dutch cities may be associated with increasing income gaps between upper and lower classes rather than with a contracting middle class.
The changing urban income structure has implications for the socioeconomic position of neighbourhoods in the urban hierarchy. Increasing individual-level inequality in combination with increasing segregation by income implies increasing inequality among neighbourhoods.Footnote2 Such change in the neighbourhood hierarchy involves characteristic patterns of income change across the hierarchy. Typically, high-income neighbourhoods become richer, while low-income neighbourhoods become poorer, and consequently, spatial disparities intensify; this effect of inequality in the context of an existent socio-spatial divide has been shown for Tel-Aviv, Israel (Modai-Snir & van Ham, Citation2018b). In the Dutch context, The Hague is a noticeable example of a historical socio-spatial divide that was shaped by a geological divide between sand and peat soils (Meijers et al., Citation2014). Recent evidence points to an exacerbation of socio-spatial differentiation (Bailey et al., Citation2017), probably pointing to effects of increasing inequality.
The spatial structure of inequalities within an urban area is dynamic and related to positional reordering of neighbourhoods in the urban hierarchy. Reordering is generated by processes that affect the attractiveness of neighbourhoods relative to each other from the perspective of different income groups. Housing systems are key in understanding this process. In liberal housing markets, differentiation between neighbourhoods is driven by market dynamics, for example, through the changing physical condition of housing stocks. New housing generally attracts richer households, and deteriorating conditions in older stocks make housing filter down to lower income households (e.g., Rosenthal, Citation2008). Centrally located and aesthetically attractive deteriorated neighbourhoods often become targets for gentrification, leading to reinvestment and in-migration of higher income groups. The chronological development of cities outwards from the core explains the reversal of fortunes between inner-city and suburban neighbourhoods (Brueckner & Rosenthal, Citation2009).
In less liberal housing regimes with a substantial share of social housing, socioeconomic differentiation among neighbourhoods is influenced by the housing-stock distribution among tenures. This source of differentiation can be observed in post-war large housing estates in many European cities; those formed large clusters of social housing and have often developed as deprived neighbourhoods (Hess et al., Citation2018). In the Dutch context, the spatial distribution of tenures has become very dynamic because of tenure conversions associated with homeownership-promoting policies (Boterman & van Gent, Citation2014; Musterd & van Gent, Citation2015). Tenure conversions were tied to urban regeneration policies, but had varied outcomes for different neighbourhoods depending on their market positions. In Amsterdam, for example, conversions in inner-city neighbourhoods were associated with gentrification and upgrading, whereas in weaker post-war neighbourhoods they were associated with downgrading (Boterman & van Gent, Citation2014). Gentrification of core neighbourhoods, combined with the suburbanization of poverty, has become salient in Dutch cities, especially in Amsterdam with its tight housing market (Hochstenbach & Musterd, Citation2018). This pattern mirrors spatial reordering processes in contemporary cities in the United States, Canada, Australia and the UK (Bailey & Minton, Citation2017; Cooke & Marchant, Citation2006; Hochstenbach & Musterd, Citation2018; Hulchanski, Citation2011; Randolph & Tice, Citation2014), following a global revival of the urban lifestyle.
The marginalization of the Dutch social housing sector as a result of restricting it to lower income households (Musterd, Citation2014) is likely to have exacerbated spatial patterns of neighbourhood reordering. Neighbourhoods with large shares of social housing may have experienced positional downgrades in the urban hierarchy, simply because middle-income households could no longer move there as they earned too much to qualify for social housing. At the same time, urban regeneration policies encouraged ‘social mix’ by diversifying tenure compositions in target ‘problematic’ neighbourhoods (Boterman & van Gent, Citation2014; Kleinhans, Citation2004), aiming at repositioning them higher up the urban hierarchy. This resulted in displacement of low-income groups to other poor neighbourhoods (Bolt et al., Citation2009), repositioning them lower than before.
Housing market restructuring in combination with the influence of globalizing capital also affect inter-urban hierarchies. For the past decades, cities’ fortunes were determined by their success in transitioning to a post-industrial economy. Areas in which the creative class concentrated have thrived, and those in which the economic base remained centred on traditional manufacturing have declined (Florida, Citation2002; Moretti, Citation2012). The different circumstances of each urban area affect its entire neighbourhood hierarchy and so growth (or decline) in incomes drags all neighbourhoods up or down. Disparities among the four largest Dutch cities, which function as a polycentric core region (The Randstad), are mainly between the north (Amsterdam and Utrecht) and south wings (Rotterdam and The Hague) (van Oort, Citation2007). Those stem from the cities’ different economic bases: Amsterdam takes a central role in the global knowledge economy and specializes, together with Utrecht, in commercial services; Rotterdam specializes in (sea) transport and logistics and The Hague’s specialization is centred on public administration (Meijers, Citation2007). The hierarchy between the cities manifests in housing prices, with Amsterdam, the most dominant city among the four, leading increases (Teye et al., Citation2017).
SOCIO-SPATIAL ORGANIZATION AND NEIGHBOURHOOD SOCIOECONOMIC CHANGE: A CONCEPTUAL APPROACH
The existent literature on the processes underlying neighbourhood socioeconomic change has examined individual-level processes and mechanisms, including selective residential and social mobility, as key in explaining neighbourhood change. The approach taken in this paper is different because it focuses on neighbourhood change as a manifestation of socio-spatial organization, which is related, among others, to structural processes. While individual-level processes are the direct mechanisms that generate neighbourhood change, they are partly driven themselves by the structural processes examined in this paper. The two approaches are therefore complementary.
The approach we employ builds on a recent paper (Modai-Snir & van Ham, Citation2018a), which applied a decomposition method from income mobility research (Van Kerm, Citation2004) to the context of neighbourhood change. The original decomposition method (Van Kerm, Citation2004) separates the contributions of two main factors to total change in absolute incomes experienced by individuals over time: (1) their reranking within the distribution; and (2) change in the marginal income distribution due to structural processes. The second factor is further broken down to separate the effects of changing dispersion (inequality) of the income distribution and income growth. When applied to neighbourhood change (Modai-Snir & van Ham, Citation2018a), three factors contributing to neighbourhood income change within a single urban area were defined accordingly: (1) reordering of neighbourhood positions within the urban neighbourhood hierarchy; (2) increasing inequality among neighbourhoods of a single urban area; and (3) overall growth or decline in neighbourhood average incomes across the entire urban area.
The approach is based on measuring neighbourhood change such that it captures variegating effects on neighbourhoods both at the between- and within-city levels. A neighbourhood is considered as having experienced income change if it upgraded relative to other neighbourhoods in the same city, but also if all city neighbourhoods experienced income upgrades relative to neighbourhoods of another city. To capture both variegating effects, the measure of change we use is in terms of absolute income; this is opposed to the common practice of measuring change in neighbourhoods’ city-relative measures of income which focus exclusively on within-city variegating effects (more on absolute versus relative measures in Modai-Snir & van Ham, Citation2018b).
INTERACTIONS AMONG FACTORS OF NEIGHBOURHOOD CHANGE
The three factors of change reflect socio-spatial organization processes that operate in parallel. Complex interactions between them were revealed in recent studies that used the decomposition method. An analysis of neighbourhood change across 22 metropolitan areas in the United States (1980–2010) discovered a large variation across metropolitan areas in the roles of the three factors (Modai-Snir & van Ham, Citation2018a), and a negative relationship between the growth and inequality factors. The trade-off between them is related to different spatial levels of inequalities. The inequality factor refers to inequality within the urban area, and the divergent growth of income across cities reflects an increasing inequality between urban areas. If increasing inequality is absorbed between spatial units, this would be at the expense of inequality within them, and vice versa. In the United States, neighbourhood change in ‘superstar’ cities involved an important growth factor (average incomes in the city going up) and a less substantial inequality factor. The suggested explanation is that in most attractive cities, overheating housing markets spread gentrification processes to almost entire urban areas; low-income groups are pushed towards metropolitan edges and beyond. This implies that cities get richer while poverty suburbanizes. In this case, inequality is increasingly absorbed at the between-city level, while inequality among neighbourhoods within the city remains at a similar level.
Housing systems in more regulated markets, such as in the Netherlands, have an important role in interfering with these dynamics. Rent control measures and an extensive provision of public housing can moderate gentrification and displacement processes (van Gent, Citation2013). Increasing demand for higher cost housing in a city, combined with limited displacement of low-income groups, increase within-city levels of inequality. Likewise, divergent income growth across cities should be less substantial in regulated housing markets given that a considerable amount of inequality is absorbed within urban areas, at the expense of inequality between them.
The reordering and inequality factors affect the socio-spatial positioning of neighbourhoods relative to each other within the urban area. They can affect specific neighbourhoods simultaneously, in opposite directions. Modai-Snir and van Ham (Citation2018b) examined these opposite effects empirically and explained the theoretical rational: The reordering of the neighbourhood hierarchy follows a general pattern of mean reversion. In the long run, neighbourhoods cycle up and down the urban hierarchy such that low-income neighbourhoods are likely to increase, and high-income neighbourhoods are likely to decrease in relative status (Rosenthal, Citation2008). The effect of inequality makes low-income neighbourhoods decrease and high-income neighbourhoods increase in terms of absolute income, as follows from the effects of inequality on individual-income distributions. Gentrification processes are a typical example of complex interactions between these factors. Gentrifying neighbourhoods typically increase their relative position in the urban hierarchy because they draw high-income people from other places in the city. If a considerable proportion of a neighbourhood’s housing stock is still occupied by low-income households, increasing inequality may generate decreases in absolute average incomes and attenuate the appearance of neighbourhood upgrades. As the high-income group becomes the majority, the effect of inequality on neighbourhood status can become positive. The stage of gentrification determines, therefore, the effect of the inequality factor on gentrifying neighbourhoods.
The aim of this paper is to assess the extent to which each of the three factors, reordering, increasing inequality and growth, played a role in changing neighbourhood socioeconomic conditions in the four largest Dutch cities. Particularly, it seeks to evaluate the distinctive role of structural processes which are assumed to have been substantial given the process of housing-market restructuring in the Netherlands.
DATA AND RESEARCH AREAS
The data for this study were obtained from the Social Statistical Database (SSD), a unique longitudinal individual-level data set from the CBS. The database covers the entire population of the Netherlands and links data from various registers and surveys. Each observation has a specific address that can be linked to various spatial units. We aggregated individual-level data by neighbourhoods (Buurten) as delineated by the CBS, which adhere to recognized physical boundaries and represent relatively homogeneous areas. The average Buurt population is around 2000–2500 residents, but it varies considerably. To avoid inconsistency in boundary delineations (because of modifications made by the CBS), we linked each observation to neighbourhood delineations from 2014.
Disposable income data are only available for the whole population since 2010. Up to 2009, such data are only available for a sample which would yield too few observations in many neighbourhoods. Therefore, we used pre-taxed incomes (including income from employment, self-employment, pensions, social security benefits and student allowances), which are available for the period 1999–2014. By using pre-taxed incomes, the analysis does not take into account the effect of an important equalizing mechanism of the Dutch welfare state. Other components of ‘real incomes’, for example, various subsidies, are also not included in the income variable. Both limitations should be considered in interpreting results. Average neighbourhood income was computed by dividing summed income over all individuals in a neighbourhood by the number of residents aged 18 years and over. This way we account for the effect of unemployment on neighbourhood status. Although people aged 18–24 are often not yet fully active in the labour market, for example, because they are students, we included them because their effect on neighbourhood aggregate incomes plays a role in neighbourhood positioning within the urban hierarchy. The same applies to retired individuals whose pensions differ according to past income status, reflecting unequal resources. All incomes are in absolute terms and expressed in 2014 values.Footnote3
In contrast with previous studies on the Dutch context which focused on cities within municipal boundaries, we focus on metropolitan areas that roughly represent the extent of a housing and labour market.Footnote4 The metropolitan regions of Amsterdam (Stadsregio Amsterdam), Rotterdam (Stadsregio Rotterdam), The Hague (Stadsgewest Haaglanden) and Utrecht (Bestuur Regio Utrecht) consist of 36, 15, nine and nine municipalities, respectively. Their geographical definition is based on functional partnerships between municipalities surrounding each core city that focus mainly on transport policy, provision of public transport and housing. After excluding neighbourhoods with fewer than 50 income observations, the number of neighbourhoods analysed in the Amsterdam, Rotterdam, The Hague and Utrecht city-regions sum to 772, 451, 352 and 267 neighbourhoods, respectively. Core municipality neighbourhoods are considered as those confined by municipal boundaries of each of the four cities.
METHOD
This paper uses a method presented by Van Kerm (Citation2004) in the context of income mobility, which has been recently applied in the context of neighbourhood change (Modai-Snir & van Ham, Citation2018a). The method quantifies contributions of three factors to the total change in neighbourhood absolute incomes: (1) reordering of neighbourhoods within a given distribution of neighbourhood average incomes; (2) increasing inequality among neighbourhoods; and (3) overall growth or decline of incomes among all neighbourhoods in the metropolitan area. Income change is measured by relating to two income observations, at different time points, for each neighbourhood. Each urban area is associated with two vectorsFootnote5 of neighbourhood average incomes: one denotes the array of neighbourhood average incomes at the beginning of the period (time t) and the other denotes the same array at the end (time t + 1). They are termed hereafter initial and final vectors of observed incomes, respectively. Total income change within a single urban area can be summarized by relating the two vectors.
The decomposition method is based on the construction of hypothetical neighbourhood income vectors, each reflecting a vector of neighbourhood average incomes that would be observed at time t + 1, if only one of the three factors had an effect (for additional explanations, see Van Kerm, Citation2004):
The first hypothetical vector demonstrates the isolated effect of reordering; it is the vector of neighbourhood average incomes that would be observed at time t + 1 if all neighbourhoods followed the same reordering of relative positions observed in the data, without any increase in inequality among neighbourhoods nor a growth of average incomes. It is constructed by ordering the observed vector of initial neighbourhood average incomes according to the rank orders of the observed vector of final incomes.
The second hypothetical vector would be observed at time t + 1 if neighbourhoods were only influenced by increasing inequality, but not by overall income growth or reordering. It is constructed by reordering the vector of neighbourhood average incomes observed at time t + 1 according to neighbourhood original rank orders that were observed at time t (which eliminates the effect of reordering) and then by multiplying the vector by the ratio between the means of neighbourhood average incomes at time t and t + 1 (which eliminates the effect of growth).
The third hypothetical vector only incorporates the effect of the growth or decline in incomes. It is constructed by inflating the vector of initial incomes by the ratio between the means of neighbourhood average incomes at time t + 1 and t.
The amount of change associated with the transition between the initial vector of observed income and each hypothetical vector is computed using a mobility measure proposed by Fields and Ok (Citation1999), defined as the sum of differences in log incomes between the final and initial periods, of all individuals in a group or society. In the neighbourhood context, the measure refers to the difference in logs of neighbourhood average incomes:where C stands for the amount of change; and
and
refer to the average incomes of neighbourhood i at a times t + 1 and t, respectively. When computing the measure using hypothetical vectors related to factors a, b or c, instead of the observed vector of final incomes, we derive the total change in the urban system that can be attributed to each factor. Subgroup contributions can be aggregated to indicate the role of each factor among neighbourhood groups (in that case the measure is used without the absolute-value notation). Finally, the Shapley decomposition procedure (Shorrocks, Citation2013), which averages contributions given different elimination sequences, is used to derive factor components that add up to the total amount of change (Van Kerm, Citation2004).
RESULTS
The four Dutch cities included in this study have gone through typical processes of socio-spatial change, but followed distinctive trajectories due to their differing historical, geographical, social and economic contexts. Summary statistics (, top panel) show some commonalities and divergences. In 1999, neighbourhoods in Amsterdam and Utrecht metropolitan areas had higher mean incomes than those in Rotterdam and The Hague. In the next 15 years, neighbourhoods in the respective metropolitan areas further diverged, as indicated by metropolitan averages of neighbourhood income change. Standard deviations of neighbourhood average incomes were higher in Amsterdam and The Hague, implying higher inequality between their neighbourhoods. This inequality intensified substantially in these city-regions during the 1999–2014 period.
Table 1. Descriptive statistics (top) and relative contributions of neighbourhood change components in each city (bottom).
Examining how these processes operated at different spatial levels reveals a common pattern. In all cities, neighbourhood mean incomes at the starting point of this study were lower in core-municipality neighbourhoods, compared with the average over all neighbourhoods of each respective metropolitan area. The change in average incomes was substantially higher among core-municipality neighbourhoods compared with metropolitan areas, and so was the increase in standard deviations. Core-municipality neighbourhoods, therefore, have become wealthier and more unequal (among themselves) than their suburban counterparts. The statistics reveal that distinctive socio-spatial processes took place in all four cities: increasing urban inequality, reordering of urban neighbourhood hierarchies and divergent income growth among the cities. The following analysis will examine the relative importance of each factor.
The roles of three change components
The roles of the reordering, inequality and growth factors vary across the four city-regions. However, the reordering factor is the dominant one with a contribution ranging between 73% and 88% of the total change (, bottom panel). Amsterdam displays the weakest relative effect of reordering, with growth and inequality appearing as important components (11% and 16%, respectively). The role of the growth factor has been most important among the neighbourhoods of Utrecht, coupled with the lowest contribution of the inequality factor among the four city-regions. In Rotterdam too, the contribution of the inequality factor was modest (7%). It was the highest in The Hague (20%), which is associated with the most pronounced levels of segregation and a historical and geographical divide between poor and rich areas.
To understand how factor contributions affected neighbourhood socioeconomic hierarchies of each city-region, we computed average factor contributions for neighbourhood income quintiles. Contributions are computed as positive or negative, corresponding to increases and decreases in neighbourhood average incomes, respectively. demonstrates how the growth factor accounts for a ‘baseline’ increase across each city’s neighbourhood hierarchy. Neighbourhoods in Amsterdam and Utrecht, regardless of their relative position in the urban hierarchy, improved their conditions more than those in Rotterdam and The Hague because of an upward shift of the whole neighbourhood income distribution. Change related to the inequality factor is tied to the neighbourhood income distribution at the starting point of the study. When the level of inequality among neighbourhoods increases, low-income neighbourhoods decrease and high-income neighbourhoods increase in average incomes. This effect is prominent in Amsterdam and The Hague, where the inequality factor was most important. The effect on middle-income neighbourhoods is also remarkable. Change in urban income distributions in Amsterdam and The Hague was such that neighbourhoods pertaining to quintiles 1–4 in 1999 experienced progressive decreases associated with that factor and only neighbourhoods of the top quintile experienced increases. In The Hague, low-income neighbourhoods (quintiles 1 and 2) were subject to the most important inequality-related drop in incomes. A similar pattern, but more modest, was found for Rotterdam. In Utrecht, the effect of inequality was negligent across the hierarchy.
Figure 1. Component contributions across neighbourhood income quintiles of each city.
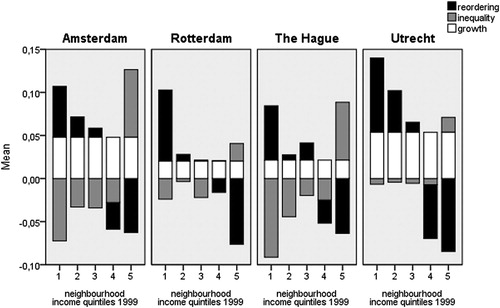
Contributions associated with the reordering factor follow an opposite pattern of change compared with those of the inequality factor, with increases among low-income neighbourhoods and decreases among high-income ones. In Utrecht, the effect is the largest across the entire hierarchy. The counteracting pattern of the inequality factor may have led, in some cases, to a situation where an increase in relative positions did not yield a substantial increase in neighbourhood average incomes (in absolute terms). It is important to note, however, that while the starting income position completely determines the change associated with the inequality factor, it only explains up to 10% of the change related to the reordering component in each city (variance components derived using analysis of variance (ANOVA) type 3 sum of squares). This means that other variables, apart from the starting income position, may have an impact on the counteracting pattern.
The spatial patterning of change due to reordering and inequality
In examining spatial patterns of factor contributions, we are interested in how income disparities between core-municipality neighbourhoods and outlying neighbourhoods developed. The growth factor represents an even spread of income change throughout each metropolitan area and has no effect on the within-city socio-spatial organization; the maps focus, therefore, on the reordering and inequality factors of change.
The maps of change related to reordering () reveal that in all city-regions almost the entire core upgraded (blue colours), whereas a large proportion of neighbourhoods in outlying areas downgraded (red colours). This pattern emerges as more extreme than it would be if standard measures of neighbourhood change were used, because they would include the counteracting effect of the inequality factor. In Amsterdam, for example, many neighbourhoods were negatively affected by inequality (), an effect which was not actually felt because positive effects of reordering (and growth) factors offset this negative effect.
Figure 2. Neighbourhood change associated with the ‘reordering’ factor.
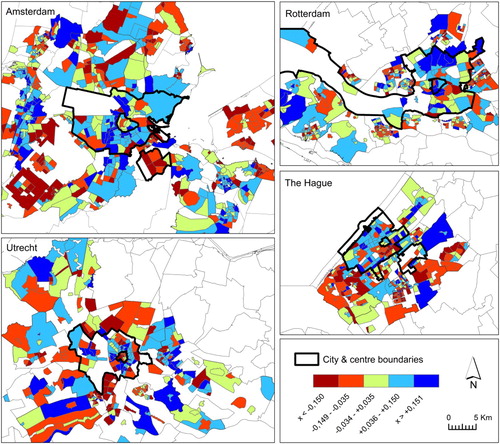
Figure 3. Neighbourhood change associated with the ‘inequality’ factor.
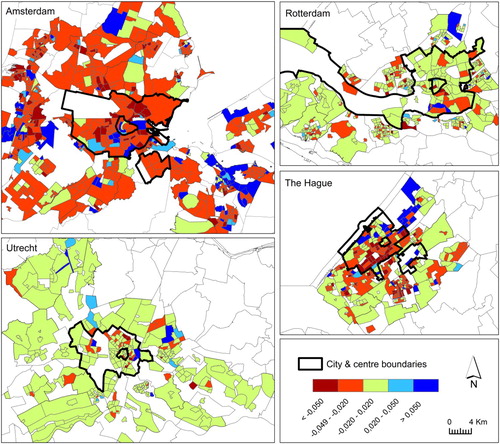
The spatial pattern of reordering in The Hague reveals that in contrast with a previous study that found an exacerbation of the divide along historical lines (Bailey et al., Citation2017), only a cluster of neighbourhoods south to the centre has declined in relative positions (). The south-east actually shows positional increases. Inequality-related change is spatially distributed similarly to the findings of the previous study () such that in some low-income areas it offset the positive effect of positional upgrading. Intra-city disparities would diminish without the counteracting effect of the inequality factor.
In Rotterdam, the spatial pattern of reordering involves downgrading in suburban areas adjacent to municipality borders. Within the city, northern neighbourhoods upgraded in relative positions while those in the south stagnated or decreased. Inequality-related change follows the same pattern but is not substantial in magnitude. In Utrecht, a radial pattern of reordering is evident with increases and decreases from both sides of city boundaries.
CONCLUSIONS
The aim of this paper was to examine processes underlying neighbourhood socioeconomic change in the four largest Dutch cities. Specifically, it sought to assess the role of structural processes during a period characterized by a restructuring of the housing market. It used a decomposition method from income mobility research (Van Kerm, Citation2004), which was adjusted to study neighbourhood change (Modai-Snir & van Ham, Citation2018a). The method separated the contributions of three factors: (1) reordering of neighbourhoods within a given urban hierarchy of neighbourhoods; (2) increasing inequality among neighbourhoods of an urban area; and (3) growth or decline of incomes across the entire urban neighbourhood hierarchy. The latter two are considered structural factors as they portray changes in the urban neighbourhood hierarchy.
The first two research questions are concerned with the importance of the inequality and growth ‘structural’ factors in understanding neighbourhood change, respectively. We found that these factors accounted together for 12–27% of each city’s total neighbourhood change. Amsterdam and Utrecht stand out in the importance of the income growth factor, highlighting the continuing economic dominance of the Randstad’s north wing. The divergent growth of incomes implies that relatively disadvantaged neighbourhoods in the Randstad’s north have become better off in absolute conditions compared with those in the south. This finding conforms to the evidence on growing divergence between cities given different economic bases (Florida, Citation2002; Moretti, Citation2012) and emphasizes the overall effect on neighbourhoods of those cities. Hence, disadvantage of neighbourhoods relative to their respective cities should not be the sole consideration in devising urban policies; absolute conditions matter. On the other hand, Amsterdam and The Hague stand out in the role of the inequality factor in neighbourhood change. This drives attention to increasing income gaps (in absolute terms) between neighbourhoods at the bottom and top of the urban hierarchy of these two cities. Especially in Amsterdam, the impact of this factor is likely to be an outcome of the changing composition of the housing stock, as described by van Gent (Citation2013).
To put the findings for the Netherlands in context it is interesting to compare them with American urban areas. A similar decomposition analysis using US data for the period 1980–2010 revealed a larger variation among cities in factor contributions with ‘structural’ factors accounting together for between 22% and 74% of total change (Modai-Snir & van Ham, Citation2018a). Neighbourhoods in American cities are thus much more affected by changing urban income compositions than in the Netherlands. This comparison suggests that despite significant structural changes in Dutch cities, the housing market regime seems to still function as a buffer to changing socio-spatial structures.
The relationship between the inequality and growth factors also distinguishes the Dutch and American contexts. In American ‘superstar cities’ specifically, the role of the inequality factor in neighbourhood change was negligible compared with that of the growth factor (Modai-Snir & van Ham, Citation2018a). The inequality factor accounted for between 3% and 4% of total change in neighbourhood average incomes in New York, San Francisco, Boston and Washington, DC, compared with 16% in Amsterdam and 20% in The Hague. Taking into account the larger scale of the examined American metro areas, the difference in the role of inequality is even more striking (the larger the population, the more heterogeneous we expect it to be). The growth factor in those American cities accounted for around 50–70% of the total change in neighbourhood average incomes compared with a maximum of 17% in the Dutch context. While the increasing role of divergence between cities follows similar patterns as those described for the United States (Florida, Citation2002; Moretti, Citation2012), the magnitude is of different scale. The pricing out of low- and middle-income classes in American attractive cities, as described by Shaw (Citation2018), implies that inequality is increasingly absorbed beyond metropolitan boundaries rather than within them (Modai-Snir & van Ham, Citation2018a). In the inevitable trade-off between inequality among cities and inequality within cities, the Dutch context points to dominance of the latter. This may be perceived as the lesser of two evils as it represents weaker socio-spatial divides. These findings can again be explained by the regulated housing market, which apparently impedes gentrification and displacement to some extent.
The third research question concerns the impact of neighbourhood reordering on where different income groups are located in each city-region. All four city-regions share a spatial pattern of ‘inside-out’ reversal, which has also been confirmed for cities in other countries (e.g., Hulchanski, Citation2011, for Toronto; and Bailey & Minton, Citation2017, for the UK). Core-municipality neighbourhoods upgraded because of the increase in relative income positions compared with suburban neighbourhoods. This pattern is especially evident in Amsterdam and conforms to the spatial pattern of housing tenure conversions revealed by Boterman and van Gent (Citation2014) and the consequent suburbanization of poverty (Hochstenbach & Musterd, Citation2018).
The fourth question is concerned with how the reordering and inequality factors intersect given their distinct spatial patterns. While the spatial pattern of reordering reflects contemporary trends, the pattern of the inequality factor reflects the effect of past structures because it is tied to initial positions in the urban hierarchy. In the case of The Hague, inequality-related change follows spatial patterns associated with the historical divide. Change due to reordering reflects contemporary trends of inner-city revival and suburban downgrading. The exacerbation of the socio-spatial divide in The Hague (Bailey et al., Citation2017), therefore, can be largely attributed to structural processes that increased urban inequality, as was shown for Tel-Aviv, which also exhibits a prominent historical divide (Modai-Snir & van Ham, Citation2018b). In Amsterdam, most core municipality neighbourhoods experienced some inequality-related downgrading given their initially low position in the urban hierarchy. This downgrading was offset by their extensive positional upgrading. The effect of inequality masks contemporary socio-spatial trends in both cities.
As a note of caution, given the use of pre-taxed data in this study, we did not fully take into account the redistributive nature of the Dutch welfare-state. A further step in understanding how restructuring influences neighbourhoods would be to examine if structural factors are of similar importance considering post-taxed incomes, once these data become available for an extended period.
To conclude, the decomposition of total change in neighbourhood average incomes points to structural factors as important drivers of change which are subject to substantial regional variation. Overall income growth in Amsterdam and Utrecht signifies increases at the top of the Dutch interregional hierarchy which dragged up all neighbourhoods of those city-regions. This finding indicates that neighbourhood change is strongly tied to the dynamics of the interregional hierarchy which, in the Dutch case, are seemingly affected by emergent urban policies. Regional variation in the role of inequality points to the differing local circumstances that either intensify or mitigate increasing heterogeneity in incomes. Most likely this has to do with the different economic bases of cities and historical development patterns, but also with housing policies that either facilitated or impeded this process.
DISCLOSURE STATEMENT
No potential conflict of interest was reported by the authors.
Additional information
Funding
Notes
1. Data were extracted from online databank of Statistics Netherlands (https://opendata.cbs.nl/statline).
2. See the definition of the neighbourhood sorting index (NSI) (Jargowsky, Citation1996) as the ratio of between-tract variance in average incomes over the total variance of individual-level incomes. Between-tract variance is, therefore, the product of inequality and segregation.
3. To remove the effect of inflation, we used yearly consumer price indices published by the CBS.
4. Considering the four cities as a single housing and labour market would not be justified, despite their functioning as the larger Randstad agglomeration; network formation between cities is not intensive among all sectors (Burger et al., Citation2014).
5. Here, the term ‘vector’ stands for a single column matrix.
REFERENCES
- Bailey, N., & Minton, J. (2017). The suburbanisation of poverty in British cities, 2004–16: Extent, processes and nature. Urban Geography, 39(6), 892–915. https://doi.org/10.1080/02723638.2017.1405689
- Bailey, N., van Gent, W. P. C., & Musterd, S. (2017). Remaking urban segregation: Processes of income sorting and neighbourhood change. Population, Space and Place, 23(3), Article e2013. https://doi.org/10.1002/psp.2013
- Bolt, G., van Kempen, R., & Van Weesep, J. (2009). After urban restructuring: Relocations and segregation in Dutch cities. Tijdschrift voor Economische en Sociale Geografie, 100(4), 502–518. https://doi.org/10.1111/j.1467-9663.2009.00555.x
- Booza, J., Cutsinger, J., & Galster, G. (2006). Where did they go?: The decline of middle-income neighborhoods in metropolitan America. The Brookings Institution.
- Boterman, W. R., & van Gent, W. P. C. (2014). Housing liberalisation and gentrification: The social effects of tenure conversions in Amsterdam. Tijdschrift voor Economische en Sociale Geografie, 105(2), 140–160. https://doi.org/10.1111/tesg.12050
- Brueckner, J. K., & Rosenthal, S. S. (2009). Gentrification and neighborhood housing cycles: Will America’s future downtowns be rich? Review of Economics and Statistics, 91(4), 725–743. https://doi.org/10.1162/rest.91.4.725
- Buitelaar, E., Weterings, A., Raspe, O., Jonkeren, O., & Boterman, W. (2016). The divided triumph: Exploration of urban-economic inequality and options for policy (No. 1777 ). Planbureau voor de Leefomgeving. [in Dutch]
- Burger, M. J., van der Knaap, B., & Wall, R. S. (2014). Polycentricity and the multiplexity of urban networks. European Planning Studies, 22(4), 816–840. https://doi.org/10.1080/09654313.2013.771619
- Cooke, T., & Marchant, S. (2006). The changing intrametropolitan location of high-poverty neighbourhoods in the US, 1990–2000. Urban Studies, 43(11), 1971–1989. https://doi.org/10.1080/00420980600897818
- Fainstein, S. S. (2010). The just city. Cornell University Press.
- Fields, G. S., & Ok, E. A. (1999). Measuring movement of incomes. Economica, 66, 455–471. doi: 10.1111/1468-0335.00183
- Florida, R. L. (2002). The rise of the creative class : And how it’s transforming work, leisure, community and everyday life. Basic.
- Groot, S., & de Groot, H. (2013). Wage inequality in the Netherlands: Evidence, trends and explanations (Discussion Paper No. 186]. CPB (Netherlands Bureau for Economic Policy Analysis). Retrieved from https://www.cpb.nl/sites/default/files/publicaties/download/cpb-discussion-paper-186-wage-inequality-netherlands-evidence-trends-and-explanations.pdf
- Hess, D. B., Tammaru, T., & van Ham, M. (2018). Lessons learned from a pan-European study of large housing estates: Origin, trajectories of change and future prospects. In D. B. Hess, T. Tammaru, & M. van Ham (Eds.), Housing estates in Europe: Poverty, ethnic segregation and policy challenges (pp. 3–31). Springer.
- Hochstenbach, C., & Musterd, S. (2018). Gentrification and the suburbanization of poverty: Changing urban geographies through boom and bust periods. Urban Geography, 39(1), 26–53. https://doi.org/10.1080/02723638.2016.1276718
- Hochstenbach, C., & van Gent, W. (2015). An anatomy of gentrification processes: Variegating causes of neighbourhood change. Environment and Planning A: Economy and Space, 47(7), 1480–1501. https://doi.org/10.1177/0308518X15595771
- Hulchanski, D. J. (2011). The three cities within Toronto: Income polarization among Toronto’s neighbourhoods, 1970–2005. Neighbourhood Change Research Group, Cities Centre, University of Toronto. Retrieved from http://3cities.neighbourhoodchange.ca/
- Jargowsky, P. A. (1996). Take the money and run: Economic segregation in U.S. metropolitan areas. American Sociological Review, 61(6), 984–998. https://doi.org/10.2307/2096304
- Kadi, J., & Musterd, S. (2015). Housing for the poor in a neo-liberalising just city: Still affordable, but increasingly inaccessible. Tijdschrift voor Economische en Sociale Geografie, 106(3), 246–262. https://doi.org/10.1111/tesg.12101
- Kazepov, Y. (2005). Cities of Europe: Changing contexts, local arrangements, and the challenge to social cohesion. Blackwell.
- Kleinhans, R. (2004). Social implications of housing diversification in urban renewal: A review of recent literature. Journal of Housing and the Built Environment, 19(4), 367–390. https://doi.org/10.1007/s10901-004-3041-5
- Meijers, E. (2007). Clones or complements? The division of labour between the main cities of the Randstad, the Flemish Diamond and the RheinRuhr area. Regional Studies, 41(7), 889–900. https://doi.org/10.1080/00343400601120239
- Meijers, E., Hoogerbrugge, M., Louw, E., Priemus, H., & Spaans, M. (2014). City profile: The Hague. Cities, 41, 92–100. https://doi.org/10.1016/j.cities.2014.05.012
- Modai-Snir, T., & van Ham, M. (2018a). Structural and exchange components in processes of neighbourhood change: A social mobility approach. Applied Spatial Analysis and Policy, 12, 423–443. https://doi.org/10.1007/s12061-017-9249-z
- Modai-Snir, T., & van Ham, M. (2018b). Neighbourhood change and spatial polarization: The roles of increasing inequality and divergent urban development. Cities, 82, 108–118. https://doi.org/10.1016/j.cities.2018.05.009
- Moretti, E. (2012). The new geography of jobs. Houghton Mifflin Harcourt.
- Musterd, S. (2014). Public housing for whom? Experiences in an era of mature neo-liberalism: The Netherlands and Amsterdam. Housing Studies, 29(4), 467–484. https://doi.org/10.1080/02673037.2013.873393
- Musterd, S., & van Gent, W. P. C. (2015). Changing welfare context and income segregation in Amsterdam and its metropolitan area. In T. Tammaru, S. Marcińczak, M. van Ham, & S. Musterd (Eds.), Socio-economic segregation in European capital cities: East meets west (pp. 55–79). Routledge.
- Organisation for Economic Co-operation and Development (OECD). (2015a). In it together: Why less inequality benefits all. OECD. https://doi.org/10.1787/9789264235120-en
- Organisation for Economic Co-operation and Development (OECD). (2015b). In it together: Why less inequality benefits all … in the Netherlands. OECD. https://www.oecd.org/netherlands/OECD2015-In-It-Together-Highlights-Netherlands.pdf
- Randolph, B., & Tice, A. (2014). Suburbanizing disadvantage in Australian cities: Sociospatial change in an era of neoliberalism. Journal of Urban Affairs, 36(Suppl. 1), 384–399. https://doi.org/10.1111/juaf.12108
- Reardon, S. F., & Bischoff, K. (2011). Income inequality and income segregation. American Journal of Sociology, 116(4), 1092–1153. https://doi.org/10.1086/657114
- Rosenthal, S. S. (2008). Old homes, externalities, and poor neighborhoods. A model of urban decline and renewal. Journal of Urban Economics, 63(3), 816–840. https://doi.org/10.1016/j.jue.2007.06.003
- Sassen, S. (1991). The global city: New York, London, Tokyo. Princeton University Press.
- Shaw, R. (2018). Generation priced out. University of California Press.
- Shorrocks, A. F. (2013). Decomposition procedures for distributional analysis: A unified framework based on the Shapley value. Journal of Economic Inequality, 11(1), 99–126. https://doi.org/10.1007/s10888-011-9214-z
- Tammaru, T., Marcinczak, S., Aunap, R., van Ham, M., & Janssen, H. (2019). Relationship between income inequality and residential segregation of socioeconomic groups. Regional Studies. https://doi.org/10.1080/00343404.2018.1540035
- Tammaru, T., Marcińczak, S., Van Ham, M., & Musterd, S. (2015). Socio-economic segregation in European capital cities: East meets West. Routledge.
- Teernstra, A. (2014). Neighbourhood change, mobility and incumbent processes: Exploring income developments of in-migrants, out-migrants and non-migrants of neighbourhoods. Urban Studies, 51(5), 978–999. https://doi.org/10.1177/0042098013494422
- Teye, A. L., Knoppel, M., de Haan, J., & Elsinga, M. G. (2017). Amsterdam house price ripple effects in The Netherlands. Journal of European Real Estate Research, 10(3), 331–345. https://doi.org/10.1108/JERER-11-2016-0041
- Uitermark, J., & Bosker, T. (2014). Wither the ‘undivided city’’? An assessment of state-sponsored gentrification in Amsterdam’. Tijdschrift voor Economische en Sociale Geografie, 105(2), 221–230. https://doi.org/10.1111/tesg.12072
- Van der Wusten, H., & Musterd, S. (1998). Welfare state effects on inequality and segregation: Concluding remarks. In S. Musterd, & W. Ostendorf (Eds.), Urban segregation and the welfare state. Inequality and exclusion in Western cities, pp. 238–247. Routledge.
- Van Gent, W. P. C. (2013). Neoliberalization, housing institutions and variegated gentrification: How the ‘third wave’ broke in Amsterdam. International Journal of Urban and Regional Research, 37(2), 503–522. https://doi.org/10.1111/j.1468-2427.2012.01155.x
- Van Kempen, R., & Murie, A. (2009). The new divided city: Changing patterns in European cities. Tijdschrift voor Economische en Sociale Geografie, 100(4), 377–398. https://doi.org/10.1111/j.1467-9663.2009.00548.x
- Van Kempen, R., & Van Weesep, J. (1994). Gentrification and the urban poor: Urban restructuring and housing policy in Utrecht. Urban Studies, 31(7), 1043–1056. https://doi.org/10.1080/00420989420080941
- Van Kerm, P. (2004). What lies behind income mobility? Reranking and distributional change in Belgium, Western Germany and the USA. Economica, 71(282), 223–239. https://doi.org/10.1111/j.0013-0427.2004.00367.x
- Van Oort, F. G. (2007). Spatial and sectoral composition effects of agglomeration economies in the Netherlands. Papers in Regional Science, 86(1), 5–30. https://doi.org/10.1111/j.1435-5957.2006.00088.x