
 ?Mathematical formulae have been encoded as MathML and are displayed in this HTML version using MathJax in order to improve their display. Uncheck the box to turn MathJax off. This feature requires Javascript. Click on a formula to zoom.
ABSTRACT
This paper identifies territorial patterns of location of R&D+I grants supporting projects within the Polish Smart Specialisation framework. Using a data set of R&D+I grants from the European Structural and Investment Funds (ESIFs), the paper analyses the geographical concentration of projects, the link between local characteristics and the implementation of projects, and attempts at cooperation among organizations implementing projects. The results show an urban–rural divide and confirm the agglomeration of projects around the main Polish cities and industrial locations. By contrast, less-than-adequate conditions in rural areas and smaller counties may limit the potential for attraction and implementation of Smart Specialisation Strategies (S3).
INTRODUCTION
Smart Specialisation Strategies (S3) is a place-based policy approach that asks regions or countries to define the main strategic domains for research and innovation investments (Foray et al., Citation2012). S3 is supposed to guide investments in innovation through the prioritization and concentration of public resources, and the mobilization of local assets and entrepreneurial capacity. European Commission regional policy grounded in the place-based approach made available the largest pan-European industrial policy funding programme to apply those principles (Gianelle et al., Citation2019).
This paper identifies territorial patterns of location and territorial cooperation aspects of research and development plus innovation (R&D+I) grant-supported projects from the European Regional Development Fund (ERDF) under Thematic Objective I (TOI) within the Polish Smart Specialisation framework. We focus on three aspects. First, we explore whether there is a territorial concentration of projects. Second, we focus on evidence of a link between local characteristics and the implementation of projects. Finally, we identify if attempts have been made regarding territorial cooperation in these projects.
Our research contributes to the literature on agglomeration economies and the literature discussing the conditions for attracting R&D+I activities. Cities and urban areas allow the sharing of common goods and facilities among firms, improve the quality of matching in the labour market between employers and employees, and facilitate the generation, diffusion and accumulation of knowledge (Duranton & Puga, Citation2004). Urban areas have more research and innovative activities because large metropolises have proportionally more inventors than smaller cities and generate more patents (Bettencourt et al., Citation2007).
More developed areas have skilled human capital, better technological infrastructure and ample physical capital. Furthermore, they concentrate on public organizations and private firms benefiting from co-location, agglomeration and the localized circulation of knowledge. These economic centres are more suitable for innovative activity. The agglomeration of actors is associated with the emergence of ‘intricate institutional systems’ that support the diffusion and exchange of knowledge, collaboration and interactions that are fundamental to the processes of innovation. Rural, remote or peripheral areas are often less developed and less innovative than more advanced areas, even if some manage to set up significant innovative capacities. In the case of Norway, Isaksen and Onsager (Citation2010) find that rural regions and small urban regions have a higher share of innovating firms, but radically innovating firms are generally located in large urban regions.
We address an implementation issue of national or regional Smart Specialisation where states or regions are expected to differentiate structurally (McCann & Ortega-Argilés, Citation2014). In the recent literature, we can find papers that try to address specificities of regions in the context of Smart Specialisation, for example, S3 in sparsely populated areas can be perceived as a challenge, but also an opportunity (Sörvik et al., Citation2019). Finally, we take the first step to cover the essence of the ‘learning regions’ approach in which internal and external interactions help local actors to develop innovations (Asheim, Citation2012).
The results of the analysis show that there is an urban–rural divide in the implementation of Smart Specialisation projects in Poland. The largest cities in Poland, as hubs of R&D+I activities and the attraction of foreign direct investment, in combination with better institutional capacities, facilitate the design and implementation of spatially targeted development projects. By contrast, less-than-adequate conditions in rural areas and smaller counties limit the potential for the attraction and implementation of S3.
RESEARCH BACKGROUND
Cohesion Policy is the European Union’s (EU) strategy to foster economic, social and territorial cohesion of its member states and regions (European Commission, Citation2017).Footnote1 While Cohesion Policy addresses all countries and regions across the EU, its main target being less developed regions and countries that receive the largest share of funding. Poland and its regions are considered part of this group of countries, and is among the biggest recipients of the European Structural and Investment Fund (ESIF). With respect to Thematic Objective I, Poland has also allocated the largest amount of money among the 28 EU member states (Gianelle et al., Citation2017). This objective aims at strengthening the research, technological development and innovation output of member states such as Poland which, according to the latest EU innovation scoreboard, is ranked as a moderate innovator and its regions among modest or moderate innovators (Hollanders & Es-Sadki, Citation2017, Citation2018).
Access to these funds was preceded by Smart Specialisation processes at national and regional levels, enabling the region to pass the ex-ante conditionality exercise. The implementation of national and 16 regional S3 is carried out by national and regional operation programmes. Although interactions between the national and regional levels are regular through some initiatives such as the Regional Forum for Smart Specialisation, general assemblies of National Smart Specialisation taskforces and other meetings, the coordination system for national and regional S3 seems to still be under preparation and is expected to be ready by 2020 (Klincewicz, Marczewska, & Szkuta, Citation2018). There are a few policy instruments in operational programmes under TOI supporting the implementation of national and regional S3 together. One is the joint undertaking initiative around common priorities between The National Centre for Research and Development in Poland and regions, represented by marshal authorities (Lubelskie, Silesia, Lower Silesia, Lódzkie). The scheme of the national operational programme – Regional Science and Research Agendas – addresses the regional S3 of the 16 Polish regions directly from a national level perspective (Klincewicz & Marczewska, Citation2017). Furthermore, the R&D+I infrastructure investments funded at a regional level must be agreed with the Ministry of Science and Higher Education and refer to the Polish R&D Infrastructure Road Map.
The literature has many factors that can affect the innovative capacity of less developed areas. Most notable are socioeconomic, institutional deficiencies and geographical isolation. Peripheral areas are those beyond the geographical limits of knowledge spillover from more innovative territories limiting the absorption of useful knowledge generated elsewhere. Furthermore, they suffer scarce resource endowments, low socioeconomic fabric, poor institutional quality and a lack of infrastructure (Rodríguez-Pose & Wilkie, Citation2019).
Regarding innovative activity, the literature also stresses the importance of dynamic social contexts characterized by strong relations based on trust and common understanding in strategic cooperation among public and private stakeholders (Martin & Sunley, Citation1996; Rodríguez-Pose, Citation2013; Rodríguez-Pose & Storper, Citation2006). Although public policies, which have clear incentive structures and rules, can support institutional change and joint action, initial conditions and the deployment of public intervention on the ground determines the outcome. The features of the socio-institutional context must be considered, and the success of a policy depends on the quality of its design and implementation processes. Moreover, innovation is generally not the outcome of activity by isolated stakeholders, but rather the result of complex evolutionary processes determined by them in networks embedded in wider socioeconomic systems (Edquist, Citation1997; Lundvall, Citation1992).
Referring to the ‘learning region’ concept (Asheim, Citation1996; Florida, Citation1995; Morgan, Citation1997; Storper, Citation1993), Smart Specialisation acknowledges innovation as a cooperative social venture in which the mobilization of local, often tacit, knowledge and repetitive learning across a network of public and private stakeholders plays a key role in unveiling new development paths. The literature on regional innovation systems emphasizes how such information can only come out through a learning process and collaboration between public and private sectors (Asheim et al., Citation2012; Rodrik, Citation2007).
When discussing the ‘learning region’ concept, we should be aware that innovation may not only be built on local knowledge, but also on the creativity inspired by knowledge developed elsewhere or even as imitation. Each territory usually develops its own ‘mode of innovation’ according to local conditions. The complex interplay between innovation processes and spatial context is covered by the concept of ‘territorial patterns of innovation’ (Capello & Lenzi, Citation2013). Access to knowledge can be limited by various types of distance – geographical, cognitive, organizational, societal or institutional – in which proximity to knowledge resources impacts these innovation processes (Boschma, Citation2005).
DATA AND RESEARCH OUTLINE
Data
Several data sources were used. From the Polish Government Open Data Portal, we identified the list of projects or broader actions co-financed under TOI of ESIF 2014–20 with the information on consortia partners and their location.Footnote2 This data are also used in other studies on Smart Specialisation implementation in Poland (Klincewicz et al., Citation2017; PAG, Citation2018).
From the raw data set we excluded projects referred to as financial instruments, equity investments, policy-supporting measures, cluster organizations, and those to be implemented by the Foundation for Polish Science or other actions implemented by intermediate bodies. We have two main reasons for supporting this decision. The first is that we focus on schemes that provide ‘grants’ for R&D+I activities such as capacity-building investments, including R&D infrastructure or supporting R&D+I activities carried out by enterprises or other kinds of entities (e.g., universities and research organizations), but addressing the R&D+I needs of enterprises. This approach results in the decision to exclude grants provided by the Foundation for Polish Science, which instead focus on scientific projects. The second reason is the fact that for several excluded projects the beneficiaries play the role of the intermediary body that further allocates the funds. Nevertheless, we make one exception regarding our rationale when we consider the innovation voucher instrument scheme, which offers a small grant for the purchase of external R&D+I-supporting services such as feasibility studies and intellectual property protection. Finally, the data set of projects to be further investigated reached 4276 projects.Footnote3
Following the fact that under this Thematic Objective, 96.3% (105 of 109) of call announcements published between 2014 and 2016 in Poland were S3 related (Gianelle et al., Citation2017) – although some (Sectoral Programmes) did not have a strict priority alignment mechanism (Gianelle et al., Citation2019) – we can reasonably claim that the predominance of the projects that we identify should concern the Polish national or regional Smart Specialisation framework.
When considering the total number of projects and the allocated ERDF funding, most are dedicated to small and medium-sized enterprises (SMEs). In terms of co-funding, direct SME support retains its dominant position but loses percentage points in terms of large enterprises and public R&D infrastructure. When analysing national and regional perspectives separately, the regions granted more SME-oriented projects than were allocated at national level; but in terms of funding, the quote dedicated to public R&D institutions is the highest of all categories at regional level. Clearly, besides three exceptions, the national level dominates by funding projects under all categories. The projects of large enterprises are mainly financed at the national level (97.05%). From these figures, we can also see that the majority of ERDF-contracted funds were allocated at the national level (75.98%). This structure can follow the allocation of funds according to the partnership agreement between the Polish government and the European Commission.Footnote4
The identified investments are analysed according to their declared territorial project. As to the territorial unit for our empirical analysis, we chose county level – called Powiat in Polish – given the scarce availability of socioeconomic data at the lower municipal level.
At this point, it should be noted that the location of the projects may be different from the registration location of beneficiaries and may follow their offices, branches, registered local units or institutions engaged in carrying out R&D+I activities.Footnote5
The statistical data for the years 2014–16, which characterize the socioeconomic conditions of counties, come from the Local Bank Data of Statistics Poland. The number of enterprises was retrieved from structural changes in groups of entities within the national economy data set, and the data on patent applications came from the Register Plus web application available through the Polish Patent Office website.
Econometric specification
To understand why some counties have a higher potential to attract investment in Smart Specialisation projects, we propose the following empirical model:where
is the number of Smart Specialisation projects in county i. This model associates the number of projects in a county with six dimensions: innovation capacity, specialization, density, social conditions, economic conditions and locational advantages.
To control for innovation capacity, we use the number of patent applications, .Footnote6 Despite considerable debate about the suitability of patent applications in the literature, it is noted that they not only reflect the introduction of commercially viable innovations but also are a barometer of a territory’s innovation capacities (Rodríguez-Pose & Wilkie, Citation2019). Patents measure the fertility of local innovation systems. The inclusion of this indicator does not raise an endogeneity problem as existing patent applications are not taken into account when evaluating S3 project proposals, and they can be outside the Smart Specialisation domain. One limitation of this variable is that many patents are filled by universities and research centres, which are usually located in large cities and not always directly linked to commercialization (Klincewicz & Marczewska, Citation2017).
In order to capture the degree of specialization within the economy, , we follow Crescenzi et al. (Citation2012) and include the Krugman specialization index, which measures how different the location’s economic structure is with respect to the rest of the country, as well as employment share in agriculture, industry, market services, and information and communication technologies (ICT).
Population density is used as a proxy for the agglomeration of economic activity (Rodríguez-Pose & Wilkie, Citation2019). Counties with greater population density are more urbanized, with urbanization being a source of knowledge generation, diffusion and accumulation (Duranton & Puga, Citation2004).
To control for social conditions, , we do not calculate ‘social filter’ (Crescenzi et al., Citation2007), but use the number of immigrants registered for permanent residence from Poland and abroad, the percentage of children in pre-school education, along with higher education graduates.
For economic conditions, , we enter the model as a set of variables that measure different aspects of the local economy. We include the number of registered enterprises to capture locations in which more firms are likely to garner more projects. We control for county specific labour market conditions that can be related to the attraction of Smart Specialisation investment funds. The relationship between innovation and both unemployment and wages have been extensively discussed in the literature (Aghion & Howitt, Citation1994; Fagerberg et al., Citation1997; Feldmann, Citation2013; Stiglitz, Citation2014). For our analysis, we use the registered unemployment rate and average monthly gross wage to capture labour market conditions. In order to capture possible spillovers regarding the location of foreign direct investments and innovative capacities of the counties (Barrell et al., Citation1997; Driffield & Love, Citation2003; Fu, Citation2008; Holland & Pain, Citation1998), we include the value of foreign capital investments. Crescenzi et al. (Citation2014) find that foreign investments may have a tendency to cluster in a limited set of locations.
To control for the fact that firms can benefit from being located close to the administrative power, is a dummy variable that takes the value 1 if the county is the capital of the province, and 0 otherwise;
is a dummy variable that takes the value 1 if the county neighbours a capital county. The administrative reform in 1999 reduced the number of voivodeships from 49 to 16. To account for the possible administrative effect of the old regional capitals, we include the variables
and
, which take the value 1 if the county was a former capital of a former voivodeship or if it neighbours a former capital, respectively, and 0 otherwise. The inclusion of these variables addresses the claim that even NUTS-3 regions are often too small to encompass functional urban areas (Capello & Lenzi, Citation2013).
Finally, denotes regional fixed effects and
is the error term. The model is estimated using a Poisson maximum-likelihood estimator to account for the fact that some counties do not have any Smart Specialisation project. All explanatory variables enter the model in logs, with the exception of the dummy variables.Footnote7
Cooperation research approach
The exploration of the notion of cooperation in the context of the ‘learning regions’ concept is the last aspect of our research. The expected internal or external multi-learning process among actors can occur inside incidental interactions or more permanent collaboration, clustering and networking exercises. Collaboration can be with customers, suppliers, higher education institutions or even competitors (Cosh et al., Citation2005). As the benefits arising from research collaboration between different partners are well recognized in the literature (Cunningham & Gök, Citation2016), they are not discussed here. The networks seem to be more advanced forms of research collaboration under which more than just one project can be carried out under the same network. It may not be directed toward the production of innovation, but rather support development of the competence which could lead to projects or even the establishment of ‘efficient partnerships’ (Bloch et al., Citation2019). The initiatives dedicated to the exchange of experience and establishing communication channels can be matters for the networking programmes. Furthermore, network management can be formally constituted (Cunningham & Ramlogan, Citation2016). Clusters are structures that embody groups of firms and other organizations such as ‘industrial districts’, ‘new industrial spaces’, ‘regional specialisations’ and ‘regional innovation systems’. This concept is supported by research on knowledge spillovers, the economics of agglomeration and Porter’s competitive advantage of nations (Uyarra & Ramlogan, Citation2016).
In the available data set of projects, and at this stage of our research, we can claim the existence of cooperation in four ways. The first can come from the specificity of policy measures that claim to support cooperation and technology transfer from one to the others. The Partnership Agreement between the European Commission and the Polish government underlines the need of support technology transfer through collaboration between the R&D sector and enterprises (MIiR, Citation2017). This is followed by all policy instruments, which in principle accept consortia or the subcontracting of some activities that support the main innovations to be performed by beneficiaries.
The different location patterns of the project have been broadly discussed in the literature. The Geography of Innovation literature still underlines the role of proximity and location for innovative activity. The existing research focuses on European-level policy programmes that support collaborative knowledge production across Europe (Scherngell, Citation2013), but also at the regional level, capturing the complex internal perspective (Broekel & Hartog, Citation2013; Isaksen & Onsager, Citation2010; Virkkala, Citation2007). The key issue for our second approach is the location of the project. In the list of beneficiaries, project location can include one or multiple territorial units. Using this information, we identify cooperation when more than one project location is stated.
In the third approach, the notion of cooperation can be identified by text mining techniques (Ronen Feldman, Citation2007) of abstracts arising from the project’s applications. These mention the following words: partnership, cooperation, cooperate, purchase, employment, employ and consortium. The exact matches, in Polish, have been verified according to the context in which these words are used. Besides, project abstracts often mention the names of partners.
Finally, in our study the notion of cooperation is investigated through R&D procurements (Pisano, Citation1990). This exploration can be based on the publicly available calls for tenders published by beneficiaries or their formal partners in relation to delivery of goods or services for the purpose of the project. In principle, these calls are published on a public database.Footnote8 The database itself was set up for the purpose of respecting the principle of competitiveness. Official guidelines provide a framework for a transparent procedure to select the right providers at reasonable prices (MIiR, Citation2017), and the selection of the key subcontractor can occur before or during the project implementation phase.
These four approaches may be used to identify intention, declaration or final evidence of cooperation, but some concerns may arise. The first method can be very general because some policy instruments do not force any beneficiaries to cooperate, while others impose the guideline that projects must be implemented within consortia. The second may provide proof for the establishment of more stable partnerships by project consortia. This kind of cooperation may already be based on the ‘efficient partnerships’ concept, but could be affected by the locations of different branches of the same entity. This issue has already been verified as we gained access to the database, which provides the location of all partners. The third approach, text mining, may be affected by mismatches of selected words – which may not be linked to the idea of collaboration – and while the project’s abstract may even mention collaboration, cooperation may never occur. The fourth approach is sensitive to changes in how calls are published and the implementation of some exceptions in related projects within the guidelines, so the information gathered in this database may be incomplete (MIiR, Citation2015, Citation2016, Citation2017).
RESULTS
Geographical pattern of the principal locations of projects
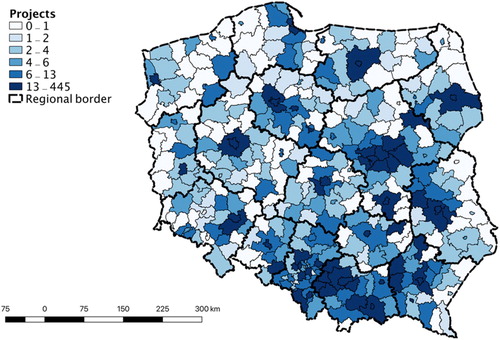
displays the territorial pattern of the principal project locations, showing the concentration of projects in the capitals of Polish regions and their surroundings.Footnote9 Sometimes this distribution is more balanced but it still has the leading role of the regional centre, for example, Lesser Poland, Podkarpackie, Silesia. In some cases, the former capitals of voivodeship host projects as centres of specific kinds of industries, for example, Radom, Plock (Masovia).
Figure 1. Territorial pattern of Smart Specialisation projects in Poland.
Source: Authors’ own elaboration.
To check if counties with a high number of projects are surrounded by counties that also have a high number of projects, presents the Moran scatter plot (Anselin, Citation1996). plots the number of projects in the county on the horizontal axis against the average number of projects of neighbouring counties on the vertical axis. All areas located above the horizontal dashed line and to the right of the vertical dashed line are considered to be counties with a higher number of projects that are surrounded by counties that also host a high number of projects. On the other hand, points below the horizontal dashed line and to the left of the vertical axes line are counties with a low number of projects surrounded by counties with a low number of projects.
Figure 2. Smart Specialisation location of projects: Moran scatter plot.
Source: Authors’ own elaboration.
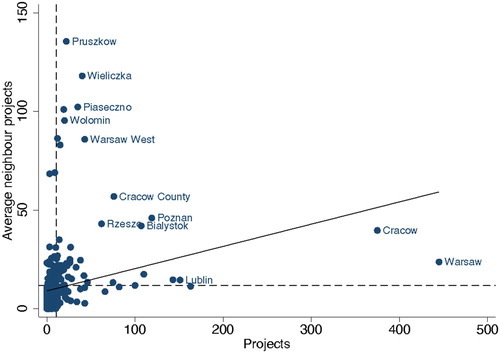
Warsaw and Cracow, the country’s capital and second biggest city respectively in terms of population and R&D capacities, host a very high number of projects and are surrounded by counties with a high number of projects. Counties Warszawski, Zachodni, Piaseczyński, Wołomiński and Pruszkowski – which surround Warsaw – and Wielicki and Krakowski – which surround Cracow – confirm that locations closer to the two biggest cities attract a high number of projects and learn from each other. The concentrated number of dots around point (0,0) shows the large number of counties with very few projects surrounded by counties with similarly low project numbers.
Beyond the graphical evidence, the existence of spatial autocorrelation of Smart Specialisation projects can be statistically tested using Moran’s I statistic, (Cliff & Ord, Citation1973; Moran, Citation1948). The application of this test reveals a statistically significant positive spatial autocorrelation. The Moran I static is around 0.113, statistically significant at the 0.01 level.Footnote10
Estimation results
presents the estimation results of equation (1) estimated using Poisson maximum likelihood and including regional fixed effects to control for the unobserved characteristic of the region.
Table 1. Estimation results.
The results show that higher innovation capacity is associated with more projects as the estimated coefficient for patent applications are positive and statistically significant in all models. Since patent applications are not taken into account when evaluating Smart Specialisation project proposals, the positive effect is explained by the learning environment generated by innovation activity within the county.
The Krugman specialization index is not significant, while the share of employment in agriculture is negative and significant and the share of employment in industry is positive and significant in columns (2) to (6). Crescenzi et al. (Citation2012) study the territorial dynamics of innovation in China and India and obtain positive and significant effects on specialization for China, but not for India. In a previous study, Crescenzi et al. (Citation2007) find no relationship between the degree of specialization and innovation for the United States, and identify a negative relationship for 15 EU countries at a higher level of territorial aggregation. However, Poland is not included in this research. Our result shows that being specialized in one sector of the economy is not associated with more projects, rather that locations with more activity in the industry sector attract a higher number of projects.
The non-significance of the Krugman specialization index should be taken with caution since this indicator has been built using only information on employment in five aggregated sectors of the economy – agriculture, industry, market services, and information and communication technologies, financial and insurance, and other services – due to data availability at county level.
Population density is positive and statistically significant, except when the share of agriculture is included in the model in columns (3) and (5), revealing that urban areas have greater potential to attract Smart Specialisation projects than rural areas. This result is in line with findings in the agglomeration economics literature in urban areas, as cities improve the machining in the labour market and facilitate the generation, diffusion and accumulation of knowledge (Duranton & Puga, Citation2004).
Regarding social conditions, immigration is the only factor that is positive and statistically significant. Immigrants may bring knowledge that is valuable for firms to perform more innovation activities and attract a higher number of projects (Crescenzi et al., Citation2007). The lack of significance for children’s education and higher education graduates is due to small differences in these variables within the same region, and regional fixed effects capture regional differences in these factors.
The number of registered enterprises is not significant in all models, revealing that economic size is not enough for a location to attract more projects. To do so, firms must perform well in terms of innovation activities, as shown before with the positive estimated coefficient for patents.
Wages and unemployment rates are not statistically significant, showing that economic well-being is not associated with more projects. Foreign capital investment is positive and slightly significant, suggesting that counties attracting more projects are also attractive to foreign investors, due to the tendency of foreign investment to ‘cluster’ in a limited set of locations (Crescenzi et al., Citation2014).
Being a regional capital is positively associated with a higher number of projects. This result is explained by agglomeration effects, the investment attractiveness of these counties, and the possible benefits of being closer to the administrative power. However, this effect is geographically limited to the capital, as neighbour locations do not benefit enough from the spillover effects related to being closer to the administrative power. The former capitals of voivodeships do not receive a higher number of projects per se, showing that these locations may have lost their socioeconomic position (Śleszyński, Citation2018).
Envisage of cooperation
From the policy mix perspective, particularly in terms of supporting networking, technology transfer and university–enterprise cooperation, clusters and the voucher scheme, we identify six categories of intervention by the ESIF to be applicable under Thematic Objective I:
060 Research and innovation activities in public research centres and centres of competence, including networking.
061 Research and innovation activities in private research centres, including networking.
062 Technology transfer and university–enterprise cooperation primarily benefiting SMEs.
063 Cluster support and business networks primarily benefiting SMEs.
064 Research and innovation processes in SMEs (including voucher schemes, process, design, service and social innovation).
065 Research and innovation infrastructure, processes, technology transfer, and cooperation in enterprises focusing on the low carbon economy and resilience to climate change.
The third approach, text mining, allows us to identify the notion of cooperation from the description provided by the projects’ abstracts included in the list of beneficiaries in our data set. Following this approach, we identify 791 (18.50%) projects that mention different forms of external cooperation.
The last approach, based on R&D procurements published in the public database, enabled us to identify 2080 projects (46.64%). In those, we identify 33,137 procurement tenders for delivery goods or services from mid-December 2015 to mid-January 2020. In 4925 tenders (14.86%) we find no information about the outcome of the calls, whereas 5353 tender procedures (16.15%) were declared as not having been successfully concluded. In most tenders, 22,859 (69.98%), we found information about the bidders and the winning bid, as well as reasons why the delivered proposal was not accepted. Necessary information for our analysis should include the name of the bidders, address and proposal cost. The information regarding the conclusions of procurement tenders seems to be inconsistent in this sense. Due to some personal data protection rules, the information is not publicly available. Nevertheless, moving in this direction, we could observe the locations of 28,442 bidders. We identify Polish firms, foreign companies, branches of foreign companies affiliated in Poland and individuals carrying out business-related activities. The main identified bidders come from Poland – Warsaw, Poznan, Gdansk, Cracow, Lodz and Wroclaw – and countries such as Germany, the United States, the UK, South Korea and China.
The procurements were classified according to common procurement vocabulary (CPV) codes; this is a system of classification for public procurement. There were 2416 types of code used and 42,003 individual codes identified in 33,137 procedures, which amounted to 1.26 codes for everyone. The top 20 most frequent are:
The purchase of R&D+I project relevant equipment and machinery such as laboratory, optical and precision equipment (excluding glasses) (2673), laboratory pipettes and accessories (773), Industrial machinery (702), machines and apparatus for testing and measuring (556), checking and testing apparatus (402), electronic, electromechanical and electrotechnical supplies (339), and electrical machinery, apparatus, equipment and consumables, and lighting (321).
Providing R&D services and related consultancy services (2611), research and experimental development services (979), research services (590), and R&D consultancy services (318).
Delivery of laboratory materials such as chemical reagents (2399), laboratory reagents (1418) and chemical products (1077).
ICT solutions such as software packages and information systems (635), computer equipment and supplies (345), and information technology services: consulting, software development, internet and support (335).
Other materials such as steel (476) and plastic products (421).
Construction work (368).
The four approaches we used do not allow us to provide a detailed picture of the cooperation levels in all projects discussed here, given the limitations of each, as previously explained; however, it clearly highlights the policy push and some evidence of such cooperation in the territorial context.
DISCUSSION AND CONCLUSIONS
Our empirical analysis, based on grant-supported R&D+I projects from the ESIF, confirms the concentration tendency of Smart Specialisation projects in urban areas. The main Polish cities seem to build critical mass in terms of population, entrepreneurial potential and size of innovative activities. The concentration of human, financial and organizational resources in cities generates a good environment in which to conduct innovation activities (Weresa & Kowalski, Citation2019). This environment facilitates matching in the labour market between employers and employees, and the generation, diffusion and accumulation of knowledge (Duranton & Puga, Citation2004).
These results are in line with findings of recent studies on the investment attractiveness of Polish territories. This research confirms that urban agglomerations are attracting more R&D+I projects than rural areas. There is a division between prosperous, attractive large cities and rural areas that are less appealing for investors. The increasing urbanization of neighbouring rural areas has led to the enlargement of the suburban zones of large cities that play production and service functions. In the period 2008–15, the most attractive investment municipalities are Warszawa, Katowice, Cracow, Lodz, Poznan, Szczecin and the Tricity – Gdansk, Gdynia, Sopot (Godlewska-Majkowska, Citation2018). With respect to institutional capacities, the big Polish cities are equipped with more universities, R&D institutions and intermediary bodies (Bąkowski & Mażewska, Citation2018), producing a significant national research output, the objective of which is to support innovative and entrepreneurial processes.
The associated factors explaining the number of projects identified in our econometric models contribute to the debate on regional and national innovative capacity determinants (Furman et al., Citation2002). Local characteristics such as population density, industry share, immigration and attraction of foreign capital investment are positively associated with the implementation of Smart Specialisation projects. These results are in line with the literature on agglomeration economies (Crescenzi et al., Citation2007, Citation2014; Duranton & Puga, Citation2004).
In the analyses of cooperation, we limit our study to discuss four possible ways to investigate cooperation at project level. We do not test aspects of the absorptive capacity of beneficiaries to absorb creative, learning and management skills (Cohen & Levinthal, Citation2000). These aspects are left for future work.
On the one hand, the implementation of the competitiveness principle, which forces beneficiaries to adopt a transparent procedure when selecting potential partners to carry out research and innovative activities, may determine (1) the role of local clusters and networks in order to promote competitiveness of firms and regions (Asheim, Citation1996; Morgan, Citation1997), (2) innovation as socially and territorially embedded (Lundvall & Johnson, Citation1994), and (3) that learning regions as a regionally based development coalition may be reduced. But, on the other hand, this competitive approach may help to set up distributed knowledge networks and non-local relations (Asheim, Citation2012).
Smart Specialisation is expected to be a very inclusive process, not only at the level of strategy design but also during its implementation phase. Our findings show that there is still a need to expand this inclusion in the territorial sense, either by the revision of the S3 domains in order to expand their spatial dimension or by the improvement of the implementation mechanisms supporting the development of S3 domains in less attractive and active territories. The key policy question is whether it is worth doing so because the expectation of the total involvement of all regional stakeholders in innovative processes may be perceived as a utopia. Nevertheless, this should be explored within the monitoring and evaluation system.
The observed territorial pattern in the number and capacity to implement Smart Specialisation projects may have important political implications. The sense that there is a lack of opportunities and future prospects generates a feeling of being left behind in some places, and people living in these locations use the ballot box to take revenge against politicians by voting for Eurosceptic political parties (Dijkstra et al., Citation2020; Rodríguez-Pose, Citation2018). This territorial divide generates a geography of discontent against national political leaders and the EU (Dijkstra et al., Citation2020; McCann, Citation2020). In the case of Poland, using data from the 2015 Polish parliamentary election, Marcinkiewicz (Citation2018) finds that the urban–rural divide offers the best explanation of spatial differences in electoral results. As observed in our results, if grant-supported R&D Smart Specialisation projects continue to agglomerate in large urban areas, the urban–rural divide will increase, leading to greater discontent in the areas left behind. This may challenge the effectiveness of the European Cohesion Policy and ESIFs.
The main limitation of our research is the fact that the database of projects is not complete since an important amount of funds have yet to be allocated. However, our research results could be used for policy change in terms of widening the participation of less developed areas. Furthermore, the implementation process of programmes referring to Smart Specialisation is not equal in terms of place. There are regions that implement their programmes slower or some decide to change the allocation of funds dedicated to entrepreneurial beneficiaries towards ideas supporting their need of a more capacity-building nature.
In terms of directions for future research, the update of this exercise at the end of the implementation programme is possible. However, we do not expect the results to change significantly. In addition, the analysis performed in this paper can be replicated in other countries. The analysis of cooperation could be further explored using qualitative methods, especially for more detailed analysis concerning cooperation between companies and the academic sector or partners from different regions. It would also be valuable to identify some networks and their links to other sources of funding, such as Horizon 2020 or national funds.
Supplemental Material
Download PDF (250.5 KB)ACKNOWLEDGEMENT
The authors are grateful to the editors and two anonymous reviewers for useful comments and suggestions. The views expressed are purely those of the authors and may not in any circumstances be regarded as stating an official position of the European Commission.
DISCLOSURE STATEMENT
No potential conflict of interest was reported by the authors.
Notes
1. €355.1 billion has been dedicated to Cohesion Policy for the period 2014–20. It is available from three funds: The European Regional Development Fund (ERDF), the Cohesion Fund (CF) and the European Social Fund (ESF). These funds, together with the European Agricultural Fund for Rural Development (EAFRD) and the European Maritime and Fisheries Fund (EMFF), constitute the ESIFs. For more information, see https://cohesiondata.ec.europa.eu and https://ec.europa.eu/regional_policy/en/funding/available-budget/.
2. Data were gathered on 3 September 2018.
3. Table C1 in Appendix C in the supplemental data online illustrates the distribution of national and regional policy mix instruments.
4. See Table C2 in Appendix C in the supplemental data online.
5. See Appendix A in the supplemental data online for a further explanation.
6. We add 1 to the number of patents before taking the logs to avoid dropping those observations with zero patents.
7. See Table C3 in Appendix C in the supplemental data online for summary statistics of the variables included in the model.
8. The Polish database Baza Konkurencyjności.
9. See Table C4 in Appendix C in the supplemental data online for the list of the top 20 counties.
10. See Appendix B in the supplemental data online for technical details.
Related Research Data
REFERENCES
- Aghion, P., & Howitt, P. (1994). Growth and unemployment. Review of Economic Studies, 61(3), 477–494. https://doi.org/10.2307/2297900
- Anselin, L. (1996). The Moran scatterplot as an ESDA tool to assess local instability in spatial association. In Fischer, M., Scholten, H., & Unwin, D. (Eds.), Spatial analytical perspectives on GIS (pp. 111–125). Taylor & Francis.
- Asheim, B. (1996). Industrial districts as ‘learning regions’: A condition for prosperity. European Planning Studies, 4(4), 379–400. https://doi.org/10.1080/09654319608720354
- Asheim, B. (2012). The changing role of learning regions in the globalizing knowledge economy: A theoretical re-examination. Regional Studies, 46(8), 993–1004. https://doi.org/10.1080/00343404.2011.607805
- Bąkowski, A., & Mażewska, M. (2018). Ośrodki innowacji i przedsiębiorczości w Polsce. SOOIPP.
- Barrell, R., Pain, N., & Notes, A. (1997). Foreign direct investment, technological change, and economic growth within Europe. Economic Journal, 107(445), 1770–1786. https://doi.org/10.1111/j.1468-0297.1997.tb00081.x
- Bettencourt, L. M., Lobo, J., Helbing, D., Kühnert, C., & West, G. B. (2007). Growth, innovation, scaling and the pace of life in cities. Proceedings of the National Academy of Sciences, USA, 104(17), 7301–7306. https://doi.org/10.1073/pnas.0610172104
- Bloch, F., Dutta, B., & Manea, M. (2019). Efficient partnership formation in networks. Theoretical Economics, 14(3), 779–811. https://doi.org/10.3982/TE3453
- Boschma, R. (2005). Proximity and innovation: A critical assessment. Regional Studies, 39(1), 61–74. https://doi.org/10.1080/0034340052000320887
- Broekel, T., & Hartog, M. (2013). Determinants of cross-regional R&D collaboration networks: An application of exponential random graph models. In T. Scherngell (Ed.), The geography of networks and R&D collaborations (pp. 49–70). Springer.
- Capello, R., & Lenzi, C. (2013). Territorial patterns of innovation: A taxonomy of innovative regions in Europe. Annals of Regional Science, 51(1), 119–154. https://doi.org/10.1007/s00168-012-0539-8
- Cliff, A. D., & Ord, J. K. (1973). Spatial autocorrelation. Pion.
- Cohen, W. M., & Levinthal, D. A. (2000). Absorptive capacity: A new perspective on learning and innovation. In Cross, R. L., & Israelit, S. B. (Eds.), Strategic learning in a knowledge economy: Individual, collective and organizational learning process (pp. 39–67). Butterworth-Heinemann.
- Cosh, A., Fu, X., & Hughes, A. (2005). Management characteristics, collaboration and innovation efficiency: Evidence from UK survey data. Centre for Business Research, University of Cambridge.
- Crescenzi, R., Pietrobelli, C., & Rabellotti, R. (2014). Innovation drivers, value chains and the geography of multinational corporations in Europe. Journal of Economic Geography, 14(6), 1053–1086. https://doi.org/10.1093/jeg/lbt018
- Crescenzi, R., Rodríguez-Pose, A., & Storper, M. (2007). The territorial dynamics of innovation: A Europe–United States comparative analysis. Journal of Economic Geography, 7(6), 673–709. https://doi.org/10.1093/jeg/lbm030
- Crescenzi, R., Rodríguez-Pose, A., & Storper, M. (2012). The territorial dynamics of innovation in China and India. Journal of Economic Geography, 12(5), 1055–1085. https://doi.org/10.1093/jeg/lbs020
- Cunningham, P., & Gök, A. (2016). The impact of innovation policy schemes for collaboration. In J. Edler, P. Cunningham, A. Gök, & P. Shapira (Eds.), Handbook of innovation policy impact (pp. 239–278). Edward Elgar.
- Cunningham, P., & Ramlogan, R. (2016). The impact of innovation networks. In J. Edler, P. Cunningham, A. Gök, & P. Shapira (Eds.), Handbook of innovation policy impact (pp. 279–317). Edward Elgar.
- Dijkstra, L., Poelman, H., & Rodríguez-Pose, A. (2020). The geography of EU discontent. Regional Studies, 54(6), 737–753. https://doi.org/10.1080/00343404.2019.1654603
- Driffield, N., & Love, J. H. (2003). Foreign direct investment, technology sourcing and reverse spillovers. Manchester School, 71(6), 659–672. https://doi.org/10.1046/j.1467-9957.2003.00372.x
- Duranton, G., & Puga, D. (2004). Micro-foundations of urban agglomeration economies. In J. V. Henderson & J. F. Thisse (Eds.), Handbook of regional and urban economics (pp. 2063–2117). Elsevier.
- Edquist, C. (1997). Systems of innovation approaches – Their emergence and characteristics. In C. Edquist (Ed.), Systems of innovation: Technologies, institutions and organizations (pp. 1513–1522). Pinter.
- European Commission. (2017). My region, my Europe, our future. Seventh report on economic, social and territorial cohesion. Publications Office of the European Union. https://doi.org/10.2776/5244
- Fagerberg, J., Verspagen, B., & Caniëls, M. (1997). Technology, growth and unemployment across European regions. Regional Studies, 31(5), 457–466. https://doi.org/10.1080/00343409750132252
- Feldmann, H. (2013). Technological unemployment in industrial countries. Journal of Evolutionary Economics, 23(5), 1099–1126. https://doi.org/10.1007/s00191-013-0308-6
- Florida, R. (1995). Towards learning regions. Futures, 27(5), 527–536. https://doi.org/10.1016/0016-3287(95)00021-N
- Foray, D., Goddard, J., Goenaga Beldarrain, X., Landabaso, M., McCann, P., Morgan, K., Nauwelaers, C., & Ortega-Argilés, R. (2012). Guide to research and innovation strategies for Smart Specialisation (RIS3). Publications Office of the European Union. https://doi.org/10.2776/65746
- Fu, X. (2008). Foreign direct investment, absorptive capacity and regional innovation capabilities: Evidence from China. Oxford Development Studies, 36(1), 89–110. https://doi.org/10.1080/13600810701848193
- Furman, J. L., Porter, M., & Stern, S. (2002). The determinants of national innovative capacity. Research Policy, 31, 899–933. https://doi.org/10.1016/S0048-7333(01)00152-4
- Gianelle, C., Guzzo, F., & Mieszkowski, K. (2017). Smart Specialisation at work: Analysis of the calls launched under ERDF operational programmes (JRC Technical Reports No. JRC106974).
- Gianelle, G., Guzzo, F., & Mieszkowski, K. (2019). Smart Specialisation: What gets lost in translation from concept to practice? Regional Studies. https://doi.org/10.1080/00343404.2019.1607970
- Godlewska-Majkowska, H. (2018). Investment attractiveness of Polish municipalities in relation to local entrepreneurship. Olsztyn Economic Journal, 13(2), 103–122. https://doi.org/10.31648/oej.2764
- Holland, D., & Pain, N. (1998). The diffusion of innovations in Central and Eastern Europe: A study of the determinants and impact of foreign direct investment (Discussion Papers No. 137). National Institute of Economic and Social Research (NIESR).
- Hollanders, H., & Es-Sadki, N. (2017). Regional innovation scoreboard 2017. European Union.
- Hollanders, H., & Es-Sadk, N. (2018). European innovation scoreboard 2018. Publications Office of the European Union.
- Isaksen, A., & Onsager, K. (2010). Regions, networks and innovative performance: The case of knowledge-intensive industries in Norway. European Urban and Regional Studies, 17(3), 227–243. https://doi.org/10.1177/0969776409356217
- Klincewicz, K., & Marczewska, M. (2017). Polish systems of innovations – Trends, challenges and policies. WWZ.
- Klincewicz, K., Marczewska, M., & Szkuta, K. (2018). RIO Country Report 2017: Poland. Publications Office of the European Union. https://doi.org/10.2760/1893
- Lundvall, B.-Å. (1992). National systems of innovation: Toward a theory of innovation and interactive learning. Pinter.
- Lundvall, B.-Å., & Johnson, B. (1994). The learning economy. Journal of Industry Studies, 1(2), 23–42. https://doi.org/10.1080/13662719400000002
- Marcinkiewicz, K. (2018). The economy or an urban–rural divide? Explaining spatial patterns of voting behaviour in Poland. East European Politics and Societies: and Cultures, 32(4), 693–719. https://doi.org/10.1177/0888325417739955
- Martin, R., & Sunley, P. (1996). Paul Krugman’s geographical economics and Its implications for regional development theory: A critical reassessment. Economic Geography, 72(3), 259–292. https://doi.org/10.2307/144401
- McCann, P. (2020). Perceptions of regional inequality and the geography of discontent: Insights from the UK. Regional Studies, 54(2): 256–267. https://doi.org/10.1080/00343404.2019.1619928
- McCann, P., & Ortega-Argilés, R. (2014). Smart Specialisation in European regions: Issues of strategy, institutions and implementation. European Journal of Innovation Management, 17(4), 409–427. https://doi.org/10.1108/EJIM-05-2014-0052
- MIiR. (2015). Wytyczne w zakresie kwalifikowalności wydatków w ramach Europejskiego Funduszu Rozwoju Regionalnego, Europejskiego Funduszu Społecznego oraz Funduszu Spójności na lata 2014–2020. Polish Ministry of Investment and Economic Development.
- MIiR. (2016). Wytyczne w zakresie kwalifikowalności wydatków w ramach Europejskiego Funduszu Rozwoju Regionalnego, Europejskiego Funduszu Społecznego oraz Funduszu Spójności na lata 2014–2020. Polish Ministry of Investment and Economic Development.
- MIiR. (2017). Wytyczne w zakresie kwalifikowalności wydatków w ramach Europejskiego Funduszu Rozwoju Regionalnego, Europejskiego Funduszu Społecznego oraz Funduszu Spójności na lata 2014–2020. Polish Ministry of Investment and Economic Development.
- Moran, P. A. P. (1948). The interpretation of statistical maps. Biometrika, 35, 255–260.
- Morgan, K. (1997). The learning region: Institutions, innovation and regional renewal. Regional Studies, 31(5), 491–503. https://doi.org/10.1080/00343409750132289
- PAG. (2018). Ewaluacja wsparcia w ramach POIR w zakresie Krajowych Inteligentnych Specjalizacji, Policy & Action Group Uniconsult Sp. Z o. O.
- Pisano, G. P. (1990). The R&D boundaries of the firm: An empirical analysis. Administrative Science Quarterly, 35(1), 153–176. https://doi.org/10.2307/2393554
- Rodrik, D. (2007). One economics, many recipes: Globalization, institutions, and economic growth. Princeton University Press.
- Rodríguez-Pose, A. (2013). Do institutions matter for regional development? Regional Studies, 47(7), 1034–1047. https://doi.org/10.1080/00343404.2012.748978
- Rodríguez-Pose, A. (2018). The revenge of the places that don’t matter (and what to do about it). Cambridge Journal of Regions. Economy and Society, 11(1), 189–209. https://doi.org/10.1093/cjres/rsx024
- Rodríguez-Pose, A., & Storper, M. (2006). Better rules or stronger communities? On the social foundations of institutional change and Its economic effects. Economic Geography, 82(1), 1–25. https://doi.org/10.1111/j.1944-8287.2006.tb00286.x
- Rodríguez-Pose, A., & Wilkie, C. (2019). Innovating in less developed regions: What drives patenting in the lagging regions of Europe and North America. Growth and Change, 50(1), 4–37. https://doi.org/10.1111/grow.12280
- Ronen Feldman, J. S. (2007). The text mining handbook: Advanced approaches in analyzing unstructured data. Cambridge University Press.
- Scherngell, T. (2013). The networked nature of R&D in a spatial context. In T. Scherngell (Ed.), The geography of networks and R&D collaborations (pp. 3–14). Springer.
- Śleszyński, P. (2018). Polska średnich miast. Założenia i koncepcja deglomeracji w Polsce. Klub Jagielonski.
- Sörvik, J., Teräs, J., Dubois, A., & Pertoldi, M. (2019). Smart Specialisation in sparsely populated areas: Challenges, opportunities and new openings. Regional Studies, 53(7), 1070–1080. https://doi.org/10.1080/00343404.2018.1530752
- Stiglitz, J. E. (2014). Unemployment and innovation. National Bureau of Economic Research (NBER).
- Storper, M. (1993). Regional worlds of production: Learning and innovation in the technology districts of France, Italy and the USA. Regional Studies, 27(5), 433–455. https://doi.org/10.1080/00343409312331347675
- Uyarra, E., & Ramlogan, R. (2016). The impact of cluster policy on innovation. In J. Edler, P. Cunningham, A. Gök, & P. Shapira (Eds.), Handbook of innovation policy impact (pp. 196–237). Edward Elgar.
- Virkkala, S. (2007). Innovation and networking in peripheral areas – A case study of emergence and change in rural Manufacturing. European Planning Studies, 15(4), 511–529. https://doi.org/10.1080/09654310601133948
- Weresa M., & Kowalski A. (2019). Poland. competitiveness report. The role of cities in creating competitive advantage.