
ABSTRACT
Regional science has long been concerned with measuring the spatial distribution of innovation activity. We introduce trademarks as a new indicator for regional innovation and argue that they are particularly useful to measure the ‘soft’ side of innovation that is difficult to capture with conventional indicators. We explore the spatial distribution of trademarks using a detailed and comprehensive dataset of 47 Japanese prefectures from 1999 to 2012. In addition to mapping differences in trademarking across regions, we identify correlates at the regional level that provide insights into determinants of regional innovation measured via trademarks. For example, regional trademark activity positively correlates with population density, income per capita, entrepreneurship rate, the number of universities, and strong private service and finance sectors. Overall, the results reveal associations unique to trademarks that other measures of innovation cannot uncover. Our findings contribute to research in regional science and the evolving literature on trademarks.
INTRODUCTION
Regional innovation performance is an important and widely discussed topic among researchers (e.g., Porter, Citation2003; Segarra-Blasco et al., Citation2018) and policymakers (e.g., European Commission, Citation2019; Organisation for Economic Co-operation and Development (OECD), Citation2020). Traditionally, regional science has focused on ‘hard’ (technological, science-based) types of innovation. Yet, in recent years, the discussion shifted towards a more comprehensive view of innovation (e.g., Gault, Citation2018; Goetz & Han, Citation2020; Mendonça, Citation2014), encompassing concepts such as service innovation, organizational innovation and business model innovation (e.g., Armbruster et al., Citation2008; Castaldi, Citation2020; Mendonça, Citation2014; Schmoch & Gauch, Citation2009). While existing innovation measures, such as patents (e.g., Acs et al., Citation2002; Fritsch & Slavtchev, Citation2011) and research and development (R&D) expenditures (Männasoo et al., Citation2018), capture ‘hard’ innovation, they are not able to capture ‘soft’ innovation. So far, regional science lacks indicators for measuring soft innovation.
The present study addresses this gap and introduces trademarks as an indicator of regional innovation activity. At the firm level, trademarks have been shown to be an indicator for non-technological innovation in specific service sectors such as knowledge-intensive business services (KIBS) (e.g., Filippetti et al., Citation2019; Flikkema et al., Citation2014, Citation2019; Mendonça, Citation2014; Schmoch & Gauch, Citation2009). Hence, exploring the spatial distribution of trademarks in addition to patents should also enable a more comprehensive assessment of regional innovation, which is crucial to both theory and practice.
We use a comprehensive dataset of 47 Japanese prefectures covering the period from 1999 to 2012 to assess the spatial distribution of trademarks in Japan. Intellectual property (IP) rights have historically played and still play a crucial role in the Japanese economy (Reiffenstein, Citation2009). In addition to mapping differences in trademarks across Japanese prefectures, we use regression analysis to identify correlates of trademarks and provide initial insights into the potential determinants of regional trademark activity.
Our results show that regional trademark activity is positively associated with regional population density, income levels, entrepreneurship rate, and the number of universities. In contrast, a negative association exists between trademark activity and the regional number of scientists and a higher export ratio. Moreover, trademark activity is stronger in regions characterized by strong private service and finance sectors while it is lower in regions with a focus on high-tech manufacturing, wholesale, and government services. Our results also suggest that the associations detected are solely based on trademark activity and cannot be identified with patent-based measures of innovation.
With these results, we contribute to research in regional science by introducing trademarks as a measure for assessing the spatial distribution of (soft) innovation activity (e.g., Brenner & Broekel, Citation2011; Fritsch & Slavtchev, Citation2011; Mendonça, Citation2014; Porter, Citation2003). Also, we contribute to the evolving literature on trademarks (e.g., Block et al., Citation2015; Castaldi & Giarratana, Citation2018; Flikkema et al., Citation2014, Citation2019; Mendonça et al., Citation2004), which has primarily focused on trademarks as a firm-level measure of innovation.
THEORETICAL FOUNDATIONS AND PRIOR LITERATURE
Measures of regional innovation
Regional science has a long history of measuring the spatial distribution of innovative activity. The indicators used include various innovation input and output measures such as R&D expenditures (Männasoo et al., Citation2018), high-tech firm density (De Silva & McComb, Citation2012), innovative entrepreneurship (Fritsch & Storey, Citation2014; Huggins et al., Citation2018) and venture capital (VC) activity (e.g., Ferrary & Granovetter, Citation2009; Florida & Kenney, Citation1988). Besides, a significant number of studies use patent-based measures to capture innovative performance (e.g., Acs et al., Citation2002; Fritsch & Slavtchev, Citation2011; Porter, Citation2003). A commonality of these ‘conventional’ measures is that they are based on a technological or science-based understanding of innovation. That is, they assume that innovation is a result of a technological or scientific effort, which leads to new products or processes.
Yet, this technology-based view is too narrow to capture today’s innovation landscape and its economic significance in its entirety. Therefore, recent advances in innovation research call for a broader understanding of innovation, which should encompass all types of innovation and all sectors where innovation occurs (e.g., Gault, Citation2018; Goetz & Han, Citation2020; Mendonça, Citation2014). As a result, recent research has developed a broader understanding of innovation that includes both ‘hard’ (technological, science-based) and ‘soft’ innovations (Mendonça, Citation2014; Stoneman, Citation2010). Soft innovations, for example, encompass service innovations, organizational innovations, business model innovations and other innovation activities that are difficult to measure using conventional innovation indicators (e.g., Mendonça, Citation2014; Schmoch & Gauch, Citation2009). Measuring soft innovation enables a more precise appraisal of innovation performance in sectors such as professional services, cultural and creative industries, as well as the financial sector. However, while the measurement of technological or science-based innovation on the regional level is comparatively straightforward and well developed (e.g., via patents, R&D expenditures), research in regional sciences lacks indicators for the soft side of innovation so far.
Next to survey-based measures of innovation (e.g., Brunow et al., Citation2020) and design rights (e.g., Filippetti et al., Citation2019; Heikkilä & Peltoniemi, Citation2019), trademarks could serve as a proxy for the soft side of innovation at the regional level. Indeed, prior firm-level innovation research suggests that trademarks can serve as an appropriate indicator to capture soft innovation in KIBS and other service sectors (e.g., Flikkema et al., Citation2014, Citation2019; Mamede et al., Citation2011; Mendonça, Citation2014; Mendonça et al., Citation2004; Schmoch & Gauch, Citation2009).
Firm-level studies on trademarks as an indicator of soft innovation
Trademarks are an established measure of firm-level innovation. For example, Jensen and Webster (Citation2009) document significant correlations between trademarks and other established innovation proxies such as survey-based measures of innovation, R&D expenditures and patents. Similarly, Flikkema et al. (Citation2014) establish an empirical relation between trademarks and innovation activities and Greenhalgh and Rogers (Citation2012) argue that trademarks may even be a more ‘comprehensive indicator of innovation than patents’ (p. 52).
Related studies frequently describe trademarks as particularly well suited to grasp particular aspects of innovation that other measures (e.g., patents) fail to capture. While patents protect firms’ technological assets, trademarks relate to marketing assets and convey commercialization and marketing efforts (e.g., Block et al., Citation2014; Flikkema et al., Citation2019; Mendonça et al., Citation2004). Additionally, patents are more suitable for capturing innovation in R&D-intensive and technology-oriented industries. In contrast, trademarks are an indicator of innovation in less technology-oriented industries such as advertising-intensive, creative and service-related industries (e.g., Amara et al., Citation2008; Castaldi, Citation2018; Filippetti et al., Citation2019). The role of trademarks as a measure of innovation in service industries is particularly salient and has been documented in various studies (e.g., Castaldi & Giarratana, Citation2018; Flikkema et al., Citation2014). Trademarks are also used to generate insights on sectoral change over time (e.g., Mendonça et al., Citation2019). Moreover, patents and trademarks refer to different stages of the innovation process. Trademarks are crucial in later phases of the innovation process, which concern market entry and commercialization (e.g., Flikkema et al., Citation2014; Seip et al., Citation2018).Footnote1
So far, the few studies using trademarks as a measure at an aggregate level assess their utilization across different industrial sectors (e.g., Flikkema et al., Citation2014; Mamede et al., Citation2011; Mendonça et al., Citation2004). Other studies use trademark data aggregated at a national level and outline correlations with entrepreneurship rates (Lyalkov et al., Citation2020), income per capita (Fink et al., Citation2005), gross domestic product (GDP) and population size (Mangàni, Citation2007).
We identified four studies that provide more nuanced insights on the benefits of using trademarks at the regional level. Mendonça (Citation2014) uses an aggregated trademark measure to capture soft innovations at the national level. The study empirically links increased trademark activity to increased investments in marketing efforts and concludes that trademarks can capture innovative efforts at a national level that other conventional innovation indicators do not grasp. Similarly, Mamede et al. (Citation2011) highlight trademarks’ potential to illustrate non-technological innovations. Specifically, the authors investigate trademarks across Portuguese regions and show that trademark activity is particularly high in large metropolitan areas. They attribute this finding to imitative trademarking behaviour that is triggered by geographical proximity. Additionally, Drivas (Citation2020) assesses a panel dataset of trademarks filed across Europe and shows that trademarks are associated with innovation activity. The study highlights the importance of trademarks as a protection mechanism for marketing activities in the commercialization of new technologies. Also, Drivas shows that trademarks provide nuanced insights into the industry specialization of a region. Finally, a recent report by the European Commission (Filippetti et al., Citation2019) highlights the role of trademarks for measuring innovation in the service sector (in particular, knowledge-intensive services). Filippetti et al. (Citation2019) document a considerable overlap between the use of patents, trademarks and design rights at the regional level but also identify regions that score high in the number of trademarks, but comparatively low in the number of patents or design rights. The authors interpret this finding as an indicator of a regional innovation specialization in services. In contrast, regions that score high in the number of patents (and comparatively low in the number of trademarks or design rights) are specialized in technological innovations.
CONTEXT: TRADEMARKS IN JAPAN
We assess trademarks as an indicator of regional innovation performance in Japan. Japan consists of 47 prefectures, such as Tokyo and Osaka, which form the first level of jurisdiction and administrative division. Japan’s industrial landscape is characterized by a large number of small and medium-sized enterprises (SMEs) and by several industrial clusters (Yamawaki, Citation2002). For example, automobile and motorcycle clusters have formed in the prefectures Aichi and Shizuoka. Such industrial clusters have made Japanese firms such as Toyota and Honda global market leaders.
Meanwhile, the Japanese government has shifted its innovation policy toward promoting innovation at the regional level since the end of the 1990s. Before, the government placed a great emphasis on national innovation systems (e.g., Goto, Citation2000; Kitagawa, Citation2005, Citation2007; Okamuro et al., Citation2019). This focus shifted with the introduction of the Basic Act on Science and Technology enacted in November 1995, which clarified that local governments also have a responsibility to formulate policies to advance science and technology in their administrative areas. Furthermore, the Ministry of Economy, Trade, and Industry (METI) initiated an Industrial Cluster Policy in 2001 to enhance Japan’s competitiveness through industrial clusters formed by local SMEs and through new ventures commercializing research from universities and other research institutions. Since Japanese firms became less internationally competitive in information technology (IT) industries under their in-house innovation strategies, the Japanese system of innovation has transformed into a dynamic and network-based system characterized by active external collaboration with various parties (Motohashi, Citation2005).
In addition to providing a fruitful setting for studying regional differences, Japan is particularly suited for research on trademarks. First, Japan has adopted a regional collective trademark system in April 2006. The purpose of the collective trademark system is to foster the growth of regional brands and to convey the uniqueness of certain regional products by distinguishing them from products originating from other geographical regions. In practice, various trademarks are derived from the names of geographical regions and products specific to those regions. Therefore, for some Japanese trademarks, regional names are used in combination with specific product names.Footnote2 Second, IP rights have historically played a crucial role in Japan (Reiffenstein, Citation2009). The Japan Patent Office (JPO) received the highest number of patent applications in the world since the 1970s until 2005, while that tends to decrease gradually since the introduction of the multiple claim system in 1988 (e.g., Goto & Motohashi, Citation2007; Nagaoka et al., Citation2010). This partly occurred because the Japanese patent system has emphasized technological diffusion rather than inventor protection under the first-to-file rule of priority (Cohen et al., Citation2002; Goto & Odagiri, Citation1997). The propensity to trademark in Japan is also high. Japan ranked third in terms of the absolute number of trademark applications behind China and the United States in 2017. The number of trademark applications in Japan amounted to 184,483 in 2018 (JPO, Citation2019).
DATA AND VARIABLES
Data
We collect data on trademarks and patents for all 47 Japanese prefectures from 1999 to 2012. Trademark data come from the Trademark Database complied by the National Institute of Science and Technology Policy (NISTEP). The database is the first systematic effort to compile Japanese trademarks and covers all trademarks that were registered by the JPO with application dates between 1999 and 2012.Footnote3 More information on the database is provided by Motohashi et al. (Citation2016).
Data on patent applications come from the IIP Patent Database compiled by the JPO’s Institute of Intellectual Property (IIP). This source covers all JPO patent applications since 1964. We use the period from 1999 to 2012 to establish a comparable time frame between trademarks and patents.
We then merge this dataset with data on various regional economic indicators taken from multiple sources to create a comprehensive, longitudinal data set at the regional level. First, we collected data on population, population density, and the number of scientists within each prefecture from the Ministry of Internal Affairs and Communications’ (MIC) National Census.Footnote4 To obtain data on per capita income, the number of employees and industry compositions, we use the Regional-level Japan Industrial Productivity (R-JIP) Database compiled by the Research Institute of Economy, Trade, and Industry (RIETI). Data on the number of headquarters and establishments were obtained from the MIC’s Establishment and Enterprise Census and the Economic Census (for 2009 onward). Information on the number of universities in each prefecture comes from MEXT’s School Basic Survey. For data on export and import ratios, we use both R-JIP and Japan Industrial Productivity (JIP) databases by the RIETI.
Variables
IP measures: trademarks and patents
To uncover differences in regional trademarking, we measure the number of trademark registrations in each prefecture based on the addresses of applicants. We use the date of the respective trademark application as our date of reference. According to the JPO, trademarks include characters, figures, symbols, three-dimensional shapes and combinations thereof. The Trademark Act has been partially revised in Japan several times. Principal revisions include the introduction of the service mark registration system in 1991. Product names with regional names have been allowed as trademarks under the regional collective trademark system enacted in April 2006.Footnote5
While trademarks are at the core of this study, we are also interested in the additional explanatory power of trademarks over patents (e.g., Drivas, Citation2020). Therefore, we use patents as a control variable and count the number of patent applications submitted by each prefecture based on the addresses of applicants.
Regio-economic characteristics and industry composition
We examine a range of regio-economic characteristics to identify correlates with trademark registrations submitted across regions. Our examined variables include population size, population density (population per square kilometre), per capita income (in thousands of yen), the number of employees, the number of headquarters, entrepreneurship rates, government expenditures, the number of universities, the number of scientists, as well as import and export ratios for each prefecture. These variables capture various aspects of the demand and supply sides of products and services as well as the economic and scientific infrastructures of each prefecture.
We use population size as an indicator for the size of the region (e.g., Fritsch & Slavtchev, Citation2007). Population density is used as a measure of urbanization or agglomeration economies, which can have a positive effect on regional innovation (e.g., Fritsch & Slavtchev, Citation2011). We include per capita income as a measure of regional economic well-being (Goldstein & Renault, Citation2004). Regional innovation performance tends to increase with the number of firms or employees in the region, which is associated with local industrial clusters (Baptista & Swann, Citation1998; Brenner & Greif, Citation2006). Therefore, we include two variables (the number of employees and the number of headquarters) representing industrial clusters in the region. Further, we include a variable for entrepreneurship rates to account for the fact that entrepreneurship is an important factor for promoting regional innovation and development (Fritsch & Mueller, Citation2004). Additionally, we include the region’s number of universities since a higher number of universities is associated with knowledge spillovers and regional innovation (e.g., Cowan & Zinovyeva, Citation2013; Fritsch & Slavtchev, Citation2007; Kato & Odagiri, Citation2012). Previous studies also indicate that regional innovation activity is related to the number of scientists and engineers as an innovation input, which we include as an additional variable (e.g., Berlemann & Jahn, Citation2016; Drivas et al., Citation2018). Finally, we include regional import and export ratios because international sources of knowledge and a strong export orientation are critical factors for innovation activities (Simmie, Citation2003).
In addition to regio-economic characteristics, we examine the effects of regional industry compositions on trademark activity. Hence, we use data on the real value added by different industry sectors in each prefecture to measure industry compositions based on classifications of the R-JIP Database. We distinguish between non-governmental and governmental service sectors. The manufacturing sector is classified into high- and low-tech manufacturing sectors using the OECD’s (Citation2011) classification.
summarizes the definitions and data sources of our variables.
Table 1. Definitions of variables and data sources.
RESULTS: REGIONAL DIFFERENCES IN TRADEMARKING ACROSS JAPANESE PREFECTURES
Descriptive results
Spatial distribution of trademarks across Japan
We first assess the spatial distribution of trademarks across Japan descriptively by ranking all 47 prefectures according to the number of trademark registrations aggregated from 1999 to 2012 (). To provide additional information on each prefecture, also displays each prefecture’s aggregate number of patent applications, population size, and per capita income. Additionally, adjusts the number of trademarks and patents by population size and per capita income to provide more context to the absolute numbers. Finally, includes each prefecture’s rank for the respective indicators.
Table 2. Ranking of Japanese prefectures according to the number of trademark registrations between 1999 and 2012.
Overall, substantial differences emerge across regions with regard to the number of trademarks. Unsurprisingly, the most densely populated metropolitan areas (e.g., Tokyo, Osaka) account for the highest number of trademark registrations. While the share of primary industry in terms of the labour force is quite low in these metropolitan areas, the share of tertiary industry is high. More rural and less populated areas (e.g., Tottori, Akita) show considerably fewer trademarks (fewer than 2000). In such prefectures, the share of tertiary industry is low while the share of the primary industry is high.
The number of trademarks per prefecture is highly skewed. While 525,371 trademarks were registered by applicants from Tokyo between 1999 and 2012, applicants from Tottori registered 1522 trademarks (=0.3% of Tokyo). The variance in trademark registrations is similar to the variance in patent applications: While applicants from Tokyo filed 2,329,846 patent applications, applicants from Aomori only filed 2967 patent applications (= 0.1% of Tokyo) between 1999 and 2012. Overall, the results also show a positive association between trademarks, patents, population size and income. This association is reaffirmed when trademark registrations are adjusted by population size or per capita income. Finally, reports Spearman’s rank correlation coefficients to quantify the respective correlation between the ranking of trademark activity and the ranking of the respective socioeconomic measure All correlations are highly significant, and the correlation is particularly pronounced for trademark registrations and patent applications (Spearman’s rho = 0.894, p < 0.01).
To further illustrate the spatial distribution of trademarks across Japan, presents a map of the 47 Japanese prefectures according to their ranking of trademark activity. Prefectures with a high number of trademark registrations are coloured green while prefectures with fewer trademark registrations are coloured red. Figure B2 in Appendix B in the supplemental data online displays the spatial distribution of patent applications in the same manner.
Figure 1. Japanese prefectures ranked by the total number of trademarks between 1999 and 2012.
Note: Some of the northern and southern islands are not shown due to limited space.
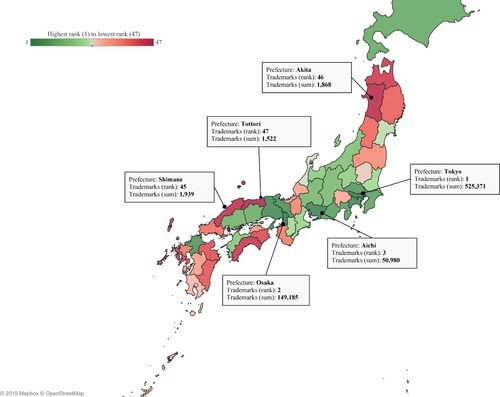
shows that the number of trademark registrations is particularly high in central Japan, while areas of southern and northern Japan show lower amounts of trademark registrations. For example, the number of trademarks is particularly low for Kyushu, Japan’s southernmost island, and the northern region of the main island.
Development over time
Our dataset is longitudinal and includes regional trademark activity from 1999 to 2012. To assess the development of trademarks over time, illustrates the total number of trademark registrations per year. Trademark registrations increased steadily from 78,006 in 1999 to a peak of 93,969 in 2007 and then declined to 66,320 in 2008. This decline was likely caused by the financial crisis. Since 2008, trademark activity gradually increased again to 75,984, which is similar to the initial value recorded in 1999.
Figure 2. Development of trademark registrations and patent applications over time.
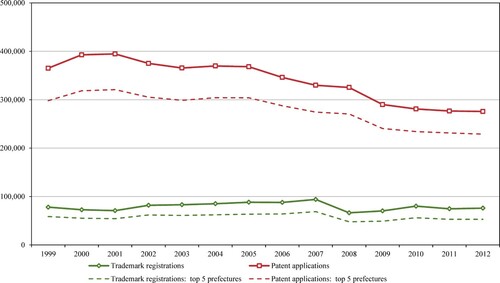
The number of patent applications steadily decreased from a peak of 394,578 in 2001 to 275,665 in 2012. Hence, while in 1999 there were 4.7 times more patent applications than trademark registrations, this ratio decreased to 3.6 in 2012, indicating an increase in the prevalence of trademarks relative to patents over time.
Still, Japan seems to be a special case, where the number of trademark registrations is relatively low as compared with the number of patent applications (e.g., Dinlersoz et al., Citation2018). A potential reason is that in Japan for a long time the scope of individual patent claims was narrower than in other countries, such as the United States (e.g., Saiki et al., Citation2006; Sakakibara & Branstetter, Citation2001). Hence, firms needed to file relatively more patents per invention.Footnote6 This situation changed in 1988 when Japan introduced a patent system reform. Amongst others, the multiple claim system was introduced, which could have led to a significant reduction in the number of patent applications. However, even after the reform, the average number of claims in a Japanese patent continued to be much lower than in other countries. According to Van Pottelsberghe de la Potterie and François (Citation2009), in 2003, the average number of claims in a Japanese patent was seven whereas it was 23 for the US Patent and Trademark Office (USPTO) and 18 for the EPO. Inventors filing patents at the JPO still seem to have a higher tendency to split their inventions into several patents as compared with inventors filing patents at the EPO or USPTO. Another potential reason for the large number of patent applications during the observation period is that there was a quota of patent applications for each researcher in large companies in Japan. Over a long period of time, company managers have urged the R&D department to increase the number of patent filings and even applied a quota to the number of patent applications per researcher (Kishi & Takahashi, Citation2008; Yano, Citation2002). To avoid the delay of the examination period caused by the very large number of patent applications, parallel to the 1988 reforms, the JPO even asked the top 100 patenting companies to reduce their applications (Sakakibara & Branstetter, Citation2001, p. 80).
also contains information on the regional concentration of the number of trademark registrations. It shows the share of trademark registrations and patent applications by the top 5 prefectures. shows a strong regional concentration that is stable over time. For example, Tokyo is the prefecture responsible for the largest share of trademark registrations in every year. The share ranges between a peak of 50.1% in 2001, and slowly declined to 44.6% in 2012. However, Tokyo still is the leading prefecture in trademark registrations by a considerable margin. The top five prefectures in terms of trademark registrations account for approximately 75% of all trademarks every year. Between 90% and 95% of all trademarking activity occurs in the top 25 prefectures; the remaining 22 prefectures only account for a share of 5–10% of all trademark registrations. Across the years, the prefectures with the lowest number of trademark registrations are Tottori, Kochi, Akita (0.1% each).
Finally, indicates that the regional concentration of the number of patent applications is similarly high. As with trademarks, this development is stable over the years under investigation.
Main analysis
Empirical approach
The descriptive analyses show differences in the spatial distribution of trademark activity across Japan. Building on these initial findings, we perform a regression analysis to identify correlates of the regional number of trademark registrations.
The number of trademark registrations (per prefecture and per year) serves as our dependent variable. Since the dependent variable is a count variable with only non-negative integers, we estimate count data models to accommodate the variable’s distribution. A comparison of the variable’s mean and variance suggests the presence of overdispersion. We then perform a regression-based test for overdispersion suggested by Cameron and Trivedi (Citation2009). The results are highly significant (p < 0.01). Thus, our main analysis uses negative binomial regression models, which represent a class of count data models that are more appropriate than Poisson models in the presence of overdispersion (Cameron & Trivedi, Citation2009). The results of our main analysis are displayed in . We separately consider a set of regional economic characteristics (model 1) and industry structures (model 2) that might correlate with trademark activity.
Table 3. Main analysis: negative binomial regression analysis to explore the determinants of the regional number of trademark registrations (dependent variable; per prefecture, per year).
Correlations are displayed in Table B1 in Appendix B in the supplemental data online. To account for the nested data structure of the different yearly observations per prefecture, standard errors are clustered by prefecture. Several variables are included in logged form to account for a strong skewness in the data. We include the number of patent applications (per prefecture and per year) as a control variable in several models, which enables us to isolate correlates of trademark registrations from those of patent applications (e.g., Drivas, Citation2020).
Main results
The results show a strong correlation between regional patent and trademark activity, confirming prior research that shows a strong complementarity between patents and trademarks as IP rights (e.g., Llerena & Millot, Citation2020; Zhou et al., Citation2016). The results regarding the regio-economic determinants of trademarks (, model 1) show that a larger number of registered trademarks positively correlates with a higher population density (p < 0.10), higher per capita income (p < 0.05), a higher entrepreneurship rate (p < 0.05), a higher number of universities (p < 0.10), a lower number of scientists (p < 0.10) and a lower export ratio (p < 0.01).
The results on the influence of regional industry configurations (, model 2) show that a larger number of trademarks negatively correlates with higher value-added in the sectors of wholesale (< 0.10), government services (p < 0.05), and high-tech manufacturing (p < 0.01). In contrast, we find a positive correlation between trademark registrations and value-added in the sectors of finance (p < 0.05) and private services (p < 0.05).
We perform multiple analyses to assess the robustness of our main results that are displayed in Appendix C in the supplemental data online (e.g., using a different counting approach for joint applications, introduction of a time lag). Overall, these analyses underline the robustness of our main results.
Interpretations of the main results
Regio-economic characteristics
We find that a higher number of trademark registrations positively correlates with regional population density and per capita income. This result suggests a higher trademark activity in urban areas since Japan’s largest urban agglomerations (e.g., Tokyo, Kanagawa, Osaka and Aichi) are not only characterized by a high population density and a high per capita income but also represent Japan’s industrial centres. Next to the correlates with urbanity and income, we find that a higher entrepreneurship rate is associated with higher trademark activity. This finding parallels recent research in entrepreneurship, which finds that entrepreneurial ventures filed trademarks as a quality signal to external stakeholders such as customers and investors (e.g., Block et al., Citation2014; Castaldi et al., Citation2020; De Vries et al., Citation2017). In contrast to established firms, start-ups lack a firm and product history and suffer from liabilities of newness. Filing trademarks can help to overcome this liability and shows growth ambitions and marketing professionalism to external stakeholders (e.g., Block et al., Citation2014).
Trademarks are also considered an innovation indicator for firms active in the services sector, especially in the KIBS sector (e.g., Flikkema et al., Citation2014; Mendonça, Citation2014; Schmoch & Gauch, Citation2009). KIBS firms play an increasingly important role in most regional and national innovation systems (e.g., Pinto et al., Citation2015) and a high concentration of KIBS firms is a characteristic of urban areas (e.g., Brunow et al., Citation2020; Johnston & Huggins, Citation2016; Wood, Citation2006). Hence, we argue that a high share of KIBS firms could explain the high number of trademark registrations in more densely populated areas.
The high concentration of KIBS firms in urban areas is generally attributed to the dense networks that comprise KIBS firms, clients and employees. A location close to clients is essential to KIBS firms because their primary function is to transfer knowledge and stimulate innovation at clients (e.g., Brunow et al., Citation2020; Johnston & Huggins, Citation2016; Wiig Aslesen & Isaksen, Citation2007). Such collaboration requires close and often long-term cooperation that is facilitated in dense urban areas, in which many clients are nearby (e.g., Daniels & Bryson, Citation2002; Wiig Aslesen & Isaksen, Citation2007). Additionally, KIBS firms require highly qualified employees because of their knowledge intensiveness and a high degree of specialization. Also, KIBS firms often face high turnover rates, so that access to a steady stream of new employees is essential. Supporting our interpretation, the acquisition of skilled employees is often easier in urban areas (e.g., Simmie & Strambach, Citation2006; Wiig Aslesen & Isaksen, Citation2007). The high per capita income also indicates a higher qualification level of the workforce in sectors with higher trademark activity.
Similar to innovation in the KIBS sector, trademarks can capture innovation in some sectors of the creative and cultural industries (Castaldi, Citation2018). Like KIBS firms, the creative and cultural industries tend to agglomerate in urban areas and large cities (Florida, Citation2005).
Further, our results indicate that trademark activity is associated with the number of universities per prefecture. Universities play a critical role in regional innovation systems because they generate and diffuse knowledge, for example, by performing research, providing specialized education to future employees, engaging in cooperations with firms, and creating knowledge-intensive spin-offs (e.g., Fritsch & Slavtchev, Citation2007; Gonçalves & Almeida, Citation2009). Prior research has mainly associated a higher number of universities with a higher number of patents and focussed on links between universities and R&D intensive sectors (e.g., Acosta et al., Citation2009; Cowan & Zinovyeva, Citation2013; Johnston & Huggins, Citation2016). However, recent studies highlight the importance of universities for the KIBS due to KIBS firms’ reliance on academic knowledge and skilled human capital (e.g., Johnston & Huggins, Citation2016; Wiig Aslesen & Isaksen, Citation2007). Thus, the positive correlation between trademark registrations and the number of universities could partially stem from a larger share of KIBS firms, whose (often soft) innovation activities can be captured via trademarks. Interestingly, we detect a negative correlation between regional trademark activity and the number of scientists. The Japanese National Census shows that the number of scientists is 114,940 in total.Footnote7 Only 12,140 of these scientists belong to the education sector, which includes universities (about 10.6%). This suggests that most scientists in the Census belong to the industrial research centres. Hence, our finding could be explained by the locations of the large industrial research centres, which often produce hard and not soft innovation. This explanation, however, is only a tentative and speculative one. More research is needed to understand the negative correlation between the number of scientists and regional trademark activity.
Finally, our results show a negative correlation between trademark activity and export ratio. While Japan is an export-oriented economy, its export strength lies in sectors such as motor vehicles, electronic equipment, and machine tools.Footnote8 These industries are characterized by hard instead of soft innovation. Compared with the United States, for example, Japan lacks behind in export-oriented digital, financial and professional service firms, where trademarks play an important role as a protection mechanism.
Industry composition
In line with our previous interpretations that suggest a correlation between a high number of trademarks and KIBS, we find that trademark activity is associated with a strong private service sector. This underlines the notion that trademarks can be used to capture service innovation in the private sector, which is in line with recent firm-level trademark research (Castaldi, Citation2018; Castaldi & Giarratana, Citation2018). This is an important finding for the field of regional science, where most studies on service innovation are either conducted at the firm level using questionnaire-based measures (Love et al., Citation2010) or rely on qualitative empirical data (Liu et al., Citation2019). The result opens up the possibility of conducting quantitative research on regional processes of transformation from primarily manufacturing industry-oriented regions to regions characterized by KIBS (e.g., Brunow et al., Citation2020; Liu et al., Citation2019). Overall, our results indicate that trademark-based measures of regional innovation seem to be well-suited to developing a deeper understanding of why and under what conditions KIBS firms have a profound effect on regional development and prosperity.
We also find that trademarks are associated with a strong finance sector. While the finance sector is related to KIBS, innovation research conducted at firm and regional levels has struggled to find quantitative measures of innovation for the financial sector. Our results imply that trademarks can be used as a proxy for measuring innovation in the financial sector. Similar to KIBS, the financial sector is an integral part of a regional and national innovation system (Lai et al., Citation2020). The VC industry, in particular, has been described as a driving force of innovation and innovative entrepreneurship (e.g., Block et al., Citation2017; Kortum & Lerner, Citation2000; Peneder, Citation2010). Another recent development is the advent of FinTech companies, a subset of knowledge-intensive, highly innovative companies that introduce disruptive innovations and lead to significant changes in the financial sector and have the potential to lead to broader economic changes (Lai et al., Citation2020). Trademarks may be able to capture additional information on such sectoral changes that other innovation indicators cannot grasp. Overall, trademark-based measures of innovation could be used to dig deeper into the heterogeneity of the financial sector and to understand how innovative products and services of the financial sector impact regional systems of innovation (Ferrary & Granovetter, Citation2009; Wood, Citation2009).
In contrast, we find a negative correlation between trademark activity and the importance of the government services sector. Prior research at the firm level indicates that trademarks signify market entry and commercialization (e.g., Block et al., Citation2015; Flikkema et al., Citation2014; Seip et al., Citation2018). Hence, our negative findings could be due to the lack of marketing and branding efforts in government services. We also detect a negative correlation between the importance of the wholesale sector and trademark activity. This finding could be explained by the specifics of the wholesale sector where efficiency in operations and logistics matter more than marketing and branding. On a more speculative note, it could also be a sign of the comparatively strong vertical integration of the Japanese economy where intermediary firms and suppliers often belong to large business networks (so-called ‘keiretsu’, McGuire & Dow, Citation2009) and do not operate independently and accordingly do not put a strong emphasis on marketing and brand development.
Finally, we find a negative correlation between trademark activity and firms active in high-tech manufacturing. Patents are the traditional measure of innovation in manufacturing sectors, especially if they are R&D intensive. Since such firms pursue hard innovation, trademarks may play a less pronounced role in their business strategy. This interpretation is also in line with our explanation for the negative correlation between the number of scientists and trademark activity.
ADDITIONAL ANALYSES
Distinguishing product, service and mixed trademarks
In an additional analysis, we distinguish between product and service trademarks. When registering a trademark, the applicant has to indicate the product or service classes (i.e., categories) in which it shall be used. These classes are based on the World Intellectual Property Organization’s (WIPO) international trademark classification system (‘Nice classification’) and distinguishes 34 classes referring to products and 11 classes referring to services (WIPO, Citation2020). Measures based on Nice classes are frequently used as an indicator of diversification in trademark research (e.g., Castaldi & Giarratana, Citation2018; Drivas, Citation2020; Mendonça et al., Citation2004; Sandner & Block, Citation2011).
Following Flikkema et al. (Citation2019), we use the Nice classes to distinguish trademarks that refer to products (i.e., only contain product Nice classes), trademarks that refer to services (i.e., only contain service Nice classes), and mixed trademarks (i.e., contain both product and service Nice classes). The underlying assumption is that trademarks filed in only product or service classes are related to product and service innovations. Applying this approach to the regional level, we aggregate product trademarks, service trademarks, and mixed trademarks for each prefecture in Japan from 1999 until 2012. We then perform regression analyses using the counts of each trademark type as the dependent variable. The results are displayed in .
Table 4. Additional analysis: negative binomial regression analysis to explore the determinants of the regional number of product, service or mixed trademarks (per prefecture, per year).
The results are largely in line with our main analyses, but provide additional, more nuanced insights on trademarks as a measure of product and service innovation. For example, the results show a positive and significant correlation between the number of universities and the number of service trademarks. This result complements the main analysis () and shows that the overall positive effect is mainly due to a positive correlation between the number of universities and service trademarks (as well as mixed trademarks). This supports our main interpretation, in which we argue that the positive correlation could stem from a larger share of KIBS in regions with a higher number of universities. Universities are of particular importance for KIBS because they provide KIBS with the necessary academic knowledge and human capital (e.g., Johnston & Huggins, Citation2016; Wiig Aslesen & Isaksen, Citation2007). This finding has implications for the measurement of innovation in KIBS firms, whose innovation activities are difficult to measure with traditional indicators.
Regarding industry composition, the results reveal a positive and significant relationship between real estate and service trademarks. This result, which underlines the importance of a specific trademark type in the real estate sector, is overlaid in the main model (), since the overall effect is insignificant. Further, reveals that the positive association between trademarks and the private service sector is especially pronounced for service and mixed trademarks, further underlining the role of trademarks in measuring the innovation activities of service firms.
Further analysis of trademarks in the finance sector and in KIBS
Our main analysis identifies a correlation between the value added by the finance sector and a higher number of trademarks. Our interpretation is that trademarks can serve as an indicator to measure innovations by the finance sector. However, this correlation could be spurious and most trademark registrations could refer to innovations outside the finance sector. To further assess the use of trademarks in the finance sector, we perform an additional analysis that only considers trademarks that refer to the domain of finance. To identify these trademarks, we use the Nice classification and only consider trademarks that refer to class 36 as the dependent variable. Class 36 is defined as ‘insurance; financial affairs; monetary affairs; real estate affairs’ (WIPO, Citation2020) and comes closest to innovations in the financial sector. The results are reported in . Model 2a documents a strong correlation between the value added by the finance sector and trademarks that refer to financial services. This finding corroborates our interpretation in the main analysis and suggests that trademarks may indeed serve as an innovation indicator in financial services.
Table 5. Additional analysis: negative binomial regression analysis to explore the determinants of the regional number of trademarks in specific Nice classes.
We also argue that the positive correlation between higher value added by the private service sector and the number of trademarks indicates that trademarks are a suitable measure of innovation by KIBS. Hence, we construct an additional dependent variable that only considers trademarks referring to class 35 (‘advertising; business management; business administration; office functions’) and class 42 (‘scientific and technological services and research and design relating thereto; industrial analysis, industrial research and industrial design services; quality control and authentication services; design and development of computer hardware and software’) (WIPO, Citation2020). Together, both classes serve as our proxy for innovation by KIBS. Again, the results displayed in (model 2b) show a strong association between the value added by private services and the number of trademarks in class 35 and 42.
CONCLUSIONS AND AVENUES FOR FURTHER RESEARCH
We show that regional trademark activity is positively associated with regional population density, income levels, entrepreneurship rate, and a higher number of universities, while it is negatively associated with the regional number of scientists and export ratio. Moreover, regional trademark activity is higher in regions with strong private service and finance sectors, while it is lower in regions with strong sectors in high-tech manufacturing, wholesale, and government services. Our results also reveal that the associations detected are unique to trademarks and, importantly, cannot be found with patent-based measures of innovation.
Our research opens up several avenues for future research. By comparing the trademark activity in Japan to the trademark activity in other countries, one could assess whether Japan is a trademark intensive country with a high degree of soft innovation. The data used in this study, however, seem to point in the opposite direction. Future studies could also build upon and expand on the set of variables we use to gain more nuanced insight into the spatial distribution of trademarks. With regard to regional economic characteristics, for example, future research could consider variables related to entrepreneurial finance or R&D inputs. Prior research suggests that entrepreneurial finance providers such as VCs interpret trademarks as an indication of the marketing capabilities of innovative start-ups (Block et al., Citation2014). Regarding the regional industrial configuration, future research could delve deeper into which aspects of the service sector are responsible for the larger number of trademark registrations observed. The service sector is heterogeneous and includes a wide range of firms differing in degrees of innovation, scalability and knowledge intensity. As an example, there could be significant differences between B2B and B2C service firms. While Japan provides a rich context for studying regional differences, future research might also use trademarks to assess regional differences in other regional settings such as the United States or European Union. Due to its fragmentation into several relatively small countries, the latter would provide for an interesting context in which trademarks may measure not only innovation but also the internationalization ambitions of firms (e.g., Barroso et al., Citation2019). Unfortunately, information on international trademark applications according to the WIPO’s Madrid Agreement for the International Registration of Marks is not included in our trademark dataset and is not available from NISTEP. The database includes information on whether international priority was claimed on a trademark filed at the JPO (i.e., trademarks that were initially filed in foreign countries). However, this only applies to 138 of all trademarks filed by applicants located in Japan between 1999 and 2012 so that a meaningful analysis at the regional level is not possible.
Studying trademarks would also allow for new insights related to impactful innovation and entrepreneurship activity about already well-researched innovation contexts such as the United States. As trademarks also encompass ‘softer’ forms of innovation such as business models and service innovation, they may play an important role in detecting hot spots and clusters of truly impactful entrepreneurship such as the Silicon Valley area (Guzman & Stern, Citation2015; Henrekson & Sanandaji, Citation2020). Finally, future research could investigate the differences between trademarks and patents as an indicator of regional innovation in more detail. A better understanding of the differences and commonalities between both IP-based measures on the regional level would inform theory and practice when to use which indicator to measure regional innovation activity.
Supplemental Material
Download PDF (322.1 KB)ACKNOWLEDGEMENTS
We thank the participants at the 1st BETA (Bureau d’économie théorique et appliquée) workshop in Strasbourg (October 2018), as well as the special issue editors and reviewers for many constructive comments on an earlier version of the manuscript. We also thank Sadao Nagaoka and Toshiko Takenaka for important comments and clarifications on the Japanese IP system.
DISCLOSURE STATEMENT
No potential conflict of interest was reported by the authors.
Additional information
Funding
Notes
1. This argument does not hold for start-up firms, which may already use trademarks in early innovation phases to signal their marketing and commercialization capabilities to external finance providers (Block et al., Citation2014).
2. The Regional Collective Trademark System and the Geographical Indication (GI) Protection System coexist in Japan. The former was enacted to grant trademark protection to products and services that are tied to a region and is administrated by the Japan Patent Office (JPO). The latter primarily protects agricultural products that originate from a particular region and involves a quality control. This system was enacted in June 2015 and is administrated by the Ministry of Agriculture, Forestry and Fisheries (MAFF). As of January 2020, there are 1261 trademark applications using the collective trademark system since its introduction in April 2006. Kyoto has the largest number (152) of trademark applications using this system (JPO, Citation2020).
3. Unfortunately, the trademark database has not been updated since the first edition issued by NISTEP in 2016. Therefore, no data are available on trademark registrations after 2012.
4. The National Census, Establishment and Enterprise Census and the Economic Census are not published every year. For years for which data were not available, we used the values of surveys conducted immediately before those years.
5. In Japan, the trademark system for retail or wholesale services was introduced on 1 April 2007, and a mark used for retail or wholesale services can be registered as a service mark. A unique feature for trademarks in Japan is that of nidan-heiki (double parallel writing in Japanese and Latin), which distinguishes between company and product names using the same characters but different pronunciations.
6. An additional reason might be that, according to a JPO report (see https://www.iip.or.jp/summary/pdf/detail02j/14_05.pdf), the lifetime cost for trademarks (application, registration and renewal fees) is much higher in Japan (more than 200,000 yen per claim) than in the United States (less than 100,000 yen per claim) and Europe (less than or around 100,000 yen per claim). In contrast, the cost for patents in Japan is not much different from the United States and Europe.
7. We obtained these data from the Portal Site of Official Statistics of Japan (https://www.e-stat.go.jp/en) (accessed November 11, 2020).
8. See http://www.worldstopexports.com/japans-top-10-exports (accessed August 8, 2020).
REFERENCES
- Acosta, M., Coronado, D., León, M. D., & Martínez, MÁ. (2009). Production of university technological knowledge in European regions: Evidence from patent data. Regional Studies, 43(9), 1167–1181. https://doi.org/https://doi.org/10.1080/00343400802154573
- Acs, Z. J., Anselin, L., & Varga, A. (2002). Patents and innovation counts as measures of regional production of new knowledge. Research Policy, 31(7), 1069–1085. https://doi.org/https://doi.org/10.1016/S0048-7333(01)00184-6
- Amara, N., Landry, R., & Traoré, N. (2008). Managing the protection of innovations in knowledge-intensive business services. Research Policy, 37(9), 1530–1547. https://doi.org/https://doi.org/10.1016/j.respol.2008.07.001
- Armbruster, H., Bikfalvi, A., Kinkel, S., & Lay, G. (2008). Organizational innovation: The challenge of measuring non-technical innovation in large-scale surveys. Technovation, 28(10), 644–657. https://doi.org/https://doi.org/10.1016/j.technovation.2008.03.003
- Baptista, R., & Swann, P. (1998). Do firms in clusters innovate more? Research Policy, 27(5), 525–540. https://doi.org/https://doi.org/10.1016/S0048-7333(98)00065-1
- Barroso, A., Giarratana, M. S., & Pasquini, M. (2019). Product portfolio performance in new foreign markets: The EU trademark dual system. Research Policy, 48(1), 11–21. https://doi.org/https://doi.org/10.1016/j.respol.2018.07.013
- Berlemann, M., & Jahn, V. (2016). Regional importance of Mittelstand firms and innovation performance. Regional Studies, 50(11), 1819–1833. https://doi.org/https://doi.org/10.1080/00343404.2015.1058923
- Block, J., De Vries, G., Schumann, J. H., & Sandner, P. (2014). Trademarks and venture capital valuation. Journal of Business Venturing, 29(4), 525–542. https://doi.org/https://doi.org/10.1016/j.jbusvent.2013.07.006
- Block, J., Fisch, C., Hahn, A., & Sandner, P. (2015). Why do SMEs file trademarks? Insights from firms in innovative industries. Research Policy, 44(10), 1915–1930. https://doi.org/https://doi.org/10.1016/j.respol.2015.06.007
- Block, J., Fisch, C., & Van Praag, M. (2017). The Schumpeterian entrepreneur: A review of the empirical evidence on the antecedents, behaviour and consequences of innovative entrepreneurship. Industry and Innovation, 24(1), 61–95. https://doi.org/https://doi.org/10.1080/13662716.2016.1216397
- Brenner, T., & Broekel, T. (2011). Methodological issues in measuring innovation performance of spatial units. Industry and Innovation, 18(1), 7–37. https://doi.org/https://doi.org/10.1080/13662716.2010.528927
- Brenner, T., & Greif, S. (2006). The dependence of innovativeness on the local firm population—An empirical study of German patents. Industry and Innovation, 13(1), 21–39. https://doi.org/https://doi.org/10.1080/13662710500513409
- Brunow, S., Hammer, A., & McCann, P. (2020). The impact of KIBS’ location on their innovation behaviour. Regional Studies, 54(9), 1289–1303. https://doi.org/https://doi.org/10.1080/00343404.2019.1684463
- Cameron, A. C., & Trivedi, P. K. (2009). Microeconometrics using Stata. Stata Press.
- Castaldi, C. (2018). To trademark or not to trademark: The case of the creative and cultural industries. Research Policy, 47(3), 606–616. https://doi.org/https://doi.org/10.1016/j.respol.2018.01.006
- Castaldi, C. (2020). All the great things you can do with trademark data: Taking stock and looking ahead. Strategic Organization, 18(3), 472–484. https://doi.org/https://doi.org/10.1177/1476127019847835
- Castaldi, C., Block, J., & Flikkemam, M. J. (2020). Editorial: Why and when do firms trademark? Bridging perspectives from industrial organisation, innovation and entrepreneurship. Industry and Innovation, 27(1–2), 1–10. https://doi.org/https://doi.org/10.1080/13662716.2019.1685376
- Castaldi, C., & Giarratana, M. S. (2018). Diversification, branding, and performance of professional service firms. Journal of Service Research, 21(3), 353–364. https://doi.org/https://doi.org/10.1177/109467051875531530034214
- Cohen, W. M., Goto, A., Nagata, A., Nelson, R. R., & Walsh, J. P. (2002). R&D spillovers, patents and the incentives to innovate in Japan and the United States. Research Policy, 31(8–9), 1349–1367. https://doi.org/https://doi.org/10.1016/S0048-7333(02)00068-9
- Cowan, R., & Zinovyeva, N. (2013). University effects on regional innovation. Research Policy, 42(3), 788–800. https://doi.org/https://doi.org/10.1016/j.respol.2012.10.001
- Daniels, P. W., & Bryson, J. R. (2002). Manufacturing services and servicing manufacturing: Knowledge-based cities and changing forms of production. Urban Studies, 39(5–6), 977–991. https://doi.org/https://doi.org/10.1080/00420980220128408
- De Silva, D. G., & McComb, R. P. (2012). Geographic concentration and high tech firm survival. Regional Science and Urban Economics, 42(4), 691–701. https://doi.org/https://doi.org/10.1016/j.regsciurbeco.2012.03.001
- De Vries, G., Pennings, E., Block, J., & Fisch, C. (2017). Trademark or patent? The effects of market concentration, customer type and venture capital financing on start-ups’ initial IP applications. Industry and Innovation, 24(4), 325–345. https://doi.org/https://doi.org/10.1080/13662716.2016.1231607
- Dinlersoz, E., Goldschlag, N., Myers, A., & Zolas, N. (2018). An anatomy of US firms seeking trademark registration. In C. Corrado, J. Haskel, J. Miranda & D. Sichel (Eds.), Measuring and accounting for innovation in the 21st century. University of Chicago Press.
- Drivas, K. (2020). The role of technology and relatedness in regional trademark activity. Regional Studies. https://doi.org/https://doi.org/10.1080/00343404.2020.1808883
- Drivas, K., Economidou, C., & Tsionas, E. G. (2018). Production of output and ideas: Efficiency and growth patterns in the United States. Regional Studies, 52(1), 105–118. https://doi.org/https://doi.org/10.1080/00343404.2016.1275536
- European Commission. (2019). Regional innovation scoreboard. https://ec.europa.eu/growth/sites/growth/files/ris2019.pdf
- Ferrary, M., & Granovetter, M. (2009). The role of venture capital firms in Silicon Valley’s complex innovation network. Economy and Society, 38(2), 326–359. https://doi.org/https://doi.org/10.1080/03085140902786827
- Filippetti, A., Gkotsis, P., Vezzani, A., & Zinilli, A. (2019). How to survive an economic crisis? Lessons from the innovation profiles of EU regions. https://iri.jrc.ec.europa.eu/sites/default/files/contentype//publication//reports//1568800248//How%20to%20survaive%20an%20economic%20crisis.pdf
- Fink, C., Javorcik, B. S., & Spatareanu, M. (2005). Income-related biases in international trade: What do trademark registration data tell us? Review of World Economics, 141(1), 79–103. https://doi.org/https://doi.org/10.1007/s10290-005-0016-x
- Flikkema, M., Castaldi, C., De Man, A.-P., & Seip, M. (2019). Trademarks’ relatedness to product and service innovation: A branding strategy approach. Research Policy, 48(6), 1340–1353. https://doi.org/https://doi.org/10.1016/j.respol.2019.01.018
- Flikkema, M., De Man, A.-P., & Castaldi, C. (2014). Are trademark counts a valid indicator of innovation? Results of an in-depth study of new BeNeLux trademarks filed by SMEs. Industry and Innovation, 21(4), 310–331. https://doi.org/https://doi.org/10.1080/13662716.2014.934547
- Florida, R. (2005). Cities and the creative class. Routledge.
- Florida, R. L., & Kenney, M. (1988). Venture capital, high technology and regional development. Regional Studies, 22(1), 33–48. https://doi.org/https://doi.org/10.1080/00343408812331344750
- Fritsch, M., & Mueller, P. (2004). Effects of new business formation on regional development over time. Regional Studies, 38(8), 961–975. https://doi.org/https://doi.org/10.1080/0034340042000280965
- Fritsch, M., & Slavtchev, V. (2007). Universities and innovation in space. Industry and Innovation, 14(2), 201–218. https://doi.org/https://doi.org/10.1080/13662710701253466
- Fritsch, M., & Slavtchev, V. (2011). Determinants of the efficiency of regional innovation systems. Regional Studies, 45(7), 905–918. https://doi.org/https://doi.org/10.1080/00343400802251494
- Fritsch, M., & Storey, D. J. (2014). Entrepreneurship in a regional context: Historical roots, recent developments and future challenges. Regional Studies, 48(6), 939–954. https://doi.org/https://doi.org/10.1080/00343404.2014.892574
- Gault, F. (2018). Defining and measuring innovation in all sectors of the economy. Research Policy, 47(3), 617–622. https://doi.org/https://doi.org/10.1016/j.respol.2018.01.007
- Goetz, S. J., & Han, Y. (2020). Latent innovation in local economies. Research Policy, 49(2), 103909. https://doi.org/https://doi.org/10.1016/j.respol.2019.103909
- Goldstein, H., & Renault, C. (2004). Contributions of universities to regional economic development: A quasi-experimental approach. Regional Studies, 38(7), 733–746. https://doi.org/https://doi.org/10.1080/0034340042000265232
- Gonçalves, E., & Almeida, E. (2009). Innovation and spatial knowledge spillovers: Evidence from Brazilian patent data. Regional Studies, 43(4), 513–528. https://doi.org/https://doi.org/10.1080/00343400701874131
- Goto, A. (2000). Japan’s national innovation system: Current status and problems. Oxford Review of Economic Policy, 16(2), 103–113. https://doi.org/https://doi.org/10.1093/oxrep/16.2.103
- Goto, A., & Motohashi, K. (2007). Construction of a Japanese patent database and a first look at Japanese patenting activities. Research Policy, 36(9), 1431–1442. https://doi.org/https://doi.org/10.1016/j.respol.2007.06.005
- Goto, A., & Odagiri, H. (1997). Innovation in Japan. Oxford University Press.
- Greenhalgh, C., & Rogers, M. (2012). Trade Marks and performance in services and manufacturing firms: Evidence of Schumpeterian Competition through innovation. Australian Economic Review, 45(1), 50–76. https://doi.org/https://doi.org/10.1111/j.1467-8462.2011.00665.x
- Guzman, J., & Stern, S. (2015). Where is Silicon Valley? Science, 347(6222), 606–609. https://doi.org/https://doi.org/10.1126/science.aaa020125657229
- Heikkilä, J., & Peltoniemi, M. (2019). Great expectations: Learning the boundaries of design rights. Research Policy, 48(9), 103795. https://doi.org/https://doi.org/10.1016/j.respol.2019.05.004
- Henrekson, M., & Sanandaji, T. (2020). Measuring entrepreneurship: Do established Metrics capture Schumpeterian entrepreneurship? Entrepreneurship Theory and Practice, 44(4), 733–760. https://doi.org/https://doi.org/10.1177/1042258719844500
- Huggins, R., Waite, D., & Munday, M. (2018). New directions in regional innovation policy: A network model for generating entrepreneurship and economic development. Regional Studies, 52(9), 1294–1304. https://doi.org/https://doi.org/10.1080/00343404.2018.1453131
- Jensen, P. H., & Webster, E. (2009). Another look at the relationship between innovation proxies. Australian Economic Papers, 48(3), 252–269. https://doi.org/https://doi.org/10.1111/j.1467-8454.2009.00374.x
- Johnston, A., & Huggins, R. (2016). Drivers of university–industry links: The case of knowledge-intensive business service firms in rural locations. Regional Studies, 50(8), 1330–1345. https://doi.org/https://doi.org/10.1080/00343404.2015.1009028
- Japan Patent Office (JPO). (2019). Facts and figures on trends in intellectual property. https://www.jpo.go.jp/e/resources/report/statusreport/2019/document/index/0100.pdf
- Japan Patent Office (JPO). (2020). The status of trademark applications using the regional collective trademark system. https://www.jpo.go.jp/system/trademark/gaiyo/chidan/shoukai/document/index/jokyo.pdf
- Kato, M., & Odagiri, H. (2012). Development of university life-science programs and university–industry joint research in Japan. Research Policy, 41(5), 939–952. https://doi.org/https://doi.org/10.1016/j.respol.2012.02.011
- Kishi, N., & Takahashi, N. (2008). Licensing and invention for patent strategy (MMRC Discussion Paper Series No. 244). University of Tokyo.
- Kitagawa, F. (2005). Regionalization of innovation policies: The case of Japan. European Planning Studies, 13(4), 601–618. https://doi.org/https://doi.org/10.1080/09654310500107332
- Kitagawa, F. (2007). The regionalization of science and innovation governance in Japan? Regional Studies, 41(8), 1099–1114. https://doi.org/https://doi.org/10.1080/00343400701530873
- Kortum, S., & Lerner, J. (2000). Assessing the contribution of venture capital to innovation. The RAND Journal of Economics, 31(4), 674–692. https://doi.org/https://doi.org/10.2307/2696354
- Lai, K. P., Pan, F., Sokol, M., & Wójcik, D. (2020). New financial geographies of Asia. Regional Studies, 54(2), 143–148. https://doi.org/https://doi.org/10.1080/00343404.2019.1689549
- Liu, Y., Lattemann, C., Xing, Y., & Dorawa, D. (2019). The emergence of collaborative partnerships between knowledge-intensive business service (KIBS) and product companies: The case of Bremen, Germany. Regional Studies, 53(3), 376–387. https://doi.org/https://doi.org/10.1080/00343404.2018.1510178
- Llerena, P., & Millot, V. (2020). Are two better than one? Modelling the complementarity between patents and trademarks across industries. Industry and Innovation, 27(1–2), 52–79. https://doi.org/https://doi.org/10.1080/13662716.2019.1688137
- Love, J. H., Roper, S., & Hewitt-Dundas, N. (2010). Service innovation, embeddedness and business performance: Evidence from northern Ireland. Regional Studies, 44(8), 983–1004. https://doi.org/https://doi.org/10.1080/00343400903401568
- Lyalkov, S., Carmona, M., Congregado, E., Millán, A., & Millán, J. M. (2020). Trademarks and their association with Kirznerian entrepreneurs. Industry and Innovation, 27(1–2), 155–183. https://doi.org/https://doi.org/10.1080/13662716.2019.1586523
- Mamede, R., Fernandes, T., & Godinho, M. M. (2011). Patterns and determinants of trademark use in Portugal. In H. Hirsch-Kreinsen, & I. Schwinge (Eds.), Knowledge-intensive entrepreneurship in low-tech industries (pp. 95–116). Edward Elgar.
- Mangàni, A. (2007). Measuring variety and quality of products with trademarks. International Economic Journal, 21(4), 613–631. https://doi.org/https://doi.org/10.1080/10168730701699109
- Männasoo, K., Hein, H., & Ruubel, R. (2018). The contributions of human capital, R&D spending and convergence to total factor productivity growth. Regional Studies, 52(12), 1598–1611. https://doi.org/https://doi.org/10.1080/00343404.2018.1445848
- McGuire, J., & Dow, S. (2009). Japanese keiretsu: Past, present, future. Asia Pacific Journal of Management, 26(2), 333–351. https://doi.org/https://doi.org/10.1007/s10490-008-9104-5
- Mendonça, S. (2014). National adaptive advantages: Soft innovation and marketing capabilities in periods of crisis and change. In A. Teixeira, E. Silva, & R. Mamede (Eds.), Structural change, competitiveness and industrial policy: Painful lessons from the European periphery (pp. 128–145). Routledge.
- Mendonça, S., Pereira, T. S., & Godinho, M. M. (2004). Trademarks as an indicator of innovation and industrial change. Research Policy, 33(9), 1385–1404. https://doi.org/https://doi.org/10.1016/j.respol.2004.09.005
- Mendonça, S., Schmoch, U., & Neuhäusler, P. (2019). Interplay of patents and trademarks as tools in economic competition. In W. Glänzel, H. F. Moed, U. Schmoch, & M. Thelwall (Eds.), Springer handbook of science and technology indicators (pp. 1023–1035). Springer.
- Motohashi, K. (2005). University–industry collaborations in Japan: The role of new technology-based firms in transforming the national innovation system. Research Policy, 34(5), 583–594. https://doi.org/https://doi.org/10.1016/j.respol.2005.03.001
- Motohashi, K., Ikeuchi, K., & Dang, J. (2016). Constructing a database of design and trademark rights (NISTEP Research Material No. 249). National Institute for Science and Technology Policy, Ministry of Education, Culture, Sports, Science and Technology.
- Nagaoka, S., Motohashi, K., & Goto, A. (2010). Patent statistics as an innovation indicator. In B. H. Hall & N. Rosenberg (Eds.), Handbook of the Economics of innovation, Vol. 2 (pp. 1083–1127). North-Holland.
- Organisation for Economic Co-operation and Development (OECD). (2011). Technology intensity definition: classification of manufacturing industries into categories based on R&D intensities. http://www.oecd.org/sti/ind/48350231.pdf
- Organisation for Economic Co-operation and Development (OECD). (2020). Regional innovation. http://www.oecd.org/governance/regional-policy/regionalinnovation.htm
- Okamuro, H., Nishimura, J., & Kitagawa, F. (2019). Multilevel policy governance and territorial adaptability: Evidence from Japanese SME innovation programmes. Regional Studies, 53(6), 803–814. https://doi.org/https://doi.org/10.1080/00343404.2018.1500687
- Peneder, M. (2010). The impact of venture capital on innovation behaviour and firm growth. Venture Capital, 12(2), 83–107. https://doi.org/https://doi.org/10.1080/13691061003643250
- Pinto, H., Fernandez-Esquinas, M., & Uyarra, E. (2015). Universities and knowledge-intensive business services (KIBS) as sources of knowledge for innovative firms in peripheral regions. Regional Studies, 49(11), 1873–1891. https://doi.org/https://doi.org/10.1080/00343404.2013.857396
- Porter, M. (2003). The economic performance of regions. Regional Studies, 37(6–7), 549–578. https://doi.org/https://doi.org/10.1080/0034340032000108688
- Reiffenstein, T. (2009). Specialization, centralization, and the distribution of patent intermediaries in the USA and Japan. Regional Studies, 43(4), 571–588. https://doi.org/https://doi.org/10.1080/00343400701874255
- Saiki, T., Akano, Y., Watanabe, C., & Tou, Y. (2006). A new dimension of potential resources in innovation: A wider scope of patent claims can lead to new functionality development. Technovation, 26(7), 796–806. https://doi.org/https://doi.org/10.1016/j.technovation.2005.06.002
- Sakakibara, M., & Branstetter, L. (2001). Do stronger patents induce more innovation? Evidence from the 1988 Japanese patent Law reforms. The RAND Journal of Economics, 32(1), 77–100. https://doi.org/https://doi.org/10.2307/2696399
- Sandner, P., & Block, J. (2011). The market value of R&D, patents, and trademarks. Research Policy, 40(7), 969–985. https://doi.org/https://doi.org/10.1016/j.respol.2011.04.004
- Schmoch, U., & Gauch, S. (2009). Service marks as indicators for innovation in knowledge-based services. Research Evaluation, 18(4), 323–335. https://doi.org/https://doi.org/10.3152/095820209X451023
- Segarra-Blasco, A., Arauzo-Carod, J. M., & Teruel, M. (2018). Innovation and geographical spillovers: New approaches and empirical evidence. Regional Studies, 52(5), 603–607. https://doi.org/https://doi.org/10.1080/00343404.2018.1444273
- Seip, M., Castaldi, C., Flikkema, M., & De Man, A.-P. (2018). The timing of trademark application in innovation processes. Technovation, 72–73, 34–45. https://doi.org/https://doi.org/10.1016/j.technovation.2018.02.001
- Simmie, J. (2003). Innovation and urban regions as national and international nodes for the transfer and sharing of knowledge. Regional Studies, 37(6–7), 607–620. https://doi.org/https://doi.org/10.1080/0034340032000108714
- Simmie, J., & Strambach, S. (2006). The contribution of KIBS to innovation in cities: An evolutionary and institutional perspective. Journal of Knowledge Management, 10(5), 26–40. https://doi.org/https://doi.org/10.1108/13673270610691152
- Stoneman, P. (2010). Soft innovation: Economics, product aesthetics, and the creative industries. Oxford University Press.
- Van Pottelsberghe de la Potterie, B., & François, D. (2009). The cost factor in patent systems. Journal of Industry, Competition and Trade, 9(4), 329–355. https://doi.org/https://doi.org/10.1007/s10842-008-0033-2
- Wiig Aslesen, H., & Isaksen, A. (2007). Knowledge intensive business services and urban industrial development. The Service Industries Journal, 27(3), 321–338. https://doi.org/https://doi.org/10.1080/02642060701207239
- World Intellectual Property Organization (WIPO). (2020). Nice classification. https://www.wipo.int/classifications/nice/en
- Wood, P. (2006). Urban development and knowledge-intensive business services: Too many Unanswered Questions?. Growth and Change, 37(3), 335–361. https://doi.org/https://doi.org/10.1111/j.1468-2257.2006.00327.x
- Wood, P. (2009). Service competitiveness and urban innovation policies in the UK: The implications of the ‘London paradox’. Regional Studies, 43(8), 1047–1059. https://doi.org/https://doi.org/10.1080/00343400801968437
- Yamawaki, H. (2002). The evolution and structure of industrial clusters in Japan. Small Business Economics, 18(1–3), 121–140. https://doi.org/https://doi.org/10.1023/A:1015134028335
- Yano, M. (2002). Team diversity and creativity. Innovation: Organization & Management, 4(1–3), 99–112. https://doi.org/https://doi.org/10.5172/impp.2001.4.1-3.99
- Zhou, H., Sandner, P., Martinelli, S. L., & Block, J. (2016). Patents, trademarks, and their complementarity in venture capital funding. Technovation, 47, 14–22. https://doi.org/https://doi.org/10.1016/j.technovation.2015.11.005