
ABSTRACT
Government contracting is crucial for defining the quality of government and public services because it amounts to about 29% of government spending. However, regional quality of government indicators, especially for public spending, are largely missing. We assess the quality of public spending by transparency, competition, efficiency and corruption using a novel database of 4 million contracts from the EU-28 between 2006 and 2015. We find that public spending quality is associated with gross domestic product (GDP)/capita, the European quality of government index (EQI) and public sector meritocracy. We confirm large within-country regional variations, but also find considerable change over time: the steady deterioration of performance in old European Union member states.
INTRODUCTION
While the importance of institutions in economic development is widely accepted (North et al., Citation2009), our limited understanding of, and measures for, the quality of government poses challenges for social sciences and public policy. This challenge is particularly pronounced at the regional level with most measures of government quality looking at the country level (Charron et al., Citation2015).
Our understanding of the quality of public spending, such as public procurement processes and outcomes, is even more limited due to the lack of specific and reliable measures. This is both surprising and problematic as government contracting plays a crucial role in the development and quality of government across the European Union (EU): it amounts to about 13% of gross domestic product (GDP) or 29% of government spending (European Commission, Citation2016; Organisation for Economic Co-operation and Development (OECD), Citation2015, Citation2017) It is a principal means through which governments influence growth rates, the quality of public services and citizens’ well-being. Such lack of measurement limits governments’ capacity to pursue developmental objectives such as territorial cohesion through high-quality transport links. However, with the increased availability of tender and contract-level public procurement datasets, such as those unlocked by the EU-funded DIGIWHIST project,Footnote1 it is finally possible to map and analyse the quality of regional institutions in unprecedented detail.
This article has two main goals. First, it introduces a new dataset and calculates novel indicators characterizing EU regions’ government quality in 2006–15, the public spending quality (PSQ) index. Second, it empirically tests theoretical predictions postulating the positive impact of high government quality on socioeconomic outcomes. The article makes use of a large-scale administrative dataset of over 4 million government contracts which has not been used in the regional context before. The analysis focuses on public procurement (or government contracting in other words), that is, the purchase of goods and services by public entities. It is a genuinely cross-cutting government function concerning virtually every public or semi-public body from federal ministries to local state-owned utilities, making it representative of the quality of government across the whole public sector. Contracts often, albeit my no means always, are of high value in the range of multiple millions of euros spanning over years. Government contracting is also one of the principal means through which governments can influence growth rates and the quality of public services, for example, by investing in highways or government information technology (IT) infrastructure. Hence, indicators based on public procurement data represent a direct measure of transactions key to government quality.
The new measure contributes to the literature, first, by offering indicators of regional quality of government based on objective, administrative data rather than a survey of perceptions of experiences. Second, the availability of millions of contracting records for more than 10 years enables a uniquely detailed assessment on the regional and local levels including NUTS-2 and NUTS-3 levels,Footnote2 but also at the settlement level. Given that the contracts data have precise addresses of buyers, suppliers as well as contract performance, the granularity of regional analysis can be flexibly adjusted to diverse analytical needs.
Third, as the proposed indicators are free of the usual biases and stickiness of governance indicators based on perceptions and self-reported experiences, they are particularly well suited to track changes in regional performance over time. This point is amply demonstrated by the surprisingly steady deterioration of government quality in most EU regions with only a handful of exceptions according to our data. Countries are not only diverse within (Charron et al., Citation2014), but the landscape is shifting on the mid-term, that is, in 10–15 years. Fourth, the proposed indicators allow for consistent comparisons not only within countries, but also across countries or regions belonging to different countries; unlike other indicators using objective data (e.g., Golden & Picci, Citation2005). Fifth, public procurement administrative records are updated on a daily basis by law, so regularly gathering these data and generating PSQ indicators is feasible at a modest cost. Continuous monitoring of government quality based on up-to-date data is of particular value for policymakers wishing to trace the impact of reforms. Sixth, given that public procurement data characterize the spending side of government activities, often large-value purchases, they are complementary to existing measures of quality of government based on citizen and public service user perspectives.
UNDERSTANDING THE REGIONAL QUALITY OF GOVERNMENT AND ITS IMPACTS
In order to enhance prosperity, human well-being and the territorial cohesion of the EU, quality of government more broadly and the quality of public spending more narrowly are fundamental preconditions. There are diverse perspectives on what quality of government means (Agnafors, Citation2013; Fukuyama, Citation2013; Rothstein, Citation2014). Some put forward a very broad definition including the modes of access to power, the exercise of power as well as the content of policies (Kaufmann et al., Citation2009). We side with Keefer (Citation2004) arguing that such a broad definition includes too much limiting of our capacity for analysing crucial governance relationships, such as the link between government processes and outputs. Given our focus on public spending, we are inclined to adopt a definition for the quality of government which clearly delineates the input side of government, that is, the access to public authority such as quality of democracy, from the output side of government, that is, the way in which public authority is exercised. The theory of quality of government as impartiality in the implementation of government laws and policies has gained traction in the social sciences in the last two decades (Rothstein & Teorell, Citation2008). This view about the quality of government emphasizes that high-quality governments are characterized by impartiality in the distribution of public resources and the lack of corruption. Based on this definition, we set out our measurement below around transparency, open and fair competition, and control of corruption as they are closely related dimensions of impartiality. In addition, we also incorporate administrative efficiency in as much as it relates to timely and balanced public decisions underpinning impartiality in public spending (this also allows us to connect more closely with the European regional policy agenda). The quality of government as an impartiality approach puts policy implementation at the heart of the definition rather than the content of policies or the democratic processes through which they are decided. Such a focus enables our indicators to enlighten the relationship between policy content and democratic processes, on the one hand, and the outcomes of public spending, on the other hand.
In addition to rooting our measurement approach in the most relevant academic scholarship, the somewhat broader definition adopted by the European Commission also supports our indicators. The European Commission defines quality of government as: ‘the absence of corruption, a workable approach to competition and procurement policy, an effective legal environment, and an independent and efficient judicial system’, as well as ‘strong institutional and administrative capacity, reducing the administrative burden and improving the quality of legislation’ (European Commission, Citation2014, p. 161). The advantage of developing a measurement framework which also overlaps with the European regional policy agenda is that it can also be used to design and evaluate regional policies and regional development. Our focus on policy implementation by measuring the quality of public spending in public procurement further strengthens the utility for European policymaking because public procurement represents a major way of implementing regional development policies.
In spite of growing conceptual clarity, the measurement of institutional quality suffers from a number of deficiencies. In particular, while there are plenty of indicators at the national level, there is a paucity of regional indicators. Two notable exceptions to this are the European quality of government index (EQI), which was created by the Quality of Government Institute at the University of Gothenburg (Charron et al., Citation2014), and a more recent measure of meritocracy in the public sector derived from the same regional survey underpinning the EQI (Charron et al., Citation2016). Such pioneering work amply demonstrates that within-country variation is very strong; in many cases, it trumps cross-country variation, hence we can also expect that subnational public procurement indicators vary considerably within countries. In order to directly tie our novel indicators to the most relevant and already established scholarship, we will cross-check the proposed PSQ indicator against the EQI.
Dimensions of the regional public spending quality (PSQ) index
We build on the above theory of institutional quality, focusing on policy implementation, and adapt it to the specific context of government contracting. Moreover, a prior systematic review of adequate indicators and dimensions of government quality (Fazekas, Citation2017) also informed our theoretical and empirical set-up. Hence, we propose four main dimensions or pillars for the PSQ index:
Transparency.
Competition.
Administrative efficiency.
Corruption control.
The principle of transparency implies that information about public procurement should be readily available in a precise, reliable and structured form for the public as a whole or its representatives (Kovacic et al., Citation2006; OECD, Citation2007; Soreide, Citation2002). Transparency should concern all the information pertaining to public procurement processes and outcomes such as general laws, regulations, judicial decisions, administrative rulings, procedures and policies on public procurement, statistics on procurement activities, and individual procedures and award decisions. While excess transparency may harm competition in some cases (e.g., disclosure of commercially sensitive information), generally more transparency in European public procurement is deemed desirable (Bauhr et al., Citation2020). While transparency of course has a broader meaning, here it is narrowly defined as compliance with the already extensive information disclosure requirements in EU Public Procurement Directives.
The principle of competition implies that the beneficial effects of multiple bidders competing against each other are harnessed to achieve low prices, high quality and on-time delivery of procured goods, works and services (Cingolani & Fazekas, Citation2017; Lewis-Faupel et al., Citation2016; OECD/Sigma, Citation2014). Such beneficial effects arise when competition is intense, open and fair, such that potential bidders have equal opportunities for participation (Arrowsmith, Citation2009). Fair competition implies a level playing field for every potential and actual competitor. In general, decision-making procedures should be rule-bound whereby every rule is easily accessible to potential and actual bidders. Naturally, bidders may be treated differently if a reasonable justification for such treatment is specified before the procedure.
The principle of administrative efficiency is best understood as minimizing the total cost of achieving the predetermined outcome of public procurement, that is, the successful completion of the contract. This implies that the adequateness of project design and the cost–benefit ratio of alternative designs are not taken into account in this dimension. This vastly simplifies the analysis and allows for comparisons to be made between highly divergent markets and organizations in addition to very much aligning the conceptualization with the academic literature on impartiality in policy implementation rather than decision-making (Rothstein & Teorell, Citation2008).
While defining corruption would merit a long discussion on its own, within the framework we adopted for public procurement it is a more straightforward exercise. This framework allows us to concentrate on high-level corruption typically perpetrated by political and economic elites in order to favour connected companies over others, hence breaking the principles of equal access and ethical universalism (Mungiu-Pippidi, Citation2015; North et al., Citation2009; World Bank, Citation2009). By implication, corruption in public procurement is defined as the allocation and performance of government contracts by bending prior explicit rules and principles of open and fair public procurement in order to benefit a closed network while denying access to all others (Fazekas et al., Citation2016). Corruption control therefore captures the lack of favouring connected bidders. While the above definition of competition partially overlaps with the definition of corruption, the former is decisively broader: corruption is necessarily accompanied by the violation of open and fair competition, but this violation can also take place without corruption, for example, when companies collude or buyers are incompetent.
Validation: correlates and effects of regional public spending quality
Any valid new indicator of regional government quality has to, at least partially, conform to established indicators measuring the same concept, on the one hand, and to already established theories of institutional quality, on the other (Adcock & Collier, Citation2001). In order to test convergent validity, we look at the association between the newly introduced regional PSQ indicator and other measures of regional quality of government. Moreover, to demonstrate the construct validity of our new indicators, we use them to test well-established theories, that is, theories which we can safely expect to be largely true. By implication, we look at three sets of associations and impacts of government quality: (1) the level of economic development, (2) generalized social trust and (3) survey-based measures of regional institutional quality (Charron et al., Citation2014).
First, as extensively noted in prior scholarship, the level of development, in terms of GDP per capita, for example, is expected to strongly correlate with the quality of institutions (North, Citation1990). While the direction of causality is subject to intense scholarly debate which we cannot settle within the limitations of this article, we wish to contribute by confirming the positive relationship and highlighting the potential for using long time series of objective indicators on both the dependent and independent sides of the equation.
Hypothesis 1: Higher regional PSQ is associated with a higher level of development.
Hypothesis 2: Higher regional PSQ is associated with higher generalized social trust.
Hypothesis 3: Higher regional PSQ is associated with higher quality of government more broadly.
DATA
The analysis makes use of administrative data on public procurement tenders of all EU member states. These data are being increasingly used by scholars to investigate a diverse set of themes such as corruption (Fazekas & Kocsis, Citation2020), government efficiency (Cingolani & Fazekas, Citation2020), electoral accountability (Broms et al., Citation2019) or collusion among companies (Decarolis, Citation2014). International organizations such as the OECD or the World Trade Organization (WTO) also use it for monitoring government spending activities (OECD, Citation2011). Our data collection, cleaning and analysis have benefitted from this growing literature.
The database contains information on individual public procurement tenders that are regulated administrative procedures in which public bodies purchase goods, works and services. It derives from the EU’s Tenders Electronic Daily (TED) (http://ted.europa.eu/), which is the mandatory online publication portal for tenders that fall under the remit of the EU Public Procurement Directives. This means that contracts awarded by national and EU bodies are included in the database as well as contracts which are funded by various national and international actors, including EU Structural and Cohesion Funds. A key criterion for publication is contract value: if it exceeds uniformly set publication thresholds (which have changed only marginally over time), the contract has to follow procedural rules set out in the Directives and be published on TED, hence be present in the database. Publication thresholds vary somewhat over time, with the value threshold above which service contracts have to be published being around €130,000 in the last 10 years and about €5 million for public works contracts.Footnote3
For the analysis, we use the TED database for the period 2006–15 in the EU-28. These data represent a complete database of all public procurement procedures conducted under the Directives in the EU-28. As all countries’ public procurement legislation is within the framework of the Directives, national TED datasets are directly comparable with each other. While below-threshold national data are collected by the EU-funded DIGIWHIST project, these datasets are generally not comparable due to varying national publication thresholds, procedural requirements and reporting content (Cingolani et al., Citation2015).
Data in TED are entered into standard reporting forms by procuring bodies, following a common EU reporting guide. The received data are checked by the EU’s Publications Office. In spite of this, there is a non-negligible amount of missing or nonsensical data; our analysis shows that data errors tend to be concentrated in selected countries and procuring bodies (more on data quality and improvements below). The complete contract-level public procurement database used as a basis for this analysis can be downloaded at http://digiwhist.eu/resources/data/. The full regional indicators and composite scores are accessible at http://www.govtransparency.eu/index.php/2021/03/02/regional-public-spending-quality-index-eu. The key regional indicators are also part of the QoG EU Regional Dataset of the University of Gothenburg, accessible at https://www.gu.se/en/quality-government/qog-data/data-downloads/eu-regional-dataset.
TED contains variables appearing in (1) calls for tenders, such as product specification, the deadline for submitting bids, or assessment criteria; and (2) contract award notices, such as name of the winner, awarded contract value or date of contract signature. For every observed tender, the database contains information from the contract award announcement as publication is always mandatory, while information from call for tenders may not be published under specific circumstances. Missing rates also vary greatly by variable, with some variables such as contracting body name not missing at all, while others such as contract value missing extensively.
The TED 2006–15 database contains more than 4.2 million contracts. Of these, 1.2 million are used in the analysis due to the following exclusions: (1) only local/regional contracting authorities’ contracts are analysed, excluding central government authorities, to capture regional rather than national government performance and decisions; (2) contracts below the mandatory reporting thresholds are excluded in order to maximize the comparability of data across regions;Footnote4 and (3) contracts where the NUTS-3 code could not be linked to the buyer were excluded (i.e., we could not reliably assign the observation to any region) in order to remove any potential data error. For the regional analysis, three aggregated databases were created to capture public procurement characteristics in the cross-section of NUTS-2Footnote5 or NUTS-3 regionsFootnote6 as well as annually for NUTS-2 regions using simple aggregation of tender-level variables (averages and sums). For the details of arriving at the final analysis database and a full-data quality assessment, see Appendix A in the supplemental data online.
MEASUREMENT MODEL AND INDICATORS
Measuring the quality of public spending objectively
Before discussing indicators and the corresponding literature in depth, we set out basic standards all the selected indicators have to fulfil so that they can support hypothesis testing and policy assessment:
Objective: they are based on factual data non-mediated by stakeholders’ perceptions, judgements or self-reported experiences.
De facto: indicators describe actual behaviour or events in contrast to legal prescriptions or expectations.
Micro-level: indicators are defined on the level of transactions between buyers and suppliers (i.e., contracts). They can nevertheless be aggregated at higher levels such as regions.
Internationally comparable: while defined on the micro-level, indicators are comparable across countries and regions due the same underlying theoretical concepts and measurement approach.
Comprehensive: indicators adequately capture public procurement performance in a wide set of organizations performing a wide variety of tasks.
Time series: indicators can be measured and compared over time for at least five years.
Public procurement performance indicators satisfying these criteria are expected to comprehensively and reliably characterize quality of government across EU regions following our conceptual framework. Given data availability constraints, the final indicator set consists of two to six individual indicators for each component of the PSQ index. The selection of indicators had to balance diverse expectations: on the one hand, conceptual fit with the definition of government quality was paramount; and, on the other, data availability and quality in TED posed constraints on measurement. We selected a comprehensive set of indicators which captures quality of public spending from multiple angles, providing a robust and rich assessment of government performance. The diversity of indicators brought together also bring the benefit of triangulating results from different angles. Arguably this meant that our indicators capture both those administrative decisions which we know matter for results (inputs), but also those outputs of government activities which are desirable for citizens (outputs).Footnote7
Our measurement capturing public procurement implementation decisions and outcomes rests on a number of assumptions which may not fully hold in all contexts. Crucially, what gets to be procured or outsourced is a policy decision which we can only partially measure as we observe procured products, but not procurable products. However, countries and regions may differ in their propensity to outsource, for example, influenced by public management ideas such as new public management or under budgetary pressures. As we do not standardize the purchasing baskets of regional governments, rather we take all their purchases as a basis for comparisons, such policy choices may weaken the comparability of our indicators as general spending quality indicators. Nevertheless, this assumption of comparable spending structure and policy goals is based on the shared regulatory framework EU Public Procurement Directives which has to be followed by every local government. These Directives stipulate the goals of transparency, competition, efficiency and integrity of our measurement pillars, while they also set a standard scope for publication, hence our dataset. Moreover, the bulk of public procurement spending constitutes purchases which are uniformly treated across Europe irrespective of public sector philosophy. For example, construction works and infrastructure development are barely ever done in-house by governments and they constitute about half of our data.
The indicator selection, definition and grouping were based on a prior comprehensive review of the literature as well as in-depth discussions with expert policymakers and academics potentially using such indicators at the European Commission’s DG REGIO (Fazekas, Citation2017).Footnote8 Given the rich prior literature using data and indicators similar to ours, we could predominantly rely on trusted evidence for placing individual indicators under the different pillars. This carries the benefits of making use of tried measurement concepts as well as interpretation for each indicator, while also contributing to cumulative knowledge generation in the field.
Below, each pillar and the corresponding indicators are discussed in detail. While the discussion takes note of the contract-level definition of each indicator and the conceptual logic behind it, the final indicator list is already expressed in aggregate regional terms (). For descriptive statistics of each indicator, see Table B1 in Appendix B in the supplemental data online.
Table 1. Public spending quality (PSQ) indicators, NUTS regions, Tenders Electronic Daily (TED), 2006–15.
Transparency indicators aim to capture different aspects of public procurement information availability within TED which have been shown to influence bidding outcomes and organizational behaviour (Bauhr et al., Citation2020; Tóth & Fazekas, Citation2017). First, publishing the call for tenders notice on TED assures that a wider pool of bidders can access timely information on a bidding opportunity, as opposed to publishing only via national public procurement portals or newspapers (). Second, open tenders are those which allow for any company to bid, as long as the minimal conditions are fulfilled. Open tenders also require the broadest possible advertisement reach, increasing the scope of transparency. Third, the reporting completeness indicator goes beyond the mere presence of different announcements and their dissemination by looking into the mandatory fields within standard tendering announcements and whether they are actually filled in. In the absence of complete data fields, the actual level of transparency which matters for bidding firms when preparing their bids is low. Fourth, voluntary reporting on TED takes public procurement transparency one step further in as much as even those tenders are placed on the TED portal following its stringent publication standards which are below minimum contract value thresholds. Such publication practice signals additional effort by public buyers to go beyond the legal minimum and encourage open competition.Footnote9
Indicators of competition aim to capture both the intensity of competition and the composition of participating bidders (Tóth & Fazekas, Citation2017). First, intensity of competition measured by the number of bids submitted captures a simple idea that more bidders make for a stronger, healthier competitive environment, with the benefits of each additional bidder diminishing as there are more and more bidders on the market. Second, the share of non-local bidders indicator aims to signal that when at least some bidders come from outside the immediate locality of the buyer, competition is expected to be more intense due to more diverse companies competing (Coviello & Gagliarducci, Citation2017).
Indicators of administrative efficiency aim to capture both the processes and outcomes of how public buyers minimize the total cost of achieving a predetermined outcome of public procurement tenders (Cingolani & Fazekas, Citation2017). First, decision-making speed approximates the cost of evaluating tenders and responding to legal challenges, operating under the assumption that slower decision-making means higher costs for both public and private actors. Second, the use of most economically advantageous tender (MEAT) criteria implies that considerations other than price are taken into account. As quality is often complex to assess while certainly a very important parameter besides price, the use of MEAT criteria carries the potential for better value-for-money outcomes through a more balanced assessment of bids. Third, price savings complements the previous indicator on quality considerations in that it captures the size of discounts companies offer compared with reference prices; that is, the cheaper the winning bid, the better the process.
Indicators of corruption control aim to capture the extent to which a given situation lowers the risk of government contracts being allocated in a way that benefits a closed network while denying access to all others; this scenario occurs through the subversion and violation of established explicit rules and the principles of open and fair public procurement (Fazekas et al., Citation2016). First, the simplest indication that the principles of open and fair competition are being violated is when only one bid is submitted for a tender in a competitive market, meaning there are companies which could have bid, yet only one company did so (Klasnja, Citation2016).Footnote10 In order to construct a more comprehensive indicator of corruption risk, additional risk factors were also considered which pertain to tendering processes hence signal potentially deliberate modifications by public bodies (Fazekas & Kocsis, Citation2020). Second, a simple way to fix tenders is to avoid the publication of the call for tenders in the official public procurement journal as this makes it harder for non-connected competitors to prepare bids.Footnote11 This is only relevant in non-open procedures where publication is voluntary (please note the difference between this indicator which only applies to non-open procedures as defined by the next corruption risk indicator and the contract notice publication indicator in the transparency pilar which is calculated over all tenders). Third, while open competition is relatively hard to avoid in some procedure types such as open tender, others such as negotiated tenders are by default less competitive; hence using less open and transparent procedure types can indicate the deliberate limitation of competition (note that the exact list of risky procedure types depends on their association with single bidding and varies country by country, making it distinct from the open tendering indicator of the transparency pillar; Fazekas & Kocsis, Citation2020). Fourth, a too short advertisement period (number of days between publishing a tender and submission deadline) can inhibit non-connected bidders in preparing adequate bids while the buyer informally informs the favoured bidder about the opportunity ahead of time. Alternatively, the advertisement period becomes lengthy due to legal challenge which may also signal corruption risks. Fifth, subjective, hard-to-quantify evaluation criteria (e.g., quality of company organigram) rather than quantitative or price-related criteria allows rigged assessment procedures as they create room for discretion and limit accountability mechanisms. Alternatively, price-only criteria can also be abused for corrupt ends when the connected firm bids with the lowest price knowing that quality will not be monitored. Sixth, if the time used to decide on the submitted bids is excessively short or lengthy, it can signal corruption risks. Snap decisions may reflect premediated assessment, while a long decision period and the corresponding legal challenge suggests outright violation of laws. For a full description of these corruption red flags, see Fazekas and Kocsis (Citation2020).
Placing individual indicators in the four different pillars was based on prior literature to allow us to contribute to ongoing knowledge accumulation and to rely on the rich evidence-base in this field. Nevertheless, there are some links and partial overlaps between individual indicators which need further clarification to strengthen the analytical value of the composite scores. These overlaps arise in relation to the corruption risk indicators vis-à-vis transparency and competition indicators. This is natural as both transparency and openness of competition are strong predictors of corruption. We measure corruption as a deviation from the open and competitive norm for allocating public contracts which means that some of our indicators capture the extreme ends of the underlying distributions for transparency or competition. For example, single bidding, that is, one bid submitted, is a corruption risk indicator, while the average number of bidders is a competition indicator. Both indicators are widely used in the literature for measuring corruption risks and competition respectively as they capture different features of the underlying bidder number distribution, lower end of the distribution and the average, respectively. Similarly, the non-publication of call for tenders in specific and carefully selected procedure types is interpreted as signalling likely corrupt intent as underpinned by both qualitative and quantitative evidence (Fazekas et al., Citation2016). While the publication of call for tenders across all tenders and procedure types represents a straightforward measure of transparency across the board. Supporting our argument that these indicators measure different concepts, it is shown that the corruption pillar has only weak correlation with the transparency or competition pillars (see Table B2 in Appendix B in the supplemental data online).
Composite PSQ index and its features
We implemented a theory-driven aggregation of the above individual indicators. We construct composite scores for each pillar as well as for the composite PSQ index. After standardizing each indicator, we carried out a simple averaging across indicators first within each pillar then across pillars.Footnote12 In addition to being parsimonious, this method reflects our theoretical expectations closest, that is, it combines indicators as our theory predicts.
We produced regional scores for the cross-section of NUTS-2 and NUTS-3 regions over the whole 2006–15 period as well as for NUTS-2 regions annually following the same procedures described here. First, we assigned contracts to regions based on the buyer’s main address in order to reflect the procurement decisions made by public organizations. Given that we only consider local and regional public buyers such as municipalities, the location of contract performance is also typically the same region as the buyer’s region. We assigned contracts to years based on the contract award year because this is the point in time when most of our indicators are defined and the corresponding government decisions made such as evaluating bidders.Footnote13 Second, we imposed a minimum number of contracts per region or region-year to assure that the underlying contracting data is of sufficient scope for regional scoring (35 for NUTS-3 regions and 100 for NUTS-2 regions). Third, we standardized indicators by transforming them into a 0–100 band, with 100 representing the best observed performance over the whole period and 0 representing the worst (this is essentially a frontier benchmarking approach such as the methodology adopted by the Doing Business scoring; World Bank, Citation2016). Fourth, we calculated the simple arithmetic average of indicators constituting each pillar. In the rare occasions that one of the constitutive variables were missing on the regional level, we averaged only the observed indicators. Fifth, we averaged across the four pillars giving equal weight to each of them producing the composite PSQ index. Averaging across the pillars in a separate step assures that the number of composing indicators within each pillar does not influence the pillar’s importance or weight in the total PSQ index.
The composite regional PSQ index follows a roughly normal distribution, warranting later statistical analysis while the four pillars themselves are roughly normally distributed, too (see Appendix B in the supplemental data online for further descriptive statistics, in particular Figures B1 and B2 for the distributions of the composite score and the four pillars). Each of the four pillars are positively correlated with the total PSQ index with the transparency component displaying the weakest relationship as quite a few well governed regions perform poorly on this dimension as noted by the European Commission a long time agoFootnote14 (for details, see Appendix B online). In addition, the pillars are weakly correlated with each other too (see Table B2 online).
The distributions of the four pillars and the overall composite score show some interesting differences. While the average PSQ index is in the 50–60 range, not all the components reflect this distribution; in particular, the average of the competition score is about 30 points, while the transparency and efficiency score averages are all somewhere around 60. These differences in average scores as well as further differences in the observed minimums and maximums in each score are driven by the dispersion of the underlying indicators among regions. In other words, the average competition score is very low because the average region’s performance is vastly inferior compared with the frontrunner region in terms of bidder number and share of non-local suppliers. Hence, each composite indicator is best used in comparative terms with regards to the top performing European region along each dimension, while the underlying individual indicators can be used to understand absolute differences among regions and also to set performance targets directly amenable to policy interventions.
Following up on previous regional scholarship, we can further confirm that regional quality of government differences matter (Charron et al., Citation2014): the regional PSQ indicator displays a wide within-country variationFootnote15 (see Figure B3 in Appendix B in the supplemental data online), even larger than the variance revealed by the three EQI measurements (2010, 2013 and 2017). Within-country variation is particularly pronounced in large federal countries such as Italy, Germany and Spain, while there is a surprisingly strong variation within smaller countries such as Greece, Bulgaria and Portugal, too. Top-performing countries such as Denmark, Sweden and Finland are much more diverse within their national boundaries than revealed by the EQI. Some countries score markedly differently compared with what other indicators such as EQI reveal. For example, Finland scores close to the EU average rather than the top or Estonia is below EU average. The latter low performance is largely due to a particularly weak competition performance (i.e., low number of bidders) but also below EU average score on efficiency and control of corruption. Given that EQI focuses on low-level bribery while the public spending quality indicators look at high-value contracts and hence high-level policy decisions, the discrepancy is both interesting and plausible.Footnote16 The PSQ indicators derived from administrative data do not suffer from stickiness of perceptions, hence they reveal a larger variation over time than survey-based measures (note that regions remain largely consistent over time, with 69% of total time series variance on the NUTS-2 level explained by regions; for the trajectories of the most and least volatile regions, see Figures B10 and B11 in Appendix B in the supplemental data online, respectively). Worryingly, the PSQ index shows a steady decline across the EU, in particular in old EU member states (see Figure B4 online).
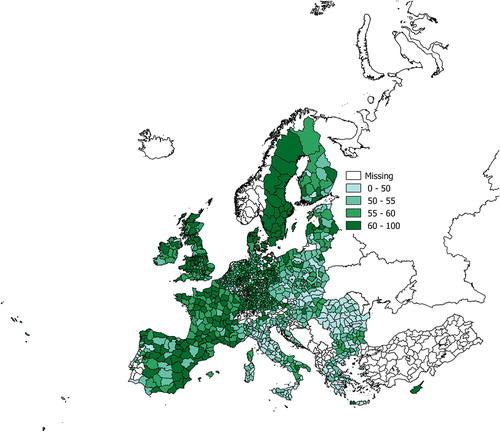
A powerful feature of our large-scale administrative dataset is that the quality of public spending can be analysed at an exceptionally granular level such as NUTS-3 regions () or even at the municipal level (Broms et al., Citation2019). This nuanced disaggregation of the PSQ score yet again reveals considerable within-country variation as well as regional similarities across national borders such as parts of northern Austria, southern Czech Republic and western Slovakia.
Figure 1. Map of the public spending quality (PSQ) index, NUTS-3, Tenders Electronic Daily (TED), 2006–15, regions with at least 35 awarded contracts (Nregions = 1241).
INDICATOR VALIDITY
We test the hypotheses both in a simple bivariate setting and using regression analysis. The tests for Hypotheses 2 and 3 are carried out on a cross-sectional NUTS-2-level sample due to the lack of time-series data as well as more detailed geographical disaggregation on the outcomes. The tests for Hypothesis 1 are carried out both in a cross-sectional NUTS-2 setting to preserve comparability with the other tests and also in an annual time-series NUTS-2 set-up in order to capitalize on the temporal variance of GDP data. Further robustness tests removing regions with few contracts (fewer than 100 and fewer than 500) can be found in Appendix D in the supplemental data online.
Regarding Hypothesis 1, on the association between regional quality of public spending and the level of development, we find supportive evidence both in cross-sectional and time-series set-ups. The PSQ score is moderately correlated with the average log GDP/capita (PPS) at a NUTS-2 level (see Figure B5 and Table B2 in Appendix B in the supplemental data online). However, this simple bivariate relationship is likely to be driven by confounding factors such as country characteristics or temporal shocks (recall the global financial crisis unfolded at the middle of our time series).
In order to address concerns regarding confounding factors, even though a comprehensive causal analysis is beyond the scope of this article, we carry out regression analysis accounting for major confounders (). In a cross-sectional ordinary least squares (OLS) regression set-up, PSQ is associated with a 0.006–0.019 increase in log GDP per capita controlling for country log GDP per capita (PPS), region size, population and whether the region is a capital region. For example, in model 2 in , GDP per capita (PPS) is by about €1000 higher when the PSQ score increases from the EU average (56) by 1 SD (standard deviation) (6.5). The estimated effects remain positive and significant in a country-level fixed effects panel data set-up (Hausman tests suggest that the fixed effects specification is preferable), albeit effect sizes decrease somewhat: 0.001–0.002. In the most complete model, including lagged PSQ score, an increase from the EU average (58) by 1 SD (5.5) increases GDP per capita (PPS) by about €300 or a GDP increase of about 1.2%. The fixed effects panel regression models with lagged PSQ scores (one- and two-year lags) are our preferred specifications because they not only account for country-level time-invariant characteristics, but also for annual economic shocks. In addition, the lagged values of PSQ, while largely insignificant, account for the historical process whereby past government quality contributes to the more recent values of economic development.
Table 2. Regression results on the public spending quality (PSQ) index and log gross domestic product (GDP) per capita relationship (Hypothesis 1), NUTS-2, Tenders Electronic Daily (TED), 2006–15, regions with at least 100 awarded contracts.
Regarding Hypothesis 2, linking regional quality of public spending to generalized social trust, we carry out cross-sectional analysis and find moderately strong supportive evidence. In a simple, bivariate set-up, PSQ and trust are significantly and moderately strongly positively correlated (see Table B2 in Appendix B in the supplemental data online). In regressions with country clustered standard errors, controlling for the country’s level of development, the regions’ size and population, and whether it is a capital region, trust increases by about 0.01 points for each point increase in PSQ (). A 1 SD increase in PSQ (6.5) is associated with a change in trust by 0.043, which is about the difference in trust levels between Italy and Germany. However, the effect becomes insignificant with the inclusion of country development which may signal that the broader country-level context may mediate the quality of government-trust relationship.
Table 3. Regression results on the association between public spending quality (PSQ) and social trust (Hypothesis 2) as well as broader quality of government (Hypothesis 3), NUTS-2, TED, 2006–2015, regions with at least 100 awarded contracts.
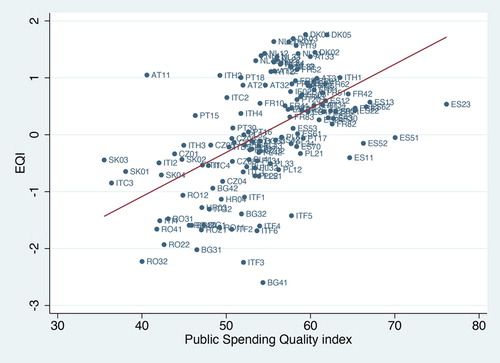
Regarding Hypothesis 3, on the relationship between regional quality of public spending and broader government quality, the cross-sectional analyses are strongly supportive. Given the paucity of reliable regional quality of government indicators, we use two measures coming from the same survey: the European EQI (Charron et al., Citation2014) and the regional public sector meritocracy indicator, that is, the hiring and promotion of public sector employees based on merit or performance rather than connections (Charron et al., Citation2016). Both measure the quality of government along a somewhat different dimension than public procurement.Footnote17 In addition, they gather the views of ordinary citizens (e.g., experiences with bribery in interacting with police) rather than high-value spending decisions captured by public procurement data. While these differences warrant some discrepancies between the EQI and public service meritocracy vis-à-vis our PSQ index, correlating them is suitable for testing convergent validity.
In a simple bivariate set-up, both EQI and meritocracy are positively and significantly correlated with the PSQ score () (and see Table B2 in Appendix B in the supplemental data online). The linear correlation coefficients are nearly twice as large as for the two other hypotheses. In regression analyses, the same strong, significant and positive relationship holds (). A one point increase in the PSQ score is associated with increased EQI by 0.06–0.08 points and meritocracy by 0.05–0.06 in our regression models. The estimated impacts are substantial; for example, a 1 SD increase in PSQ (6.5) is associated with an 0.37 increase in EQI, which corresponds to the average difference between French and Portuguese regions. Nevertheless, some interesting discrepancies arise between EQI and the PSQ score warranting further investigation; for example, some Spanish regions perform markedly better using public procurement data compared with the survey-based scores. Most notably, Catalonia performs outstandingly in its public procurement while scoring below the EU average based on the EQI. Its strong PSQ performance is due to high scores across all four pillars, but in particular in administrative efficiency (e.g., savings achieved and the use of MEAT assessment criteria). This is not surprising given Catalonia is one of the economic powerhouses of Spain and the PSQ score is strongly correlated with economic performance.
Figure 2. Scatterplot of public spending quality (PSQ) index and European quality of government index (EQI), NUTS-2, Tenders Electronic Daily (TED), 2006–15, regions with at least 100 awarded contracts, Nregions = 274.
CONCLUSIONS
Reliably and precisely measuring the quality of government has been a challenge for decades on the country level, but even more at the regional level, despite the growing evidence of its importance for growth, regional convergence and human well-being. The article addresses this gap by developing the PSQ index which offers novel, regional measures of government quality using administrative data on over 4 million contracts across the EU. The indicators capture four fundamental dimensions of good government in public spending: transparency, competition, administrative efficiency and corruption control. While it is designed to proxy good government more broadly, it is most closely associated with the quality of public spending and public investment. The authors have made the data available on online dashboards as well as freely downloadable at http://www.govtransparency.eu/index.php/2021/03/02/regional-public-spending-quality-index-eu.
The new PSQ indicators not only follow the theoretical definition and dimensions of good government, but they also turn out to be of particular value in understanding GDP/capita, social trust and survey-based measures of good government on the regional level such as the EQI. Our analysis reveals that regions with higher PSQ index have higher GDP/capita: a 1 SD increase in PSQ leads to a €300 (PPS) per capita increase in GDP, or 1.2% GDP growth, in a comprehensive fixed effects panel regression model. Increases in trust and EQI associated with PSQ are similarly substantial and statistically significant.
Nevertheless, these novel indicators are not without their limitations which further research should take into account and, if possible, improve on. First, we incorporate corruption risks as one pillar; our indicators only indirectly proxy corruption rather than directly measuring it. This is a standard approach in the literature given the clandestine nature of corruption; nevertheless, it brings it potential biases. Second, as some of the indicators are co-determined by the private sector together with government such as number of bidders, the PSQ index to some degree reflects the strength of the private sector, not only government quality. Hence, in times of severe economic contraction when many private sector companies go bankrupt, the index may partially decline irrespective of government performance. Third, some of the underlying concepts of the four pillars are closely linked to each other, such as transparency and corruption control, and overall they cover a wide conceptual and empirical terrain. Hence, users of the PSQ index should be careful to avoid endogeneity and whenever it fits their research objectives better they should use the individual pillars. Fourth, while NUTS-2 and NUTS-3 regions are politically meaningful in many countries, this is not the case for all, introducing a gap between government action and measurement scope. Fifth, we could only empirically measure some aspects of PSQ with data on project implementation largely missing. As more and better-quality data get published by governments, this limitation could be alleviated.
While this article only took the first steps to develop and demonstrate the usefulness of such novel indicators based on administrative data, we hope to open up new avenues for future research. With more specific and objective indicators of regional government quality which substantially vary over time, it is possible to get a better grasp of regional convergence, and the impact of EU funds and investment on growth across Europe. Given the increased availability of electronic public procurement records, our approach can also be replicated beyond Europe.
Supplemental Material
Download PDF (1.5 MB)ACKNOWLEDGEMENTS
The authors thank the numerous reviewers at the European Commission – DG REGIO and DG GROW, who provided invaluable comments to an earlier version of this article, in particular Lewis Dijkstra, Jachym Hercher and Inguna Kramina. In addition, colleagues at the Government Transparency Institute also provided crucial comments and support, in particular Bence Tóth and Yuliia Kazmina. Finally, we are greatly indebted to Nicholas Charron who provided guidance and support throughout the process of developing this article.
DISCLOSURE STATEMENT
No potential conflict of interest was reported by the authors.
Additional information
Funding
Notes
1. Digiwhist.eu.
2. NUTS = Nomenclature of Territorial Units for Statistics. For more information, see http://epp.eurostat.ec.europa.eu/portal/page/portal/nuts_nomenclature/introduction.
4. There is one exception to this condition: below-threshold contracts are used to calculate one transparency indicator: voluntary publishing, which compares the number of above- and below-threshold contracts on the TED ().
5. This sample is only used when external indicators measured on the NUTS-2 level, such as EQI, need to be linked to our dataset.
6. Many NUTS-3 regions are rather small having only a few contracts awarded per year, so the annual time-series aggregation at the NUTS-3 level would have produced a less reliable sample.
7. Data users who wish to explore the relationships between our input and output indicators such as transparency and corruption are recommended to take the individual indicators rather than the composite scores.
8. A broader set of theoretically relevant and empirically feasible indicators was tested than what is reported here. Those indicators that did not pass basic statistical tests, indicating whether there is sufficient variance for discriminating European regions, were excluded from the present discussion. For full details, see Fazekas (Citation2017).
9. This interpretation rests on the assumption that there is a large number of contracts below the EU reporting thresholds for which there is a choice of voluntarily publishing them, or not. Given the observed contract distributions on TED as well as national datasets collected by DIGIWHIST, this assumption appears to be fulfilled.
10. While single bidding is also related to competition, the complete lack of competitors is better characterized as a corruption risk due to the likely involvement of deliberate restriction of the bidder pool.
11. While not publishing relates to transparency too, our preferred interpretation as a corruption risk indicator is due because it is typically used as a tool to avoid non-connected companies bidding.
12. In addition, we also carried out a principal component analysis (PCA), which leads to similar results in as much as individual indicators are positively associated with the main components. Nevertheless, PCA delivers a somewhat different split of the four main pillars by combining corruption risks with some competition indices and keep others separate (for the full results, see Appendix C in the supplemental data online). Our preference for the simpler, theory-driven aggregation method is further underpinned by its superior performance on validity tests, as shown below.
13. In a small fraction of observations, we have the call for tenders published at the end of the year and contract award taking place at the beginning of the year, which could bias year-to-year comparisons. We consider this as a small problem because there are only a few new call for tenders announced in mid/end of December.
15. Interestingly, there is no statistically significant difference between capital and non-capital regions on the NUTS-2 level PSQ index, suggesting that there is no inherent bias against rural regions in the index.
16. Some accounts of political or high-level corruption in Estonia report persistent problems in spite of successful reforms in eliminating low-level or ordinary corruption. For example, see https://www.baltictimes.com/report__political_corruption_exists_in_estonia/.
17. Regarding EQI as a broader measure of regional quality of institutions, it is an important caveat that the main focus of the EQI is local public services in education, healthcare and police; hence, in a sense, it is narrower.
REFERENCES
- Adcock, R., & Collier, D. (2001). Measurement validity: A shared standard for qualitative and quantitative research. American Political Science Review, 95(3), 529–546. https://doi.org/10.1017/S0003055401003100
- Agnafors, M. (2013). Quality of government: Toward a more complex definition. American Political Science Review, 107(3), 433–445. https://doi.org/10.1017/S0003055413000191
- Arrowsmith, S. (2009). EC regime on public procurement. In K. V. Thai (Ed.), International handbook of public procurement (pp. 254–290). CRC Press.
- Bauhr, M., Czibik, Á, Fazekas, M., & de Licht, J. F. (2020). Lights on the shadows of public procurement. Transparency as an antidote to corruption. Governance: An International Journal of Policy, Administration and Institutions, 33(3), 495–523. https://onlinelibrary.wiley.com/doi/full/10.1111/gove.12432
- Broms, R., Dahlström, C., & Fazekas, M. (2019). Political competition and public procurement outcomes. Comparative Political Studies, 52(9), 1259–1292. https://doi.org/10.1177/0010414019830723
- Charron, N., Dahlström, C., Fazekas, M., & Lapuente, V. (2017). Careers, connections, and corruption risks: Investigating the impact of bureaucratic meritocracy on public procurement processes. The Journal of Politics, 79(1), 89–104. https://doi.org/10.1086/687209
- Charron, N., Dahlström, C., & Lapuente, V. (2016). Measuring meritocracy in the public sector in Europe: A new national and sub-national indicator. European Journal on Criminal Policy and Research, 22(3), 499–523. https://doi.org/10.1007/s10610-016-9307-0
- Charron, N., Dijkstra, L., & Lapuente, V. (2014). Regional governance matters: Quality of government within European Union member states. Regional Studies, 48(1), 68–90. https://doi.org/10.1080/00343404.2013.770141
- Charron, N., Dijkstra, L., & Lapuente, V. (2015). Mapping the regional divide in Europe: A measure for assessing quality of government in 206 European regions. Social Indicators Research, 122(2), 315–346. https://doi.org/10.1007/s11205-014-0702-y
- Cingolani, L., & Fazekas, M. (2017). The administrative capacities behind competitive public procurement processes: A comparative assessment of 32 European countries.
- Cingolani, L., & Fazekas, M. (2020). The role of agencification in achieving value-for-money in public spending. Governance, 33(3), 545–563. https://doi.org/10.1111/gove.12452
- Cingolani, L., Fazekas, M., Kukutschka, R. M. B., & Tóth, B. (2015). Towards a comprehensive mapping of information on public procurement tendering and its actors across Europe. http://digiwhist.eu/publications/towards-a-comprehensive-mapping-of-information-on-public-procurement-tendering-and-its-actors-across-europe/
- Coviello, D., & Gagliarducci, S. (2017). Tenure in office and public procurement. American Economic Journal: Economic Policy, 9(3), 59–105. https://doi.org/10.1257/pol.20150426
- Decarolis, F. (2014). Awarding price, contract performance, and bids screening: Evidence from procurement auctions. American Economic Journal: Applied Economics, 6(1), 108–132. https://doi.org/10.1257/app.6.1.108
- European Commission. (2014). Investment for jobs and growth. Promoting development and good governance in EU regions and cities. Sixth report on economic, social and territorial cohesion (L. Dijkstra (ed.)). Publications Office of the European Union.
- European Commission. (2016). Public procurement indicators 2014.
- Fazekas, M. (2017). Assessing the quality of government at the regional level using public procurement data (WP 12/2017). European Commission, Directorate-General for Regional Policy.
- Fazekas, M., & Kocsis, G. (2020). Uncovering high-level corruption: Cross-national corruption proxies using government contracting data. British Journal of Political Science, 50(1), 155–164. https://doi.org/10.1017/S0007123417000461
- Fazekas, M., Tóth, I. J., & King, L. P. (2016). An objective corruption risk index using public procurement data. European Journal on Criminal Policy and Research, 22(3), 369–397. https://doi.org/10.1007/s10610-016-9308-z
- Fukuyama, F. (2013). What is governance? Governance, 26(3), 347–368. https://doi.org/10.1111/gove.12035
- Golden, M. A., & Picci, L. (2005). Proposal for a new measure of corruption, illustrated with Italian data. Economics & Politics, 17(1), 37–75. https://doi.org/10.1111/j.1468-0343.2005.00146.x
- Kaufmann, D., Kraay, A., & Mastruzzi, M. (2009). Governance matters VIII (issue 4978). World Bank.
- Keefer, P. (2004). A review of the political economy of governance: From property rights to voice (No. 3315; World Bank Policy Research Working Paper).
- Klasnja, M. (2016). Corruption and the incumbency disadvantage: Theory and evidence. The Journal of Politics, 77(4), 928–942. https://doi.org/10.1086/682913
- Kovacic, W. E., Marshall, R. C., Marx, L. M., & Raiff, M. E. (2006). Bidding rings and the design of anti-collusive measures for auctions and procurements. In N. Dimitri, G. Piga, & G. Spagnolo (Eds.), Handbook of procurement (pp. 381–411). Cambridge University Press.
- Lewis-Faupel, S., Neggers, Y., Olken, B. A., & Pande, R. (2016). Can electronic procurement improve infrastructure provision? Evidence from public works in India and Indonesia. American Economic Journal: Economic Policy, 8(3), 258–283. https://doi.org/10.1257/pol.20140258
- Mungiu-Pippidi, A. (2015). The quest for good governance. How societies develop control of corruption. Cambridge University Press. http://www.cambridge.org/us/academic/subjects/politics-international-relations/comparative-politics/quest-good-governance-how-societies-develop-control-corruption
- North, D. C. (1990). Institutions, institutional change and economic performance. Cambridge University Press.
- North, D. C., Wallis, J. J., & Weingast, B. R. (2009). Violence and social orders. A conceptual framework for interpreting recorded human history. Cambridge University Press.
- Organisation for Economic Co-operation and Development (OECD). (2007). Integrity in public procurement. Good practice from A to Z.
- Organisation for Economic Co-operation and Development (OECD). (2011). Government at a glance 2011.
- Organisation for Economic Co-operation and Development (OECD). (2015). Government at a glance. 2015.
- Organisation for Economic Co-operation and Development (OECD). (2017). Government at a glance. 2017.
- Organisation for Economic Co-operation and Development (OECD)/Sigma. (2014). The principles of public administration.
- Rothstein, B. (2003). Social capital, economic growth and quality of government: The causal mechanism. New Political Economy, 8(1), 49–71. https://doi.org/10.1080/1356346032000078723
- Rothstein, B. (2014). What is the opposite of corruption? Third World Quarterly, 35(5), 737–752. https://doi.org/10.1080/01436597.2014.921424
- Rothstein, B., & Teorell, J. (2008). What is quality of government? A theory of impartial government institutions. Governance, 21(2), 165–190. https://doi.org/10.1111/j.1468-0491.2008.00391.x
- Soreide, T. (2002). Corruption in public procurement. Causes, consequences and cures.
- Tóth, B., & Fazekas, M. (2017). Compliance and strategic contract manipulation around single market regulatory thresholds – the case of Poland (GTI-WP/2017:01; Working Paper Series). http://www.govtransparency.eu/index.php/2017/08/28/compliance-and-strategic-contract-manipulation-around-single-market-regulatory-thresholds-the-case-of-poland/
- Uslaner, E. M. (2005). Trust and corruption. In J. G. Lambsdorff, M. Taube, & M. Schramm (Eds.), The new institutional economics of corruption (pp. 76–92). Routledge.
- World Bank. (2009). Fraud and corruption. Awareness handbook.
- World Bank. (2016). Distance to frontier and ease of doing business ranking. http://www.doingbusiness.org/data/distance-to-frontier