
 ?Mathematical formulae have been encoded as MathML and are displayed in this HTML version using MathJax in order to improve their display. Uncheck the box to turn MathJax off. This feature requires Javascript. Click on a formula to zoom.
ABSTRACT
This paper employs goods and services descriptions from US trademarks to study spatial diffusion of innovations. Identifying novel, fast-spreading tokens (words) in trademark descriptions, we outline patterns of regional innovation and estimate how distance affects diffusion. Novel trademark tokens are frequently new to English, they capture many unpatented innovations, and their appearance in language co-evolves with their use in intellectual property filings. We analyse the introduction of novel tokens to capture the emergence of innovations and show that spatial distance affects their diffusion. Estimating the intensity of diffusion between locations in the United States, we confirm strong, negative effects of distance.
INTRODUCTION
The scholarly consensus holds that geographical distance affects not only the intensity of trade and migration patterns, but also the diffusion of ideas, knowledge and innovations (Clark et al., Citation2018; Feldman & Kogler, Citation2010; Hall, Citation2006). Following the early recognition that distance impedes knowledge transfer among people and firms (Marshall, Citation1920), researchers employed patent data to show that the diffusion of codified knowledge lessens with geographical distance (Henderson et al., Citation1993). Others have produced similar findings by exploring the transfer of ideas codified in both patents and scientific publications (Belenzon & Schankerman, Citation2013; Li, Citation2014; Peri, Citation2005; Singh & Marx, Citation2013).
This scholarly consensus has not, however, gone unchallenged. Kolko (Citation2000) notes that the reduction in communication costs and improvements in the speed and quality of interactions might lead to the ‘death of distance’, and possibly an end to agglomeration effects, and finds evidence to support the former. Keller and Yeaple (Citation2013) suggest that, given the intangible nature of ideas, distance may have become less of a barrier for knowledge diffusion after the Internet dramatically lowered communication and interaction costs. Recently, Head et al. (Citation2018) provided empirical support using data on interpersonal networks among mathematicians, finding that over time distance has ceased to create friction, limiting idea diffusion in that field.
Does a ‘death of distance’ in mathematics reflect a more systematic phenomenon across other disciplines and technologies? We add to the array of data sources used to investigate the spatial diffusion of innovation by exploiting information from the US Patent and Trademark Office’s (USPTO) trademark register, exploring this question across a broad range of innovation domains. Trademark data contain information on the diffusion of information about innovations through the lens of words that identify significant new product and service innovations, such as the smartphone, DVD, blog or outsourcing. The data capture the moment at which products or services are introduced into the market, turning inventions into innovations. Our analysis of this rich and broad set of data on the diffusion of innovations suggest that while the negative effect of distance may have weakened over time, it is not possible to announce its death by any means.
This paper examines the introduction of new words (‘tokens’)Footnote1 among the 4.5 million words contained in the USPTO trademark register used to describe goods and services during the period 1980–2012, and their subsequent reuse. We consider those tokens that are in the top decile of reuse frequency over a period of five years as a proxy for market impact. For convenience, we employ the nomenclature ‘innovator’ for firms that introduce a new token, and ‘follower’ for subsequent reuse of that token.Footnote2 Using street address information available in the USPTO’s records, we aggregate new-token emergence and diffusion to the year and 2010 census-tract level.Footnote3 This enables an analysis of how geographical distance affects the probability and degree of diffusion of trademarked innovations in the United States from 1980 to 2012.
The paper first provides descriptive results to support the notion that new tokens in the USPTO trademark register identify market introductions that are, in the parlance of the Oslo Manual (OECD & Eurostat, Citation2018), ‘new to the world’. We present map visualizations to show that such tokens have primarily arisen in densely populated metropolitan areas associated with innovation activity in the previous literature (Forman et al., Citation2016; Peri, Citation2005)Footnote4 and that they tend to diffuse primarily to these same areas.Footnote5 The visualizations also show that the 1996–2005 period saw a substantial increase in the establishment of intensive, long-range diffusion links connecting innovators situated in New York, Los Angeles and the San Francisco Bay Area. To further validate trademark tokens as indicators of innovation, we compare the diffusion of inventions and innovations. Diffusion of inventions is measured through patents associated to the innovation through use of the trademark token in patent titles and abstracts. Diffusion of the innovation is measured through use of the tokens in the trademark data. We observe that the diffusion processes of inventions and innovations follow similar dynamics and are often closely linked. This suggests that trademark tokens are likely to be informative about the diffusion of innovations in general.
To test the effect of distance on innovation diffusion, we construct panels of directed census tract dyads over 32 years. We analyse incidence of first diffusion and the intensity of diffusion between census tracts. Building on a model of innovation diffusion between areas, we estimate instrumental variables (IV) Poisson models of diffusion intensity at the level of census tract dyads. The models allow for the possible endogeneity of diffusion links and the ability of locations to absorb innovations. Our primary finding is that distance reduces the intensity of innovation diffusion between locations. This effect is strongest during the Dot com boom years (about 1995–2000). First-stage regressions suggest that distance ceased to affect the likelihood that innovation diffused between locations that had not previously been linked consistent with Head et al. (Citation2018).
In sum, our findings suggest that tokens derived from goods and services declarations drawn from trademark data contain important information about innovation diffusion. Our work expands on work by Semadeni (Citation2006), the first to use trademark tokens to analyse innovation, by demonstrating how large sets of innovations can be studied using these data.
The remainder of the paper is structured as follows. In the next section we discuss existing measures of innovation and diffusion. The third section contains a descriptive analysis of trademark token data. There we compare dynamics of inventions and innovations linked through tokens. The fourth section introduces an empirical model of diffusion and data based on trademark tokens that we analyse with this model. In the fifth section we present results from estimating the model. The sixth section concludes.
MEASURES OF INNOVATION AND DIFFUSION IN PREVIOUS WORK
This section provides a review of the literature on innovation and diffusion and a discussion of how data from the trademark register can complement other sources of data used to study these phenomena.
Measuring innovation
At least since Schumpeter (Citation1934) recognized a distinction between invention and innovation, researchers have sought meaningful measures of this social phenomenon. The Oslo Manual (OECD & Eurostat, Citation2018), which sets out a standard for collecting and using innovation data, defines an innovation as ‘a new or improved product or service’. This definition captures not only the elements of novelty and change but also commercialization.
While several measures have been commonly used in empirical analysis, each suffers from downsides. Research and development (R&D) investment data are readily available and widely used, but measure only inputs to the innovation process. Output measures are more proximate to the market and considered more precise, but are drawn from a limited range of sources: data from the patent registers provide administrative information on technology inventions, while company surveys are used to track innovation processes within and across firms and universities. Since patent data reflect innovation in a limited range of technologies, surveys present a more comprehensive tool in their coverage of technologies and industries, but are expensive to conduct and usually reflect activity in only a small subset of firms.
Recently, new sources of data have emerged to study innovation. Alexopoulos (Citation2011) and Alexopoulos and Cohen (Citation2011, Citation2019) exploit data on new book titles covering computers and technology. Hippel et al. (Citation2010) survey consumers in the UK and show that a significant proportion engage in developing and modifying of consumer products. Moser (Citation2012) uses historical data to study innovation beginning in the 1800s when neither patents nor trademarks were widely available. These papers have primarily addressed the question of how much innovation there is (was) as well as when and how innovation arises.
The innovation measure we employ in this paper – derived from the US trademark register – are administrative data similar to patent information, but cover a much broader range of industries. For instance, trademark protection extends to service industries,Footnote6 an economically vibrant area that patent data largely misses. Trademark data also directly reflect a commercialization event, a characteristic the patent data lack. Furthermore, because trademarks are government data, we are able to link registrant addresses to specific geographical locations.
Trademark data as a source of information on innovations
Semadeni (Citation2006) and Semadeni and Anderson (Citation2010) use 252 terms describing consulting servicesFootnote7 to analyse innovation and competitive interactions of professional services firms. Semadeni uses goods and services descriptions from USPTO trademarks to identify innovators and followers. This work demonstrates the potential of goods and services descriptions for the analysis of innovation. In this paper we explore whether his curated approach to the analysis of tokens drawn from goods and services descriptions can be expanded to lists of tokens extracted on the basis of an algorithm. Due to the novelty of this approach, we discuss the genesis of goods and services lists here as well as other previous work linking trademark data and innovation.
Graham et al. (Citation2013) note that US law requires that each applicant seeking to register a new trademark must clearly and concisely describe – with specificity – the particular goods and services on which it uses (or intends to use) the mark. The USPTO will accept any of the over 37,000 pre-existing identifications in its catalogue, which range from more specific (‘Passenger and light truck tires’) to general (‘Tires’). For novel products or services, applicants may also compose their own goods and services identifications. Where there is no common commercial name, the applicant is required to describe the product or service and its intended use. For instance, the mark ‘My Trazom’ was published in 2011 with the following description: ‘Providing a web site that gives computer users the ability to upload, exchange and share photos, videos and video logs.’ Another, ‘Mablogix’ published in 2012, was described as: ‘Custom manufacturing and custom synthesis of antibodies and genetically engineered DNA expressing antibodies, biological organisms, cells, viruses, pathogens and special purpose cells to the specifications of others for scientific, research, medical, veterinary and laboratory use.’ The USPTO generally does not accept terminology that is overly broad or spans multiple goods and services classes. The specificity-of-description requirement serves to support not only proper classification and better search, but also gives notice to third parties regarding the scope of an applicant’s rights in a mark. To study innovation, we propose to tokenize these goods and services lists and then identify new tokens – the use of which grow comparatively quickly – as described in the following section.
Most previous work linking innovation and trademarks has focused on the trademarks themselves. Since Schmoch (Citation2003) suggested service marks could be used as service innovation indicators, economists have increasingly employed trademark data to provide additional insights to innovation (Bei, Citation2019; Ceccagnoli et al., Citation2010; Flikkema et al., Citation2014; Graham et al., Citation2018; Mendonca et al., Citation2004, Citation2019; Thoma, Citation2015). Trademarks are frequently registered close in time to a new product or service being introduced to the market, so are much nearer to launch date than are patents,Footnote8 and more comparable with the publication dates of technical manuals and books. The trademark registers also reflect activity from a much wider set of sectors and firms than US and European patents (Dinlersoz et al., Citation2018; Graham et al., Citation2013). This wider coverage stems from the lower cost of filing trademarks and from their primary objective: to protect a brand or logo against imitation, and to protect consumers from fraud. As such, trademarks are used at least as widely in service industries as they are elsewhere. Moreover, because companies selling physical products frequently do not patent (Fontana et al., Citation2013; Moser, Citation2012), trademark data can capture innovation missed in patent data.
Diffusion of ideas, inventions and innovations
Patent data have been widely available for decades and analysis of how technological inventions diffuse has commonly relied on these data, specifically on patent citation patterns. Jaffe (Citation1986) showed that patent citations could be used to capture knowledge spillovers and Trajtenberg (Citation1990) demonstrated that the number of times a patent is cited captures the technological significance of the patented invention. Henderson et al. (Citation1993) then showed that spillovers of innovations decline with distance.Footnote9 Scientific publications (e.g., journal articles) constitute a separate source of data to study knowledge diffusion. Publications, like patents, contain citations that may reflect reliance on prior ideas.Footnote10 Head et al. (Citation2018) use rich data from mathematics to provide evidence that distance has become less of a barrier over time to the spread of ideas in mathematics. The contrast between their results and the literature on diffusion of technical knowledge may be indicative of differences in diffusion processes or may reflect changes in general conditions affecting diffusion due to new technologies.
Measuring knowledge diffusion using information on technology usage is onerous because links between the innovation and its (ultimate) use must be inferred. Examples include Comin et al. (Citation2008) and Comin and Hobijn (Citation2010), who provide evidence on the diffusion of a wide range of technologies from data on the adoption of 115 technologies spread over 200 years, across many countries. Comin et al. (Citation2012) also employ these data and find that distance negatively affects technology diffusion.
A similar problem of inference about diffusion mechanisms exists in the data we analyse in this paper. We observe that a term describing a new technology or service appears in the trademark register. The register alone does not reveal that the followers have directly observed the innovator and learned from them about the commercial potential of the inventions being brought to market. But it is documented that the trademark register provides important intelligence for rival firms and that innovators sometimes go to significant lengths to slow down this avenue for diffusion (Fink et al., Citation2018). This supports our contention that subsequent users of a trademark token are likely to have learned about potential for an innovation from the leader.
While the literature studying the diffusion of ideas and innovations has continued to grow, there are a number of data-related reasons to use care when interpretating these results. Nelson et al. (Citation2014) argue that firms may over- or underreport the adoption of innovations. Moreover, the common use of patent data in these studies can introduce bias since not all sectors or firms rely on patents to protect their innovations (Cohen et al., Citation2000; Graham et al., Citation2009; Levin et al., Citation1987). It is also well established that many patents are not associated with product introductions (Hall & Harhoff, Citation2012; Nelson, Citation2009), which may lead to an overestimate of innovation diffusion, though not possibly of ideas, when employing patent-based indicators.
In this respect the trademark data we use for our study present three advantages over patent data. The USPTO requires that the scope of a trademark is restricted to its use in the market. While this requirement is not always met,Footnote11 it increases the strength of the correlation, relative to patenting, between use of a token in a goods and services declaration and the actual introduction of a corresponding product in the market. A second benefit of using trademark data to study innovation derives from the low cost of applying for trademarks, thereby increasing the range of firms employing trademarks and of innovations reflected in the trademark register.
The third benefit of trademark data is that they cover a much broader range of innovations than patent data: innovation is a broad phenomenon, encompassing technological breakthroughs that are embodied in new products and services, but also new forms of cultural expression, new forms of sport, fashion and language itself. This benefit introduces two challenges. The first concerns breadth: patents are limited to specific inventions under the concept of unity of invention. No such requirement exists for trademark tokens associated to new goods or services. As our examples below demonstrate tokens may be extremely broad (e.g., biotechnology, smartphone) or fairly narrow (e.g., eeprom). This is a feature of the data we have to live with; it must be borne in mind whenever trademark tokens are used to study innovation and will affect the interpretation of any findings as we note below.
A second problem resides in the way we identify innovation: novelty of a token in the set of tokens contained on the trademark register. This means we may identify tokens that are potentially just language innovations, that is, pre-existing lines of goods and services are described using a new set of words. In these cases, there is no product market innovation. To address this second problem, we make use of data on word frequencies in natural language derived from an internet based mega-corpus, specifically Google ngram data.Footnote12 We classify tokens representing innovations into six groups, depending on whether they have arisen in natural language before they arise in the set of trademark tokens and if their usage in natural language changes significantly around the time in which they enter the set of trademark tokens. This classification allows us to measure how significant this second problem is likely to be in each group of trademark tokens.
A limitation of other innovation measures noted by Nelson et al. (Citation2014) also affects trademark tokens: when new goods and services are introduced there may be considerable variation in the terminology used to refer to them across firms. It can take time for a commonly accepted name to emerge. Therefore, we may identify the date on which such innovations first emerge incorrectly: the trademark register reveals the date at which the most widely adopted name for an innovation emerges.Footnote13
Balancing these limitations, trademark token data offer a range of opportunities. Analysis of trademark tokens can, in principle, be extended as far back as Britain’s first trademark register in 1876 (Bently, Citation2008). A further benefit derives from the administrative nature of the data: the trademark register reflects both arrival and diffusion of innovations in a way that can be cleanly established. The register contains firms originating new tokens, revealing the spatial concentration of innovations, and the temporal and spatial diffusion to ‘followers’ who subsequently use the same innovation. Moreover, because trademark registration is associated with products and services being introduced into the marketplace, we are arguably focusing on economically or commercially important innovations.
TRADEMARK TOKENS AS MEASURES OF INNOVATION AND DIFFUSION
In this section we discuss insights into US innovation patterns gleaned from analysis of trademark tokens. We compare our findings with previous work on innovation derived from patent data to learn whether trademark tokens capture diffusion of technical innovations. This comparison provides confidence that trademark tokens describe diffusion of innovations apart from mere technical innovations.
Trademarks are registered for a broad range of goods and services. If we are to go beyond the analysis of specific industries based on curated token lists (Semadeni, Citation2006) an algorithm is required that will select large numbers of tokens linked to significant innovations. Here we propose and validate such an algorithm: innovation is reflected in words (tokens) that are entirely new to the corpus of words describing goods or services in the US trademark register. These tokens are ‘new’, on the date they first appear in the register. The subset of tokens most frequently reused in the register within the subsequent five years is selected, where the cut-off is the ninth decile of the distribution of reuse frequencies within each Nice class during the period 1980–2012.Footnote14 Details are relegated to Appendix A in the supplemental data online.
Firms introducing the selected tokens are defined to be innovators; firms reusing the token within the first year are defined to be followers for the purpose of studying diffusion.
This algorithm for the selection of tokens identifies terms that are clearly linked to important innovations, for example, webcast, smartphone, but also others that are less obviously innovative, for example, consultancy or cremation. To address this, we use information from Google’s ngram dataFootnote15 to further classify the selected tokens. We identify those trademark tokens that are both new to language and new to the trademark register as the most likely candidates for significant novelty. A detailed classification of tokens is developed in Appendix B in the supplemental data online,Footnote16 which contains extensive lists of tokens of all types with descriptive statistics that measure the degree of novelty and the extent of use of each token.
The algorithm has three important variables: first, the period in which a token can emerge as significant (five years); second, the threshold for significance (9th decile); and third, the period in which we identify followers (one year). We selected the first to allow us to identify those innovations that grew over a substantial number of years, the second to be conservative with regard to significance and the third to limit the possibility that chains of diffusion arise that we cannot follow with this data alone.Footnote17
This algorithmic approach to the selection of significant tokens cannot ever be as precise as a curated list of tokens: some tokens selected will seem unlikely candidates for a list of significant innovations, even if they are used to describe large numbers of trademarks. In this paper significance is measured relative to usage of the token in patents, trademarks and natural language. We anticipate that such usage is likely correlated with economic importance, but this aspect remains to be explored.
The regional distribution of innovators
Much of what we have learned about the regional distribution of innovation in the United States has come from patent data. Recently, Forman et al. (Citation2016) study where innovations have arisen, identifying an increase in the share of patents originating from the San Francisco Bay area in California, mainly at the expense of the New York City metro area. Much of the shift they identify occurred between 1990 and 2000, yet was not concentrated in information and communication technology (ICT) technologies: the re-concentration is more general across technologies at least those reflected in patenting. Hannigan et al. (Citation2015) illustrate the local persistence of automotive innovation in Detroit, Michigan, even as the manufacturing of automobiles has declined in the region. Their analysis documents the simultaneous importance of local and long-distance links to the continued vibrancy of this geographic technology cluster.
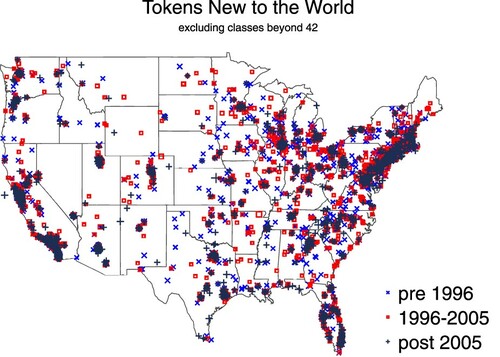
We explore both locations of innovators and long-distance diffusion links using data on trademark tokens next. To do this, addresses of all firms introducing significant new tokens into the trademark register (hereafter innovators) are geocoded.Footnote18 shows the distribution of these innovators across the United States, subdivided into three periods to reveal effects of time on the spatial distribution of innovation. We find that 4295 census tracts out of 73,057 contain innovators. The mapping of innovating census tracts in comports with findings from patent data reported in Forman et al. (Citation2016), Hannigan et al. (Citation2015) and also scientific publications in Balland et al. (Citation2020): a cluster of innovation in and around the San Francisco Bay Area is visible, as is the cluster in the Northeast megalopolis from Boston to Washington DC and persistent innovation around the Rust Belt cities of Minneapolis, MN, Detroit, MI, Cleveland, OH, Pittsburgh, PA, and Buffalo and Rochester, NY.
Figure 1. Census tracts contributing significant new word tokens in US Patent and Trademark Office (USPTO) trademark descriptions.
Note: Symbol size indicates the number of new tokens contributed (larger indicates more tokens) in three time periods (indicated by the style and colour of the symbols). Identified are the concentrations of innovations in spatial proximity, similar to maps of scientific publications and patents (Balland et al., Citation2020) and of local labour markets using commuter flows (Nelson & Rae, Citation2016). These clusters occur in 10 megaregions (e.g., Northeast, Northern California, Southern California) first identified by Lang and Nelson (Citation2007). Due to classification changes, Nice classes 43–45 are excluded for consistency.
We extend our analysis by exploiting subsequent uses of fast growing new tokens in the trademark register, and map the diffusion of these tokens within one year of filing. Appendix B in the supplemental data online sets out a classification of subtypes of the significant new tokens, exploiting data on usage of words in natural language, specifically books published at different times. We define type A tokens as those that rarely or never appear in natural language before their entry in the trademark register. Types C–E appear frequently in books and have varying levels of correlation with a set of frequently used control words pre- and post-entry into the trademark register. shows diffusion links that cover distances of at least 100 miles and across which at least five innovations have diffused. Type A tokens arise in a smaller set of locations and diffuse to fewer locations than innovations linked to tokens of types C–E. This shows that these more novel innovations are rarer and arise in even fewer locations than innovations that draw on pre-existing concepts.
Figure 2. Arrows starting from addresses at which tokens new to the world are introduced and ending at addresses which subsequently use these tokens within the first year of their introduction. We exclude all distances below 100 miles and only show links across which at least five tokens diffused in a given period.
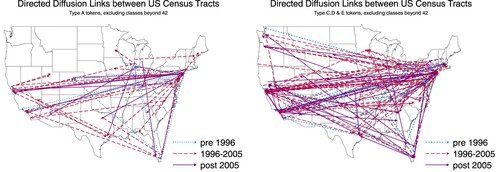
Overall illustrates the importance of New York, the San Francisco Bay Area and Greater Los Angeles to the supply of innovation in the United States. In these graphs of diffusion links, the original long-distance diffusion arose primarily between southern California and New York.
The figures presented here contain more information than we are able to analyse in this article. We note some further avenues for analysis that the figures suggest in the conclusion. Yet it remains to determine whether trademark tokens reveal information about innovations in ways that are closely aligned with more conventionally used innovation measures, such as those derived from patent data. The next section addresses this question.
Validation against patent and natural language measures
This section explores whether the adoption of trademark tokens to describe goods and services follows a similar pattern to those that can be visualized using natural language and patent documents. We expect, consistent with Alexopoulos and Cohen (Citation2011), that as inventions related to a technology become more numerous, the technology becomes better known and will be reflected in more references to the technology in books. This characteristic is captured by the ngram data. We also expect that inventions with commercial applications will eventually result in a growing number of trademark applications referencing the token.
We present graphs of cumulative diffusion curves for eight type A tokens,Footnote19 defined as being both new in language and to the trademark register. The graphs contain three diffusion curves for each token: reflecting use in books (natural language), in patents and in trademarks. The tokens presented in are selected from type A tokens with the highest cumulative patent counts in 2012 (left panel) and with the highest cumulative trademark counts in 2012 (right panel). The selected examples cover digital technology (eeprom, smartphone), nanotechnology (nanoparticle), material sciences (graphene), medicine (prodrugs, immunosuppressants) and services (outsourcing, webcast).Footnote20 In Appendix C in the supplemental data online we provide four additional cumulative diffusion curves for type A tokens for which we were unable to find associated patents.
Figure 3. Diffusion of eight innovations captured using token counts from ngram (circles), patent (diamonds) and trademark (plain line) data. The left panel presents data on four innovations associated with high cumulative patent applications; and the right panel presents data on four innovations associated with high cumulative trademark applications.
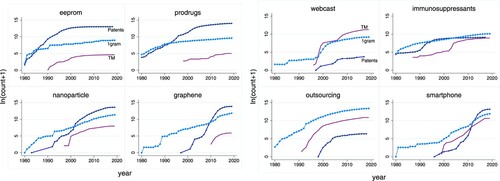
shows that the cumulative diffusion curves for patented inventions and trademarks linked to each token are comparable. The examples offer quite distinct versions of the common ‘s’-curve that characterizes diffusion, ranging from the classical (immunosuppressants) to cases in which the take-off phase is missing (eeprom, outsourcing). However, the curves appear correlated with noticeable kinks that co-occur across the data sources (webcast, nanoparticle, eeprom). As should be expected, inventions for the most part precede innovations. Interestingly, exceptions include tokens that appear associated with service innovations (outsourcing). The first use in language (i.e., books) significantly precedes the patenting of inventions for four of the innovations (e.g., graphene), consistent with the idea that published science and academic discussion predates commercial investment.
Overall reveals that diffusion of inventions and innovations are correlated in ways one would expect. This supports the notion that the trademark tokens our algorithm selects reflect innovation. Further empirical study of the diffusion of specific innovations using trademark token data seems warranted. Since our primary interest here lies with the effects of distance on initial diffusion of innovations, we leave this study of diffusion to future work. The following sections focus on how distance between locations affects the likelihood that innovations diffuse between them.
MODEL AND DATA
Henderson et al. (Citation1993, Citation2005) discuss the primary identification problem that affects all studies seeking to estimate how distance affects diffusion of innovation: Is diffusion localized because distance makes it harder to learn about an innovation, or because those most likely to reuse an innovation are located in the same local area as the innovator? In the second case, unobserved factors can generate a cluster that is revealed by diffusion patterns observed in the data. Henderson et al. (Citation1993) address the identification problem by matching patent citations with potential citations that are comparable.Footnote21 Head et al. (Citation2018), who examine personal ties in mathematics, adopt a similar approach to identification as Henderson et al. (Citation1993) to show that the effects of distance on knowledge diffusion in mathematics have decreased over time.
Because the data source analysed here is relatively novel, we do not have sufficiently detailed information on trademark filing entities and their histories to estimate models at the firm level. In a real sense, we suffer from similar teething problems as early researchers working with the patent data experienced. So instead, we aggregate trademark innovations at the census tract level and estimate gravity models of innovation diffusion in census tract dyads. Notably, Peri (Citation2005) and Li (Citation2014) find strong negative effects of distance on knowledge flows using gravity models.
We estimate the capacity of locations to generate and absorb innovations, and borrow from the literature modeling international trade flows to analyse a fixed set of regional links. We find that the number of potential location dyads is far greater than that of innovation-active location dyads.
Because the data we analyse span many years, we are able to observe repeated diffusions of innovations between locations over time. Analogous to the way patent-data researchers rely on matching citing and non-citing locations to construct controls, we include only those census tract pairs for which we observe at least one diffusion event – but include these pairs for the entire 32 years of the sample. We adopt a gravity-model estimation approach suggested by Silva and Tenreyro (Citation2006) allowing us to retain observations for which diffusion counts are zero. We augment this approach by allowing for endogeneity of first diffusion from one location to another, employing lagged variables to instrument both the formation of diffusion links between census tracts and the absorptive capacity of firms located in the receiving census tract.Footnote22
A further motivation for estimating gravity-type models at the census tract level can be found in the literature on regional innovation systems and clusters. Hannigan et al. (Citation2015) suggest that organizations’ capabilities which spawn innovation reside in local and global linkages between clusters. These capabilities endure and can survive the death or migration of specific entities such as firms or research centres which may help to explain our showing of the persistence of innovation clusters in older Rust Belt cities such as Detroit and Buffalo.
Location-specific fixed effects in non-linear panel data models cannot be consistently estimated due to the incidental parameters problem (Lancaster, Citation2000). We introduce pre-sample data on the number of innovations new to the world arising in the sending and receiving census tracts for the decade 1970–80 to control for permanent unobservable differences across locations (Blundell et al., Citation1995; Hausmann et al., Citation1984).
Model
We adopt a model of innovation diffusion comparable in spirit with the model proposed by Peri (Citation2005). Diffusion from a sending (
) to a receiving (
) area in year
is a function of distance between these areas
, innovation
in the sending location and absorptive capacity
in the receiving location and time and area fixed effects
:
(1)
(1) This specification can be estimated with a Poisson model. To address the identification problem with which the micro-level literature has grappled (Henderson et al., Citation1993), we endogenize the first instance of diffusion from sending to receiving location and control for the age of the link between them. We also allow for the endogeneity introduced by a receiving area’s absorptive capacity, but assume that the arrival of ‘new-to-the-world’ innovations at the sending location is uncorrelated with location specific unobserved effects.Footnote23
Data
Define as the count of the number of tokens introduced as new to the world in year
in the sending location, which are used within one year at the receiving location. This is a measure of innovation diffusion between locations:
. We can derive a structural equation from the model:
(2)
(2) To endogenize the formation of diffusion links between locations,
identifies the first year of diffusion in a dyad. When estimating this model, we control for time and area fixed effects
. The structural equation can be estimated using an IV Poisson model with endogenous covariates and an additive error term (Silva & Tenreyro, Citation2006; Windmeijer & Santos Silva, Citation1997).
Equation (2) contains three principal explanatory variables:
Distances,r,t (miles) is calculated as the median distance of all sending – receiving firm pairs per year for each census tract dyad. Distance can vary within a dyad over time to reflect changes in the concentration of economic activity in locations within a census tract. A distance is the geodesic distance between the sending and receiving locations, calculated using the haversine formula. Previous literature suggests that this variable will have a negative effect on diffusion.
Innovations,t is the count of all new-to-the-world tokens generated in the sending census tract per year. We also use the lagged count of innovation per year in the receiving census tract as an instrument. We do not endogenize innovation.
Net Diffusionr,t, is the count of all new-to-the-world tokens diffusing to a receiving census tract, net of those from a sending census tract per year. This variable can be thought of as an analogue of local absorptive capacity for the receiving census code (Cohen & Levinthal, Citation1990). We instrument this variable.
The median distance between sending and receiving locations in the data is 750 miles. The distribution of distances is ‘U’-shaped with a significant spike for very short distances.
In addition, we include several covariates:
Years linkeds,r,t measures the number of years that have passed since the first diffusion of an innovation from the sending to the receiving census tract.
Period has three phases: before 1996, between 1996 and 2005, and after 2005. The phases are chosen so as to separate out the decade centred on the Dot com boom in 2000, during which significant investments in Internet-mediated communication took place and US trademark registrations were unusually high (Graham et al., Citation2013).
The algorithm we describe in the second section identifies 13,749 significant new tokens. A total of 9227 of the significant new tokens are introduced by a US firm and fall into NICE classes below 43: these are our main sample. Appendix B in the supplemental data online sets out how tokens can be further subdivided into those that are novel in the English language and those that represent changed uses of language. We identify 3645 tokens that occur infrequently in the English language before the introduction of the token into the USPTO trademark database. Of these, 2386 tokens remain in the data once we restrict to classes below 43 and US applicants. Appendix B contains extensive lists of these type A and B tokens as well as of the remaining categories of tokens we identify. The analysis presented below is based on the 2386 type A and B tokens. Appendix C in the supplemental data online replicates results based on all 9227 tokens.
The 2386 type A and B tokens originate from addresses in 1127 distinct census tractsFootnote24 and are received by (diffuse to) addresses in 2533 distinct census tracts. For 15.6% of sending–receiving census tract dyads, the sending and receiving addresses lie within the same census tract.Footnote25
Balanced panels of census tract and year aggregates of new-to-the-world token introductions and their diffusion are used in our analysis below. We identify 4271 census tract dyads having at least one instance of a diffusion from sending to receiving census tract in the 32 years between 1981 and 2012. sets out descriptive statistics for the resulting panel.
Table 1. Descriptive statistics: type A and B tokens (N = 136,663).
RESULTS
This section contains estimation results for the sample of type A and B tokens. We begin with results from the first-stage models and then present and discuss results from estimation of the structural equation. Section D in Appendix D in the supplemental data online contains descriptive statistics and results for the full sample of all tokens identified by the algorithm described in the second section.
First-stage models: probability of diffusion and net diffusion
When estimating the structural equation (2) we allow for the endogeneity of link formation between dyads of sending and receiving census tracts. We also allow for the endogeneity of the receiving location’s absorption of innovations from other census tracts. Here we discuss results from estimation of first-stage models for first diffusion and net diffusion of the receiving census tract in .
Table 2. First-stage models: first diffusion and net diffusion (N = 136,663).
We condition on the distance between sending and receiving census tracts as well as the innovation rate in the sending census tract. sets out two versions of each model: the first contains no interactions, while the second allows for interactions between distance and time periods. We introduce four variables to instrument the endogenous variables: lagged net diffusion to the receiving census tract, lagged net diffusion to the sending census tract, lagged innovation in the receiving census tract and age of the link between census tracts. We also condition on pre-sample innovation levels in both census tracts.
The probability of link formation between census tracts decreases with the median distance between all sending and receiving firms in the two locales. While this effect is statistically significant, it is very small in absolute value: a 1 SD (standard deviation) increase of ln distance from the mean (53%) would decrease the probability of first diffusion by a 600th of a per cent. The mean probability of first diffusion in the sample is 50 times higher than this (model 2). Moreover, the interaction with dummies for periods two (1996–2005) and three (post 2005) results in insignificant effects for distance in those two periods (model 2). These results support the notion that distance is not, or is no longer, a meaningful source of friction for the creation of diffusion links between even fairly remote areas in the United States. This finding is notable given the country’s large land area (9.8 million km2).
also shows that innovation in the sending census tract increases the probability that innovations will diffuse between tracts.
A higher rate of diffusion in the past from other census tracts to the receiving census tract reduces that probability of diffusion, suggesting that persistent transfer links between specific locales may pose barriers to entry to ideas and innovations from different locations. Effects in the first-stage models for net diffusion to the receiving census tract are largely similar to effects just discussed.
IV models for the diffusion of innovations
sets out results from estimating the structural equation for diffusion intensity between locations: equation (2). There are five columns in : the first provides a baseline model in which we use no instruments. also contains marginal effects for the distance variable, by time period, below the main results.
Table 3. Instrumental variables (IV) Poisson models of innovation diffusion – sample: type A and B tokens (N = 136,663).
The restricted IV results (columns 2 and 3) are obtained by excluding age of the link between locations from the set of instruments. This variable has a significant negative effect on net diffusion to the receiving location (). Inclusion of this instrument significantly increases the effect of distance on the number of innovations that diffuse between locations.
The effect of distance is statistically significant and large. Distance reduces the number of innovations that diffuse from a sending to a receiving location: a 5% increase in the distance between locations reduces diffusion by > 1%.
Net diffusion to a receiving location increases the number of innovations generated in the sending location that diffuse to the receiving census tract (suggesting an absorptive capacity pull effect). This coefficient is severely downward biased when we do not instrument first diffusion and net diffusion to the receiving census tract.
Controls for pre-sample innovation levels in both sending and receiving locations significantly affect diffusion. This indicates the importance of unobserved location specific effects for diffusion.
Allowing for the endogeneity in the structural equation affects the size of the marginal effects we estimate for distance. However, the pattern of effects is the same: distance impeded diffusion almost three times as much during the years of the Dot com boom for these type A and B innovations. We find the same pattern holds when we analyse diffusion for the full set of trademark tokens identified by the algorithm introduced here. These findings are relegated to Appendix D in the supplemental data online. This suggests that the greater dynamism of that period produced innovations that were less transferable to businesses at greater distance from the originators.
To summarize, our results show that spatial distance no longer affects the creation of diffusion links after 1996. However, conditional on an existing diffusion link between two locations, we find persistent, strong and negative effects of greater spatial distance on the intensity (extent) of diffusion for existing transfer links between locations.
CONCLUSIONS
This paper contains new evidence on the effect that geographical distance has on the diffusion of innovations. A primary contribution is the description and application of a previously unused source of information on innovations and their diffusion, namely the emergence and reuse of ‘new-to-the-world’ terms (tokens) contained in the goods and services descriptions of administrative trademark registrations. While this paper considers trademark information generated during only three decades in the United States, there is wide scope for this measure to be constructed from public trademark information in any country, and for periods beginning as early as the late 1800s, when administrative trademark registers began to be recorded.
While the consensus scholarly view is that the diffusion of ideas and innovation decreases as spatial distance increases, recent scholarship questions this regularity. By linking new trademark tokens to the business addresses of innovator and follower firms, and defining substantial innovations as new-to-the-world tokens in goods and services descriptions, we are able to analyse the diffusion patterns of the most commercially impactful innovations linked to trademarks from 1980 to 2012.
Our results largely confirm findings in previous work, which has shown that distance hampers the spread of ideas, inventions and innovations. The novelty of our findings lies in the source of information about innovation and diffusion, which is entirely different from that exploited in previous work. We address some of the endogeneity likely to affect this type of work. However, we do not have experimental or quasi-experimental data at our disposal and are not in a position to control for other pathways, such as the personal networks which may mediate the diffusion of innovations. Therefore, we cannot entirely rule out that diffusion is primarily local, because even in the age of the Internet, the networks of innovators and gatekeepers in the sense of Roberts and Fusfeld (Citation1982) may remain primarily local.
The data source we exploit captures innovation for a much broader range of applications and technologies than those reflected in patent data, most innovation surveys, and even the books and manuals recently studied by Alexopoulos and Cohen (Citation2011). However, this breadth also introduces certain limitations: the breadth of the data means that diffusion mechanisms that explain how information passes between firms may vary. The breadth of these data derives from its administrative nature, but this also means that we have reliable information only about the location of the firm that handles the registration of trademarks. These data can teach at best a limited amount concerning the process from invention to innovation, and is silent about the location of the inventors who contributed to the innovation. However, these limitations may be remedied in further research by studying in greater detail the links between patents and trademarks, matched through common tokens and filed by the same firm. A further dimension of the data we have not studied here is whether significant references to a token in multiple sources (for instance language, patents and trademarks) are indicative of economic impact, as measured using product sales, employment growth or the like. Finally, the algorithm we adopt excludes interesting innovation phenomena, such as sleeping beauties (Ke et al., Citation2015): inventions that do not find widespread commercial use or scientific recognition for a long period of time. Future researchers could remedy this shortcoming by carefully integrating data on scientific publications, patents and trademarks based on common tokens, over longer periods of time than we use here.
Beyond these questions related to diffusion, trademark tokens open opportunities for new research into aggregate innovation activities in an economy. The trademark token data are particularly useful for analysis of technologies, industries, firms, and economies for which patents – the most common data used to analyse diffusion – are less suitable. Accordingly, our descriptive analysis of the trademark token data suggests that further work is warranted to better understand what additional insights trademark tokens can reveal about diffusion patterns post-1876. If it can be established that the propensity for new tokens describing new technologies has remained relatively constant over the period after 1876, trademark tokens would be useful indicators, adding insight into the amount of innovation generated since the late 1800s. Such a finding would help bring light to many important questions, including possibly those being raised in the recent literature about the productivity slowdown affecting advanced economies (Gordon, Citation2018).
Future analysis would also be welcome as regards the descriptive results presented in the paper, suggesting that the locations of innovating firms have become more concentrated over time.Footnote26 Careful analysis of the number of new firms and their locations is warranted, possibly using other data sources to add precision and depth. Future research could also investigate whether quality of communication networks moderate the effects distance has on the diffusion of innovation, taking advantage of recent data on broadband quality at the census tract level (Flamm & Varas, Citation2020). Finally, the analysis we have provided here neglects the question of technology fields and clusters of inventive activity, as well as clusters of firms innovating in similar product markets. Again, future research would require a more accurate classification of economic activities than presented by the Nice classification, which are themselves a relatively blunt tool. As matching patent classifications to industry codes vexed early researchers using that data source, trademark applications and their associated product introductions could benefit from more accurate classification, thus presenting research opportunities for future investigation.
Supplemental Material
Download PDF (238.6 KB)ACKNOWLEDGEMENTS
We thank Robert Burrell, Amy Cotton, Carsten Fink, Brigitte Granville, Dietmar Harhoff, Michal Kazimierczak, Robert Kimble, Georg Licht, David Muls, Alex Oettl, Pietro Panzarasa, Nathan Wajsman, Kenneth Younge and the participants at the 2019 Oxford University Innovation Measures workshop and the 2021 GEO INNO conference for their comments on earlier versions of this paper.
DISCLOSURE STATEMENT
No potential conflict of interest was reported by the authors.
Additional information
Funding
Notes
1. We tokenize the goods and services declaration attached to all USPTO trademark applications and list their constituent words. These are the tokens we subsequently study. In other parlance, we identify the set of all 1grams within the goods and services declarations.
2. We refer to ‘followers’ because these firms reuse tokens new to the world. Followers may introduce further improvements to the product or service that we do not observe or capture here.
3. A US census tract covers a geographically contiguous area with an average of 4000 inhabitants. Further information on US census tracts is provided in the online glossary of the US census here. We geocode trademark registrants addresses and link these to 2010 census tracts using spatial merge. The census tract database provides Federal Information Processing Standard (FIPS) codes that identify the county and state in which each census tract is located.
4. Patenting-intensive regions in the United States include New York City, the San Francisco Bay Area and Greater Los Angeles.
5. The 2010 census contained 73,057 separate tracts. A total of 4295 tracts contain addresses of applicants who introduced fast growing new tokens into the USPTO’s trademark register. A total of 8659 tracts contained addresses of firms that took up these tokens within the first year of filing. The vast majority of census tracts contain no innovating firms by this measure.
6. Due to a change in the trademark classification system introduced in 2000, we have excluded some of the service classes (43–45) from our analysis.
7. The tokens ‘consultancy’ and ‘consultation’ are among the most frequently used type C tokens we identify. The typology of tokens is introduced in Appendix B in the supplemental data online.
8. In pharmaceuticals, patent filing often precedes product introduction by 7–10 years (Grabowski & Vernon, Citation2000).
9. This is supported, inter alia, by Peri (Citation2005), Belenzon and Schankerman (Citation2013), Singh and Marx (Citation2013) and Li (Citation2014).
10. However, recent research investigates the incidence of so-called negative citations in science (Catalini et al., Citation2015).
11. The USPTO conducted a Proof of Use pilot in 2012, requiring trademark owners to submit additional evidence of trademark use on the goods or in connection with the services identified in the registration. In just over half of the randomly selected registrations, owners were unable to verify previously claims of use, resulting in either narrowing of protection through deletion of goods and/or services or outright registration cancellation. See the Post Registration Proof of Use Pilot Final Report (accessed 12 August 2019) at https://www.uspto.gov/sites/default/files/trademarks/notices/Post_Registration_Proof_of_Use.doc.
12. For details about this source of data, see Appendix B in the supplemental data online.
13. Grodal et al. (Citation2015) note how the category label ‘smartphone’ emerged against the resistance of some of the current market leaders. We provide evidence on the concurrent growth of ‘smartphone’ in natural language, trademarks and patents in . The data we analyse provide opportunities for further work on the emergence and evolution of category labels, but a full exploration goes far beyond our focus in this paper.
14. The Nice Classification classifies goods and services used in the registration of marks.
15. The data are available on the Google ngram webpages.
16. Empirical results regarding the effects of distance on the diffusion of innovations reflected in trademark tokens are not affected by this additional filter. For results demonstrating this, see Appendix D in the supplemental data online.
17. The median token in our data diffuses once in the first 364 days.
18. Geocoding of addresses was performed with the help of two Stata modules: opencagegeo (Zeigermann, Citation2016) and geocodehere (Hess, Citation2015). We geocoded a subset of addresses twice and checked the reliability of the packages used.
19. There are 2539 type-A tokens in our data, and we link 1519 (60%) of these to patents.
20. In the second section we note that the emergence of a technology described by a token may precede the appearance of the token/label itself. Upon investigating when these tokens appeared in , we find the first in-language mention of EEPROM (Johnson et al., Citation1980) and ‘smartphone’ (Grodal et al., Citation2015) correspond to their appearance in the TM data. However, ‘prodrugs’ were used long before the label was coined (Stella et al., Citation1985); the potential of nanotechnology was predicted decades earlier by Feynman (Citation1960), but the field only really emerged as a separate area of research in the 1980s (Grodal, Citation2018). These examples illustrate that significant innovations and their labels can emerge suddenly, or instead very gradually. In the investigation we undertake in this paper, we assemble data that reveal how innovations evolve once a dominant label is established.
21. This approach was subsequently critically tested by Thompson and Fox-Kean (Citation2005) and commented on by Henderson et al. (Citation2005). Singh and Marx (Citation2013) extend the methodology used to estimate this type of matching model.
22. Methods used to endogenize variables in a Poisson framework are developed by Windmeijer and Santos Silva (Citation1997).
23. We control for location-specific constant unobserved effects using presample data on innovation (Blundell et al., Citation1995).
24. Data on census tract boundaries were obtained from ESRI. It can be downloaded at https://www.arcgis.com/home/item.html?id=ca1316dba1b442d99cb76bc2436b9fdb. We used the Stata add-on geoinpoly Picard (Citation2015) for the spatial merging of firm locations to census tracts.
25. This does not affect our analysis of distance effects as we construct the distance between sending and receiving addresses per census tract dyad as the median distance within each dyad and year. Having geocoded the addresses of all filing entities, we are able to construct distances even within the same census tract.
26. Concentration of innovation is documented and an explanation presented by Balland et al. (Citation2020).
REFERENCES
- Alexopoulos, M. (2011). Read all about it!! What happens following a technology shock? American Economic Review, 101(4), 1144–1179. https://doi.org/https://doi.org/10.1257/aer.101.4.1144
- Alexopoulos, M., & Cohen, J. (2011). Volumes of evidence: Examining technical change in the last century through a new lens. Canadian Journal of Economics/Revue canadienne d’économique, 44(2), 413–450. https://doi.org/https://doi.org/10.1111/j.1540-5982.2011.01639.x
- Alexopoulos, M., & Cohen, J. (2019). Will the new technologies turn the page on US productivity growth? Economics Letters, 175, 19–23. https://doi.org/https://doi.org/10.1016/j.econlet.2018.11.027
- Balland, P.-A., Jara-Figueroa, C., Petralia, S. G., Steijn, M. P., Rigby, D. L., & Hidalgo, C. A. (2020). Complex economic activities concentrate in large cities. Nature Human Behaviour, 4(3), 248–254. https://doi.org/https://doi.org/10.1038/s41562-019-0803-3
- Bei, X. (2019). Trademarks, specialized complementary assets, and the external sourcing of innovation. Research Policy, 48(1), 1–10. https://doi.org/https://doi.org/10.1016/j.respol.2018.07.014
- Belenzon, S., & Schankerman, M. (2013). Spreading the word: Geography, policy, and knowledge spillovers. Review of Economics and Statistics, 95(3), 884–903. https://doi.org/https://doi.org/10.1162/REST_a_00334
- Bently, L. (2008). The making of modern trade mark law: The construction of the legal concept of trade mark (1860–1880). In L. Bently, J. Davis, & J. C. Ginsburg (Eds.), Trade marks and brands: An interdisciplinary critique (pp. 3–41). Cambridge University Press.
- Blundell, R., Griffith, R., & Reenen, J. V. (1995). Dynamic count data models of technological innovation. The Economic Journal, 105, 333–344. https://doi.org/https://doi.org/10.2307/2235494
- Catalini, C., Lacetera, N., & Oettl, A. (2015). The incidence and role of negative citations in science. Proceedings of the National Academy of Sciences, 112(45), 13823–13826. https://doi.org/https://doi.org/10.1073/pnas.1502280112
- Ceccagnoli, M., Graham, S. J., Higgins, M. J., & Lee, J. (2010). Productivity and the role of complementary assets in firms demand for technology innovations. Industrial and Corporate Change, 19(3), 839–869. https://doi.org/https://doi.org/10.1093/icc/dtq033
- Clark, G. L., Feldman, M. P., Gertler, M. S., & Wójcik, D. (2018). The new Oxford handbook of economic geography. Oxford University Press.
- Cohen, W. M., & Levinthal, D. A. (1990). Absorptive capacity: A new perspective on learning and innovation. Administrative Science Quarterly, 35(1), 128–152. https://doi.org/https://doi.org/10.2307/2393553
- Cohen, W. M., Nelson, R. R., & Walsh, J. P. (2000). Protecting their intellectual assets: Appropriability conditions and why U.S. manufacturing firms patent (or not) (Working Paper 7552). National Bureau of Economic Research (NBER).
- Comin, D. A., Dmitriev, M., & Rossi-Hansberg, E. (2012). The spatial diffusion of technology (Working Paper No. 18534). National Bureau of Economic Research (NBER).
- Comin, D., & Hobijn, B. (2010). An exploration of technology diffusion. American Economic Review, 100(5), 2031–2059. https://doi.org/https://doi.org/10.1257/aer.100.5.2031
- Comin, D., Hobijn, B., & Rovito, E. (2008). A new approach to measuring technology with an application to the shape of the diffusion curves. The Journal of Technology Transfer, 33(2), 187–207. https://doi.org/https://doi.org/10.1007/s10961-007-9079-2
- Dinlersoz, E. M., Goldschlag, N., Myers, A., & Zolas, N. (2018). An anatomy of US firms seeking trademark registration. In Measuring and accounting for innovation in the 21st century. University of Chicago Press.
- Feldman, M. P., & Kogler, D. F. (2010). Stylized facts in the geography of innovation. In B. H. Hall & N. Rosenberg (Eds.), Handbook of the economics of innovation (pp. 381-410). North-Holland. https://doi.org/https://doi.org/10.1016/S0169-7218(10)01008-7
- Feynman, R. P. (1960). There’s plenty of room at the bottom. California Institute of Technology, Engineering and Science Magazine.
- Fink, C., Fosfuri, A., Helmers, C., & Myers, A. F. (2018). Submarine trademarks (Economic Research Working Paper No. 51). World Intellectual Property Organization (WIPO).
- Flamm, K., & Varas, P. (2020). Technological innovation and quality improvement in US broadband. SSRN 3749840.
- Flikkema, M., De Man, A.-P., & Castaldi, C. (2014). Are trademark counts a valid indicator of innovation? Results of an in-depth study of new Benelux trademarks filed by SMEs. Industry and Innovation, 21(4), 310–331. https://doi.org/https://doi.org/10.1080/13662716.2014.934547
- Fontana, R., Nuvolari, A., Shimizu, H., & Vezzulli, A. (2013). Reassessing patent propensity: Evidence from a dataset of R&D awards, 1977–2004. Research Policy, 42(10), 1780–1792. https://doi.org/https://doi.org/10.1016/j.respol.2012.05.014
- Forman, C., Goldfarb, A., & Greenstein, S. (2016). Agglomeration of invention in the Bay Area: Not just ICT. American Economic Review, 106(5), 146–151. https://doi.org/https://doi.org/10.1257/aer.p20161018
- Gordon, R. J. (2018). Declining American economic growth despite ongoing innovation. Explorations in Economic History, 69, 1–12. https://doi.org/https://doi.org/10.1016/j.eeh.2018.03.002
- Grabowski, H. G., & Vernon, J. M. (2000). Effective patent life in pharmaceuticals. International Journal of Technology Management, 19(1/2), 98–120. https://doi.org/https://doi.org/10.1504/IJTM.2000.002803
- Graham, S. J. H., Marco, A. C., & Myers, A. F. (2018). Monetizing marks: Insights from the USPTO trademark assignment dataset. Journal of Economics & Management Strategy, 27(3), 403–432. https://doi.org/https://doi.org/10.1111/jems.12261
- Graham, S. J., Hancock, G., Marco, A. C., & Myers, A. (2013, January 31). The USPTO trademark case files dataset: Descriptions, lessons, and insights (USPTO Working Paper).
- Graham, S. J., Merges, R. P., Samuelson, P., & Sichelman, T. (2009). High technology entrepreneurs and the patent system: Results of the 2008 Berkeley patent survey. Berkeley Technology Law Journal, 24, 1255.
- Grodal, S. (2018). Field expansion and contraction: How communities shape social and symbolic boundaries. Administrative Science Quarterly, 63(4), 783–818. https://doi.org/https://doi.org/10.1177/0001839217744555
- Grodal, S., Gotsopoulos, A., & Suarez, F. F. (2015). The coevolution of technologies and categories during industry emergence. Academy of Management Review, 40(3), 423–445. https://doi.org/https://doi.org/10.5465/amr.2013.0359
- Hall, B. H. (2006). Innovation and diffusion. In J. Fagerberg & D. C. Mowery (Eds.), The Oxford handbook of innovation (pp. 459–485). Oxford University Press.
- Hall, B. H., & Harhoff, D. (2012). Recent research on the economics of patents (Working Paper 17773). National Bureau of Economic Research (NBER).
- Hannigan, T. J., Cano-Kollmann, M., & Mudambi, R. (2015). Thriving innovation amidst manufacturing decline: The Detroit auto cluster and the resilience of local knowledge production. Industrial and Corporate Change, 24(3), 613–634. https://doi.org/https://doi.org/10.1093/icc/dtv014
- Hausmann, J., Hall, B., & Griliches, Z. (1984). Econometric models for count data with an application to the patents-R&D relationship. Econometrica, 52(4), 909–938. https://doi.org/https://doi.org/10.2307/1911191
- Head, K., Li, Y. A., & Minondo, A. (2018). Geography, ties, and knowledge flows: Evidence from citations in mathematics. Review of Economics and Statistics, 101(4), 713–727. https://doi.org/https://doi.org/10.1162/rest_a_00771
- Henderson, R., Jaffe, A. B., & Trajtenberg, M. (1993). Geographic localization of knowledge spillovers as evidenced by patent citations. The Quarterly Journal of Economics, 108(3), 577–598. https://doi.org/https://doi.org/10.2307/2118401
- Henderson, R., Jaffe, A., & Trajtenberg, M. (2005). Patent citations and the geography of knowledge spillovers: A reassessment: Comment. American Economic Review, 95(1), 461–464. https://doi.org/https://doi.org/10.1257/0002828053828644
- Hess, S. (2015). GEOCODEHERE: Stata module to provide geocoding relying on Nokias here maps API. Statistical Software Components, Boston College Department of Economics.
- Hippel, E. V., Jong, J. D., & Flowers, S. (2010). Comparing business and household sector innovation in consumer products: Findings from a representative study in the UK. Management Science, 58(9), 1669–1681. www.jstor.org/stable/23257859
- Jaffe, A. B. (1986). Technological opportunity and spillovers of R&D: Evidence from firms’ patents, profits and market value. American Economic Review, 76(5), 984–1001. www.jstor.org/stable/1816464
- Johnson, W., Perlegos, G., Renninger, A., Kuhn, G., & Ranganath, T. (1980). A 16Kb electrically erasable nonvolatile memory. In 1980 IEEE International Solid-State Circuits Conference. Digest of technical papers (pp. 152–153). IEEE. https://doi.org/10.1109/ISSCC.1980.1156030
- Ke, Q., Ferrara, E., Radicchi, F., & Flammini, A. (2015). Defining and identifying sleeping beauties in science. Proceedings of the National Academy of Sciences, 112(24), 7426–7431. https://doi.org/https://doi.org/10.1073/pnas.1424329112
- Keller, W., & Yeaple, S. R. (2013). The gravity of knowledge. American Economic Review, 103(4), 1414–1444. https://doi.org/https://doi.org/10.1257/aer.103.4.1414
- Kolko, J. (2000). The death of cities? The death of distance? Evidence from the geography of commercial internet usage. In The internet upheaval: Raising questions, seeking answers in communications policy (pp. 73–98). MIT Press.
- Lancaster, T. (2000). The incidental parameter problem since 1948. Journal of Econometrics, 95(2), 391–413. https://doi.org/https://doi.org/10.1016/S0304-4076(99)00044-5
- Lang, R. E., & Nelson, A. C. (2007). America 2040: The rise of the megapolitans. Planning, 73, 7–12.
- Levin, R. C., Klevorick, A. K., Nelson, R. R., & Winter, S. G. (1987). Appropriating the returns from industrial research and development. Brookings Papers on Economic Activity, 3. https://www.brookings.edu/wpcontent/uploads/1987/12/1987c_bpea_levin_klevorick_nelson_winter_gilbert_griliches.pdf
- Li, Y. A. (2014). Borders and distance in knowledge spillovers: Dying over time or dying with age? – Evidence from patent citations. European Economic Review, 71, 152–172. https://doi.org/https://doi.org/10.1016/j.euroecorev.2014.07.005
- Marshall, A. (1920). Principles of economics. Macmillan.
- Mendonca, S., Pereira, T. S., & Godinho, M. M. (2004). Trademarks as an indicator of innovation and industrial change. Research Policy, 33(9), 1385–1404. https://doi.org/https://doi.org/10.1016/j.respol.2004.09.005
- Mendonca, S., Schmoch, U., & Neuh, P. (2019). Interplay of patents and trademarks as tools in economic competition. In W. Glänzel, H. F. Moed, U. Schmoch & M. Thelwall (Eds.), Springer handbook of science and technology indicators (pp. 1023–1035). Springer Nature.
- Moser, P. (2012). Innovation without patents: Evidence from world’s fairs. The Journal of Law and Economics, 55(1), 43–74. https://doi.org/https://doi.org/10.1086/663631
- Nelson, A. J. (2009). Measuring knowledge spillovers: What patents, licenses and publications reveal about innovation diffusion. Research Policy, 38(6), 994–1005. https://doi.org/https://doi.org/10.1016/j.respol.2009.01.023
- Nelson, A. J., Earle, A., Howard-Grenville, J., Haack, J., & Young, D. (2014). Do innovation measures actually measure innovation? Obliteration, symbolic adoption, and other finicky challenges in tracking innovation diffusion. Research Policy, 43(6), 927–940. https://doi.org/https://doi.org/10.1016/j.respol.2014.01.010
- Nelson, G. D., & Rae, A. (2016). An economic geography of the United States: From commutes to mega regions. PloS One, 11, e0166083. https://doi.org/https://doi.org/10.1371/journal.pone.0166083
- Organisation for Economic Co-operation and Development (OECD) & Eurostat. (2018). Oslo manual 2018: Guidelines for collecting, reporting and using data on innovation, 4th Edition, The measurement of scientific, technological and innovation activities. OECD Publ./Eurostat. https://doi.org/https://doi.org/10.1787/9789264304604-en
- Peri, G. (2005). Determinants of knowledge flows and their effect on innovation. Review of Economics and Statistics, 87(2), 308–322. https://doi.org/https://doi.org/10.1162/0034653053970258
- Picard, R. (2015). GEOINPOLY: Stata module to match geographic locations to shapefile polygons. Statistical Software Components, Boston College Department of Economics.
- Roberts, E. B., & Fusfeld, A. R. (1982). Critical functions: Needed roles in the innovation process. In R. Katz (Ed.), Career issues in human resource management. Prentice-Hall.
- Schmoch, U. (2003). Service marks as novel innovation indicator. Research Evaluation, 12(2), 149–156. https://doi.org/https://doi.org/10.3152/147154403781776708
- Schumpeter, J. A. (1934). The theory of economic development: An inquiry into profits, capital, credit, interest, and the business cycle. Harvard University Press.
- Semadeni, M. (2006). Minding your distance: How management consulting firms use service marks to position competitively. Strategic Management Journal, 27(2), 169–187. https://doi.org/https://doi.org/10.1002/smj.510
- Semadeni, M., & Anderson, B. S. (2010). The follower’s dilemma: Innovation and imitation in the professional services industry. Academy of Management Journal, 53(5), 1175–1193. https://doi.org/https://doi.org/10.5465/amj.2010.54533232
- Silva, J. S., & Tenreyro, S. (2006). The log of gravity. Review of Economics and Statistics, 88(4), 641–658. https://doi.org/https://doi.org/10.1162/rest.88.4.641
- Singh, J., & Marx, M. (2013). Geographic constraints on knowledge spillovers: Political borders vs. spatial proximity. Management Science, 59(9), 2056–2078. https://doi.org/https://doi.org/10.1287/mnsc.1120.1700
- Stella, V. J., Charman, W., & Naringrekar, V. H. (1985). Prodrugs. Drugs, 29(5), 455–473. https://doi.org/https://doi.org/10.2165/00003495-198529050-00002
- Thoma, G. (2015). The value of patent and trademark pairs. In Academy of Management Annual Meeting Proceedings, 2015(1), 12373–12373. doi:https://doi.org/10.5465/AMBPP.2015.12373abstract
- Thompson, P., & Fox-Kean, M. (2005). Patent citations and the geography of knowledge spillovers: A reassessment. American Economic Review, 95(1), 450–460. https://doi.org/https://doi.org/10.1257/0002828053828509
- Trajtenberg, M. (1990). A penny for your quotes: Patent citations and the value of innovations. The RAND Journal of Economics, 21(1), 172–187. https://doi.org/https://doi.org/10.2307/2555502
- Windmeijer, F. A., & Santos Silva, J. M. (1997). Endogeneity in count data models: An application to demand for health care. Journal of Applied Econometrics, 12(3), 281–294. https://doi.org/https://doi.org/10.1002/(SICI)1099-1255(199705)12:3<281::AID-JAE436>3.0.CO;2-1
- Zeigermann, L. (2016). OPENCAGEGEO: Stata module for forward and reverse geocoding using the Opencage Geocoder API. Statistical Software Components, Boston College Department of Economics.