
 ?Mathematical formulae have been encoded as MathML and are displayed in this HTML version using MathJax in order to improve their display. Uncheck the box to turn MathJax off. This feature requires Javascript. Click on a formula to zoom.
ABSTRACT
We make the case for a technology-enabled approach to Smart Specialisation policymaking aimed at increasing its effectiveness by assessing the general equilibrium effects of the European Cohesion Policy objectives contained in the regional Operational Programmes prepared by the regional policymakers. We simulate the impact of achieving the research and development personnel targets on gross domestic product and its components in a set of Southern European regions. We discuss the implications and challenges of the proposed methodology for future assessments of Smart Specialisation and for its implementation in the regions of the European Union.
INTRODUCTION
The 2014–20 European Cohesion Policy cycle aims at promoting smart, sustainable and inclusive growth in all regions of the European Union (EU), with a particular focus on the less developed ones. According to European legislation (European Union, Citation2013a), EU countries and regions must formally adopt a Research and Innovation Strategy for Smart Specialisation (RIS3) in order to access funding for research and innovation (R&I) investment through the European Regional Development Fund (ERDF), which is the main fund to support European economic development.
Smart Specialisation characterizes the EU approach to regional innovation policy and aims to strengthen the place-based nature of Cohesion Policy (Barca, Citation2009). Smart Specialisation was implemented shortly after its theoretical framework was developed (Foray et al., Citation2009, Citation2011), and became a pillar of the reformed Cohesion Policy for the 2014–20 funding cycle. The goal of Smart Specialisation is for regions to identify opportunities to build competitive advantages in high value-added activities. This is based on the idea that each region has different economic and institutional structures determining the potential for future development, rejecting the one-size-fits-all policies that the EU had used previously, which was for the most part country oriented (Balland et al., Citation2019; Kroll, Citation2015).
The Smart Specialisation approach has the following two main features: (1) selectivity of policy intervention, meaning that public support should be focused on a limited number of economic activities instead of being granted across the board (referred to as investment priorities or priority areas); and (2) the entrepreneurial discovery process, an interactive process involving the private sector and the public administration identifying the emerging activities that can benefit the most from public intervention (Foray, Citation2015, Citation2018; Foray et al., Citation2009; Foray & Goenaga, Citation2013). Through the entrepreneurial discovery process, the agents recognize new opportunities for socio-economic development, become aware of their capacity to engage in new activities, make themselves capable to articulate them into concrete actions and projects, and transmit this information to the policymakers.
It has been widely acknowledged that Smart Specialisation requires sophisticated multi-agent governance, something which could be problematic in certain regions. For instance, Aranguren et al. (Citation2019) document cases of lack of involvement of certain stakeholders within the regions, little coordination across regions and path dependency. These issues may undermine the implementation of Smart Specialisation as initially envisaged.
Due to the Smart Specialisation’s quick incorporation into actual policy, some scholars consider it as an ambitious experiment (Kuznetsov & Sabel, Citation2017; Morgan, Citation2017). More importantly for our purposes, there is a widespread need for an appraisal of its achievements (Gianelle et al., Citation2020), with calls for a technology-enabled approach to RIS3 policymaking in order to ensure its effectiveness.
In an increasingly complex, intertwined and uncertain world, policymakers responsible for the design and implementation of innovation policy need to base their decisions on well-informed projections about the future states of the world. In a highly experimental context such as innovation policy for Smart Specialisation, those projections are systematically incorporated in the policy logic of intervention and ought to be subsequently compared with actual outcomes and updated accordingly, in a continuous process of policy learning. Thus, the effective design and the implementation of the policy should rely crucially on the use of data and advanced computational capacities to simulate scenarios. However, how is it possible to conjugate information and communication technologies (ICTs) and modelling tools with the principles underlying RIS3? How can the former help policymakers with the ongoing and future implementation of RIS3 in EU regions?
In this paper we propose a novel approach for the ex-ante economic appraisal of the potential general equilibrium effects of the planned implementation of the Smart Specialisation policy. To do so, we focus on the R&I numerical targets declared in the multiannual planning documents governing the funding of Smart Specialisation strategies in the framework of European Cohesion Policy. This exercise gauges empirically the effects on the overall economy implied by the logic of intervention of the Smart Specialisation policy according to the interpretation and expectations of the policymakers as expressed in the planned targets.
We perform our analysis using the RHOMOLO model, which is a dynamic multi-regional computable general equilibrium (CGE) model developed by the Joint Research Centre (JRC) of the European Commission (Lecca et al., Citation2018). Although RHOMOLO has been extensively used for policy impact assessment, this is its first application for the specific purpose of evaluating RIS3. The model is particularly suitable for this objective, given that it can provide sector (10 NACE rev. 2 sectors) – region (NUTS-2) – and time-specific simulations to support the EU policies. In this paper, we focus on the implementation of RIS3 in Southern European regions (in Greece, Italy, Portugal and Spain) where policy intervention in support of innovation and research investment is most needed due to their relatively poor innovation performance compared with their Northern counterparts of the EU. The so-called North–South innovation divide (Veugelers, Citation2016) was, and still is, a topic of high policy interest and, to some extent, Smart Specialisation is expected to mitigate it.
We investigate the potential macroeconomic impact of the changes induced by the achievement of the targets established for the result indicators related to the Thematic Objective (TO) ‘Strengthening research, technological development and innovation’ (TO1) of the ERDF Operational Programmes (OPs) elaborated by the regional and national policymakers for the period 2014–20. Within the current European Cohesion Policy cycle, the ERDF TO1 budget is legally bound to finance national/regional RIS3, hence we assume that the target values attached to the ERDF TO1 result indicators provide a realistic representation of the policymakers’ expectations regarding the effects of the Smart Specialisation logic of intervention. This working assumption appears plausible also in light of the close scrutiny that the European Commission performed over the ERDF OPs and RIS3, as per Cohesion Policy regulations (European Union, Citation2013b, Art. 29). Despite that, it is possible for the targets to be overly ambitious, and this would imply an overoptimistic evaluation of their economic impact. We acknowledge this to be a limitation of our strategy and we think of our evidence as complementary to other alternative existing approaches to the ex-ante evaluation of Smart Specialisation.
Our analysis shows overall positive effects of the Smart Specialisation policy on all main economic indicators and sectors in the regions under scrutiny, with a peak in economic activity reached at the end of the ERDF financial period, when the policy objectives are fully accomplished. Our analysis offers what can be interpreted as an upper bound estimate of what could happen if the logic of intervention postulated in the ERDF OPs was fully reflected in the real world and the policymakers’ targets were achieved, thus quantifying the potential scope of the Smart Specialisation policy. We argue that ex-ante evaluations of the type we propose, albeit admittedly challenging from a technical point of view, should be more systematically used by policymakers in the design phase of Smart Specialisation strategies and R&I policies in general.
The remainder of the paper is organized as follows. The next section illustrates the Smart Specialisation approach in the context of European Cohesion Policy and advocates for the need of more systemic ex-ante impact assessments. The methodology and data section briefly describes the strategy used to estimate the macroeconomic effects of the achievement of the OPs targets related to R&I by illustrating separately the econometric set-up and the RHOMOLO modelling strategy. We then present the results of both parts of the analysis and, finally, conclude.
SMART SPECIALISATION IN EU COHESION POLICY AND ITS IMPACT ASSESSMENT
European Cohesion Policy and the challenges for the impact assessment of RIS3
Smart Specialisation is an R&I policy approach originally meant to tackle the transatlantic productivity gap (Van Ark et al., Citation2008). In its later and most widely accepted formulation, it advocates concentration of R&I funding on a limited number of emerging activities to avoid small-scale initiatives incapable of exploiting the full benefits of agglomeration economies (Foray et al., Citation2009; Foray & Van Ark, Citation2007). Smart Specialisation became a fundamental component of the logic of intervention of European Cohesion Policy for the 2014–20 financial cycle to provide principles to guide R&I investments.
The effectiveness of the entrepreneurial discovery process, one of the key elements of Smart Specialisation, has been analysed in light of the actual experiences of the EU regions during the current programming period (which started in 2014). According to Aranguren et al. (Citation2019), in many cases governments had a predominant role over the rest of the regional actors, therefore somewhat undermining the multilateral nature of the process. The same authors warn about path dependency and old innovation policies affecting the design of RIS3, but at the same time they admit that actual changes are possible and have been documented in a number of cases. Capello and Kroll (Citation2016) also warn against other potential bottlenecks besides path dependency and governance issues: some regions may lack either the preconditions necessary for innovation, or the capacity to identify new activities. Similarly to Aranguren et al. (Citation2019), Capello and Kroll (Citation2016) as well as Kroll (Citation2015) and Trippl et al. (Citation2020), claim that RIS3 has produced a wide range of positive outcomes in different types of regions. Despite these positive results of the policy, the limitations of RIS3 should be borne in mind when studying its impact on the EU economies.
Formally, EU regions and countries must adopt a national or regional RIS3 guiding R&I investment according to the Smart Specialisation principles. This is an ex-ante conditionality, without which regions are not eligible to receive the ERDF TO1 funds (European Union, Citation2013a, Citation2013b). RIS3s are defined as:
the national or regional innovation strategies which set priorities in order to build competitive advantage by developing and matching research and innovation own strengths to business needs in order to address emerging opportunities and market developments in a coherent manner, while avoiding duplication and fragmentation of efforts.
(European Union, Citation2013b, Art. 2)
Notably, each of the objectives of the ERDF OPs must be linked to a set of result indicators measuring the intended change in a number of dimensions of well-being and economic progress (European Commission, Citation2015; European Union, Citation2013a). For each result indicator, the OPs must provide a baseline value using the latest available data, and a 2023 target value. Under the ERDF, the choice of the most appropriate result indicators and suitable targets is left to the national and regional administrations. The set of result indicators linked to the ERDF TO1 should capture the socio-economic effects of the Smart Specialisation policy. More precisely, the target values attached to those indicators represent the policymakers’ expectations regarding the effects of the Smart Specialisation logic of intervention.
Although the ultimate objective of Smart Specialisation is to maximize the positive impact of R&I on growth and job creation, no specific methodologies exist to evaluate the expected effect of the RIS3 implementation in European regions. This is possibly due to the unresolved conceptual issues of the policy (Foray et al., Citation2011) as well as to the need for extending existing economic impact assessment models in order to integrate new dimensions related to Smart Specialisation (Varga et al., Citation2020a). In addition, in most cases it appears difficult to identify clearly the RIS3 specific objectives to be measured through definite indicators, and to identify the intervention areas and the target populations that the policy is meant to affect. This is also reflected in some authors’ criticism of Smart Specialisation (Balland et al., Citation2019; Santoalha, Citation2019).
For instance, the priority areas identified in the RIS3 documents are often very broad, covering large portions of the economic system, with policy measures simultaneously addressing several priorities at once (D’Adda et al., Citation2019; Gianelle et al., Citation2020; Iacobucci & Guzzini, Citation2016). This makes it difficult to select quantitative indicators to measure the specific results that the EU regions expect to achieve by implementing the policy. Although more than one decade ago David et al. (Citation2009) stressed the importance of shifting the Smart Specialisation discussions from policy conceptualization to empirical evidence; this remains an unresolved issue.
Smart Specialisation impact assessment tools: modelling, ICTs and others
The methodologies and attempts to carry out impact assessments of the RIS3 of European regions have been scant so far. This may seem surprising considering the importance attached to these strategies in the EU policy discourse, as well as the increasing amount of resources and funding allocated to those same strategies. For instance, the share of EU Structural Funds dedicated to innovation-related policy measures increased ‘from just 8% of total regional policy expenditure in the 1988–1994 programming period … to nearer a third of the total in the 2014–2020 period’ (Morgan, Citation2017, p. 569).
Some notable exceptions include the work done by the European Committee of the Regions (Citation2017) with the European Observation Network for Territorial Development and Cohesion (ESPON) Territorial Impact Assessment (TIA) tool used to evaluate the expected impact of the implementation of RIS3 in European regions. This goes beyond a simple economic impact assessment because it considers different regional dimensions that range from the economy to governance, including also environmental and societal aspects. This ICT tool provided and managed by ESPON combines qualitative expert judgments on the potential impact of RIS3 on specific variables in each region with data on the sensitivity of regions to these indicators.
The outcome of this exercise is a set of maps that use a qualitative scale to show the potential (and expected) impact of RIS3 implementation in the EU at the NUTS-3 level. The fact that experts’ subjective judgment is used as an input because the analysis makes it challenging to update the primary data and, therefore, the results. Another limitation of this approach lies in the limited insights provided on the mechanisms through which RIS3 influences specific regional dimensions such as economic development, although the latter is admittedly a difficult dimension to capture with modelling tools.
More quantitative-oriented approaches based on indicators embedding certain orienting principles for Smart Specialisation have the potential of complementing the results produced by the TIA analysis. For instance, Rigby et al. (Citation2019) build on the Smart Specialisation framework proposed by Balland et al. (Citation2019) and use patent data statistics and econometric methods to investigate whether the principles of technological relatedness and complexity lead to gross domestic product (GDP) growth and employment creation in a set of EU cities. The use of quantitative data in this context is commendable, although in this case it comes at the cost of ignoring certain dimensions of Smart Specialisation, which is not just about patent-based knowledge because it deals with a wide spectrum of regional capabilities. Szerb et al. (Citation2020) try to overcome this limitation by using the Regional Entrepreneurship and Development Index (REDI) to identify the areas and priorities to be targeted based on the specific characteristics of the EU regions devising Smart Specialisation strategies. According to the authors, the REDI could accommodate some caveats of the policy such as the measurement of the entrepreneurship ecosystem of the regions and their potential institutional weaknesses.
In order to evaluate the potential macroeconomic effects of Smart Specialisation-like policies, Varga et al. (Citation2020a, Citation2020b) adopt a general equilibrium modelling perspective to study the effects of entrepreneurship and integration in knowledge collaboration networks (measured by regional participation in EU Framework Program network) on gross value added. The authors argue for the need of using tools accounting for the regional dimension of the RIS3 policy, for the capital and labour mobility, as well as for the existence of several sectors in the economy. Sebestyén and Varga (Citation2019) offer a different but related piece of research adopting a modelling approach to study a specific dimension of Smart Specialisation, namely knowledge networks.
These approaches are flexible because they allow the investigation of the impact assessment of any dimension potentially relevant for Smart Specialisation, but they come with two main limitations. First, the definition of the orienting principles may be controversial because they may not fit the strategies of all regions. For instance, unrelated diversification, in addition to related diversification, might be important for processes structural transformation in the scope of RIS3 (Asheim Citation2019; Hassink & Gong, Citation2019). The second drawback of these approaches is related to measurement issues: it is difficult to reach a consensus about the most adequate indicators, assuming that the orienting principles are accepted by regions. For instance, although it might be accepted that regions should develop more complex activities (Balland et al., Citation2019), Broekel (Citation2019) points out that there is no agreement on how to measure complexity. Since most regions do not have targets expressed with indicators embedding and measuring relevant RIS3 principles such as relatedness and complexity, it would be necessary to simulate different possible targets for each region. However, there is no guarantee that the targets used to simulate such counterfactual scenarios would mirror the expectations of the regions both in terms of measurement (i.e., indicators adopted) and targets (i.e., objectives assumed for such indicators).
The examples of impact assessments discussed above confirm that the evaluation of the economic impact of RIS3 has gained increasing interest in the recent years, though a wide variety of methods, reasoning and orienting principles have been used in the literature. Not surprisingly, ICTs and modelling tools have been vitally important for these developments. Our approach takes advantage of some of the recommendations made by Varga et al. (Citation2020a, Citation2020b) on the need for multiregional assessments, and it can be seen as both an ex-ante evaluation of the potential effects of the policy and a measurement of the degree of ambition of the targets set by the policymakers in charge of devising the various regional Smart Specialisation policies. Thus, it could effectively support policy decisions in the EU by accounting for the specificities and expectations of each region regarding the policy. We see it as a valuable addition to the methods developed by the authors mentioned above.
Our study of the impact of RIS3: combining modelling tools and policymakers’ expectations
In this paper we investigate the potential macroeconomic impacts of the changes induced by the achievement of the research and development (R&D) targets established for the result indicators related to the ERDF TO1 funding stream. In order to do so, we study the targets expressed in terms of shares of R&D personnel from the OPs of the regions under scrutiny for the period 2014–20. This indicates the regions’ expectations regarding their capacity to improve the innovation performance of the economy.
We choose specifically this indicator because R&D-dedicated personnel increases the R&D orientation of an organization, ceteris paribus, with likely repercussions on growth potential both in the short and long runs.Footnote1 Moreover, the use of R&D personnel data allows us to cover a larger sample of regions and for a longer time span than other ERDF-TO1 result indicators would allow us to cover. This indicator is also convenient because data on R&D personnel are available from official statistics (Eurostat) for all the regions considered in our sample, which makes the analysis more transparent and replicable. This does not mean that other ERDF TO1 targets are not relevant for RIS3. However, as explained above, the R&D personnel dimension of RIS3 seems both adequate and feasible for the RIS3 impact assessment proposed here. One obvious limitation of this exercise is that it only reflects the R&D personnel dimension of RIS3. Nevertheless, depending on data availability, our approach can be replicable using other variables dealing with other relevant dimensions of RIS3.Footnote2
By introducing the policymaker outlook in the scenario analysis of the RHOMOLO model, we gauge the effects that the EU regions expect to achieve by following the implementation of RIS3. Differently from other types of RIS3 impact assessments, our approach does not deal with the specific strategic choices made by policymakers, in the sense that we do not impose or test principles such as relatedness, complexity or entrepreneurship as objectives of a Smart Specialisation process. Rather, we evaluate the macroeconomic impacts of the achievement of the specific targets that the regions expect to achieve (and to which they are committed).
This is both an advantage and a limitation of our analysis. On the one hand, we use the objectives that are defined by local policymakers based on their expectations arising from their specific knowledge of their regions, which should be influenced by the entrepreneurial discovery process explained above. It is likely that these expectations embed and reflect the principles underlying a sound RIS3: drafting, discussing and approving an OP is a long iterative process involving various different actors (regional and national ones, as well as the European Commission), which reduces the likelihood of biased standpoints or misinterpretations.
On the other hand, considering the complexity of the policymaking process at regional level, as well as the extent to which it depends on specific local contexts (Morisson & Doussineau, Citation2019), the literature has anticipated several limitations to the implementation of well-functioning RIS3 (Aranguren et al., Citation2019; Capello & Kroll, Citation2016; Kleibrink et al., Citation2016; Kroll, Citation2015; McCann & Ortega-Argilés, Citation2016). However, existing evidence is mixed and the literature reports cases of regions who have been successful in implementing and governing RIS3 (Aranguren et al., Citation2019; Trippl et al., Citation2020). Despite that, one important caveat of our analysis is the following: since we do not investigate the process leading to the setting of the OP targets, it is not possible to guarantee the quality and consistency of this process in every region. Moreover, our analysis does not make predictions on the likelihood of the achievement of those targets.
Another main limitation of our strategy is that we are unable to include in our analysis other potentially relevant objectives of RIS3 that are not included in the OPs documents. This is because dimensions such as relatedness and complexity (Balland et al., Citation2019), and regional entrepreneurship (Varga et al., Citation2020a) are not included in the regional OPs documents. Thus, it is impossible to know the expectations of regional policymakers regarding all these RIS3 dimensions (as explained in the previous section). In this sense, our analysis can be seen as complementary to the type of analyses proposed by Szerb et al. (Citation2020) and Rigby et al. (Citation2019), as well the framework introduced by Balland et al. (Citation2019). These works investigate and discuss the importance of regional entrepreneurship (Szerb et al., Citation2020), and relatedness and complexity (Balland et al., Citation2019; Rigby et al., Citation2019). Taken together, all these analyses can provide a more complete picture of the Smart Specialisation processes implemented in the EU and of their potential macroeconomic effects.
Our approach allows us to evaluate the macroeconomic impact of reaching the R&D personnel targets contained in the OPs. Considering the spirit of our impact assessment and the available data, the main objective of our approach is not to identify economic sectors and industries that benefit from the increase of the R&D personnel in the region, or whether those sectors are in line with the Smart Specialisation priorities defined in the OPs. The main reason for this is that the sectoral disaggregation of the model does not allow us to investigate the sectoral specialization patterns of the regions.
With all the caveats mentioned previously, we assume that the target values attached to the ERDF TO1 result indicators provide a realistic representation of the policymakers’ expectations regarding one of the results they expect to achieve through the implementation of a sound RIS3. The implicit assumptions in our exercise are that RIS3s truly reflect the Smart Specialisation principles, and that the policymakers and stakeholders implement the policy in a consistent way. Thus, we simulate what would be the effect of improvements in R&D personnel allocated to economic activities defined according to a sound and well-implemented entrepreneurial discovery processes. Putting it simply, we assume that the targets set in the ERDF OPs for TO1 can be achieved by following closely the Smart Specialisation logic of intervention, that is, through support granted selectively to priority areas identified through an entrepreneurial process of discovery.
This assumption may be seen as controversial, given the documented cases of regions lagging behind in terms of correct implementation of the principles standing behind Smart Specialisation, especially in Southern and Eastern Europe (Aranguren et al., Citation2019; Kroll, Citation2017). However, examples of good practice have been put forward by those same authors highlighting the potential problems related to the policy implementation, as well as by others. For example, according to Trippl et al. (Citation2020, pp. 7–8):
Smart specialization has triggered a break with past top-down practices. All regions mobilized non-policy stakeholders … in the strategy development phase’, and ‘the adoption of S3 has triggered learning processes and has supported efforts of RIS building. … Thus, S3 has triggered institutional change processes.
Similarly to Varga et al. (Citation2020a), our approach relies strongly on modelling. However, our methodology for impact assessment differs from theirs for four main reasons. First, on the econometric side, we estimate the R&I effects on productivity using a stochastic frontier approach instead of the residuals of an aggregate production function. Second, Varga et al. (Citation2020a) combine simulations using a dynamic macroeconomic model at country level and a regional spatial computable general equilibrium model, iterating until the solutions of the two models converge. In our case, we are able to perform the simulations in a more consistent way by using solely a spatial computable general equilibrium model defined over the EU NUTS-2 regions. Finally, our policy simulations are based on achieving the targets established in the OPs, while Varga et al. (Citation2020a) simulate an increase in the number of cooperative projects without any specific actual policy target.
METHODOLOGY AND DATA
We analyse a scenario in which we assume that the Greek, Italian, Portuguese and Spanish regions for which appropriate data are available achieve their ERDF TO1 targets in terms of R&D personnel by 2023. The numerical targets contained in the regional OPs are first translated into productivity improvements thanks to an econometric model. In particular, we use a stochastic frontier approach to estimate the effect of changes in R&D personnel on regional technical inefficiency. Then those productivity improvements are introduced into the RHOMOLO model in order to simulate their general equilibrium effects on GDP, employment and other macroeconomic variables. The model covers all EU regions at the NUTS-2 level, which allows for geographical disaggregation of countrywide policy impacts and also for evaluation of policies implemented at regional level (for a description of the model, see Appendix A in the supplemental data online).
Due to the high R&I content of the policy intervention, productivity improvements are assumed to last beyond the end of the policy programming period. Therefore, we consider the policy-induced productivity improvements to be maintained, although at a decreasing rate, even in the absence of continuous policy implementation/spending of the funds.
Step 1: Estimation the link between R&D personnel and technical inefficiency
The technical efficiency of a firm or a region is not directly observed. Stochastic frontier analysis (SFA) is a parametric technique used to estimate the parameters of the production technologies and those related to the firm’s inefficiency (Kumbhakar & Lovell, Citation2000; Orea, Citation2020). Although initially developed to measure firm’s inefficiency, SFA has also been applied to regional data. For instance, Ramajo and Hewings (Citation2017) use SFA to analyse regional production efficiency in Western European regions.
For our analysis, we estimate a panel data stochastic frontier model with output-oriented technical inefficiency (Greene, Citation2005). The model is expressed as follows:
(1)
(1) where
is the gross value added for region
at time
;
is the capital stock;
is the employment stock;
are region-specific fixed effects;
is the inefficiency term; and
is a random noise component that affects the production process.
The inefficiency term captures the difference between the maximum potential output that can be achieved given the technological frontier, and the observed output. The stochastic frontier model estimates both the parameters of the production function,
and
, and the inefficiency of each observation.
Regions operate under different conditions that might explain the differences in the inefficiencies of the production processes. Regional R&D capability is one of the factors that can explain those differences. We can express this as follows:
(2)
(2) where
is the variance of the inefficiency term
;
is the log of R&D personnel in the region;
and
are the parameters to be estimated; and
is a region-specific fixed-effect. Other knowledge input variables – such as investment in R&D and human capital – may also affect the region’s efficiency. However, these variables are highly correlated with R&D personnel and their inclusion would lead to collinearity in the estimation. The inclusion of the region fixed effects reduces the possible omitted variable bias of other regional variables that might affect regional inefficiency.
Both equations (1) and (2) are estimated in a single-step procedure to avoid bias in the estimation of the inefficiency (Battese & Coelli, Citation1995; Wang & Schmidt, Citation2002). We use a balanced panel of observations that includes all Greek, Italian, Portuguese and Spanish regions for which Eurostat data are available. We use annual observations that cover 60 regions over the period 2000–15.Footnote3 We collect data on gross value added, gross fixed capital formation, employment and R&D personnel. Regional capital stocks are constructed using the perpetual inventory method: we use data on gross fixed capital formation as a proxy of investment and we assume a depreciation rate of 0.15.
With the estimated parameters of model (1) and the observed values of the variables, we can estimate the technical efficiency level of all regions, which is the main interest of our stochastic frontier approach. By adjusting the value of the R&D personnel variable to the targets of the OPs, we can use the estimated model to predict the new levels of technical efficiency.
Notably, in contrast to the growth accounting literature in which total factor productivity (TFP) is estimated as the residual of an aggregate production function and might potentially include noise, our approach separates the efficiency term from the noise term.Footnote4
Step 2: The macroeconomic impact of the efficiency gains implied by the RIS3 policymakers’ expectations
The spatial CGE model RHOMOLO allows for a geographical disaggregation of countrywide policy impacts and for the evaluation of EU regional policies. General equilibrium models such as RHOMOLO are used to uncover the economic mechanisms leading an economic system to a new equilibrium after the introduction of a shock, which is typically policy driven. The simulation results can help to identify the territories where the benefits or losses are concentrated, and permit one to gauge the importance of both the direct effects of policy interventions and of their spillover effects. This analysis can be used as guidance to identify priority areas for investment and policy interventions and can provide a basis for comparing net welfare benefits with prospective investment costs. The RHOMOLO model is routinely used for ex-ante impact assessments of European policies (e.g., Christensen et al., Citation2019) and it has also been used for a number of other applications such as migration studies (Di Comite et al., Citation2018; Kancs & Lecca, Citation2018) and the analysis of spillover effects of demand-side shocks (Lecca et al., Citation2020).
RHOMOLO is calibrated using data organized in a multiregional system of social accounting matrixes (SAMs) of EU NUTS-2 regions disaggregated in 10 economic sectorsFootnote5 for 2013. All regions are interconnected via trade and production factor flows. Trade is modelled following Armington’s (Citation1969) approach. The EU regions are treated as small, open economies that accept non-EU prices as given, consistently with the regional scope of the model. Households, governments and industries (sectors) consume goods and services. The expectations of economic agents are assumed to be myopic because they optimize within a one-year period, and the model is solved recursively year by year. A consequence of the myopic expectations is that within the recursive framework, the policy shocks act as surprise announcements of policy changes, which can result in steep economic adjustment paths. For this particular exercise, the model was run assuming perfect competition, imperfect factor mobility, return-optimizing investments, and a labour market governed by a wage curve (for more details, see Lecca et al., Citation2018). RHOMOLO has a flexible structure, which permits one to switch between different specifications of cost functions. In accordance with the Cobb–Douglas specification of the econometric model, a Cobb–Douglas production function has been used in RHOMOLO for this exercise rather than a CES one.
Following the econometric strategy described in the previous section, the second step of our analysis involves simulating in the RHOMOLO model the macroeconomic impact of achieving the R&D personnel targets. We only include in the analysis those regions in Greece, Italy, Portugal and Spain whose OPs contain TO1 targets expressed in terms of R&D personnel (23 regions in total).Footnote6 The impact of TFP gains on selected macroeconomic variables (such as GDP, employment, imports, etc.) is presented as percentage deviations from the baseline scenario in which regions do not implement any R&I policy.
As the data collected from the ERDF OPs for the reference year diverge from Eurostat regional statistics for the same year (for reference values, see Appendix C in the supplemental data online), we recomputed the targets of the regions departing from the reference value of the Eurostat regional statistics for each indicator.Footnote7 In order to do so, we assume that between 2013 and 2023 the selected indicators for each region grow at the same rate as foreseen by policymakers due to the implementation of RIS3. Thus, the growth rates anticipated by the policymakers for each indicator in each region are used to revise the levels for the regional targets (when we depart from the reference value of the Eurostat regional statistics for each indicator). In the ERDF OPs, targets are expressed in three different ways: R&D personnel in the business enterprise sector; R&D personnel excluding the business enterprise sector; or as total R&D personnel. We converted all targets to their equivalent in terms total R&D personnel in order to homogenize the data for our analysis. Those updated targets, based on Eurostat regional statistics and on the percentage changes anticipated by policymakers for TO1 result indicators, are presented in .
Table 1. Research and development (R&D) personnel targets and estimated total factor productivity (TFP) shocks.
RESULTS
Econometric results
The estimation results of models (1) and (2) are presented in . Columns (I) and (II) are estimated as a pool of observations, ignoring the unobserved heterogeneity across regions, while columns (III) and (IV) correspond to the Greene (Citation2005) true fixed-effects model. Columns (II) and (IV) include R&D personnel as an exogenous determinant of regional inefficiency.
Table 2. Stochastic frontier regression results.
The estimates indicate that both capital and labour positively determine the production frontier at statistically significant levels. In all models, the sum of the estimated coefficients for capital and labour is statistically equal to 1, revealing the prevalence of constant returns to scale in production. As for model (2), and according to our expectations, an increase in R&D personnel is negatively associated with technical inefficiency, which means that it is positively associated with improvements in technical efficiency.
We take this into account and assume that efficiency gains due to an increase in R&D personnel are equivalent to a positive shock on TFP. We use the estimation results of model (IV) – the full model with fixed effects and inefficiency determinants – to compute the technical inefficiency (and thus the TFP levels) for the given target value of the indicators (). This allows us to translate the regional achievements expressed in terms of result indicators of R&D personnel into TFP shocks in RHOMOLO. reports the estimated cumulative TFP change in each region in 2023 (that is, when regions achieve the target in terms of R&D personnel expected by policymakers as consequence of the implementation of RIS3). According to the empirical estimates and the policymakers’ targets, the biggest TFP improvements are supposed to happen in Extremadura (ES43), Emilia-Romagna (ITH5), Western Macedonia (EL53), Calabria (ITF6) and Centro (PT16). Since the RHOMOLO model is calibrated using 2013 data, the achievement of the targets is assumed to start in 2014 and be completed by the end of the programming period in 2023. Thus, in order to plug these TFP improvements into the model, we smooth the shocks over time: between 2013 and 2023 we assume that yearly improvements in technical efficiency are gradual (for more details, see Appendix D in the supplemental data online).
Table 3. Estimated total factor productivity (TFP) shocks.
Modelling results
This section illustrates the macroeconomic effects of the simulated achievement of the ERDF TO1 targets in terms of R&D personnel increase in the 23 regions of Southern Europe under analysis (three regions of Greece; eight regions of Italy; five regions of Portugal; and seven regions of Spain). All the results are presented as percentage deviations of selected variables from their baseline values that represent the ‘business as usual’ evolution of the economies in the absence of policy perturbations. reports the evolution of GDP, household consumption, imports and exports, employment, and consumer price index (CPI) for all the regions included in the analysis. contains the region-specific results for the same variables up to the end of the programming period in 2023, expressed as cumulative changes. The first column (labelled ‘TFP shock’) also reports the cumulative TFP shock in order to facilitate comprehension, as there is a clear positive correlation between the degree of ambition of the regional policymakers and the expected expansion of GDP and competitiveness gains.
Figure 1. Macroeconomic impacts of Thematic Objective 1 (TO1) targets’ achievement in the 23 analysed regions, percentage deviations from the baseline.
Source: Computer simulations with the RHOMOLO model.
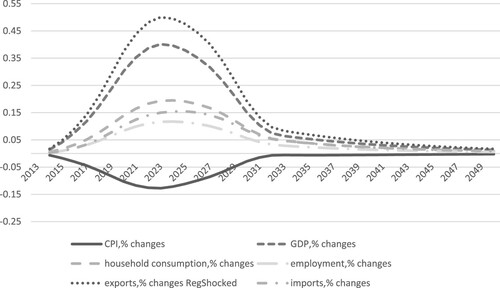
Table 4. Macroeconomic impacts of Thematic Objective 1 (TO1) targets’ achievement in the 23 analysed regions, percentage deviations from the baseline projections (cumulative changes 2014–23).
TFP improvements permit one to produce more output with the same amounts of labour and capital, thus increasing regional competitiveness with positive effects on exports. Given that the rental rate of a factor is equal to its marginal product, the decreased demand of labour and capital per unit of output rises both wages and the rate of return of capital, with a positive impact on household income. Overall, the strength of the direct policy impacts depends on how ambitious are the regional R&D targets, which in turn determine the intensity of the TFP shocks. Due to the high innovation content of the policy under scrutiny, productivity improvements are assumed to last beyond the end of the policy funding period, although their effects are assumed to decline gradually over time.
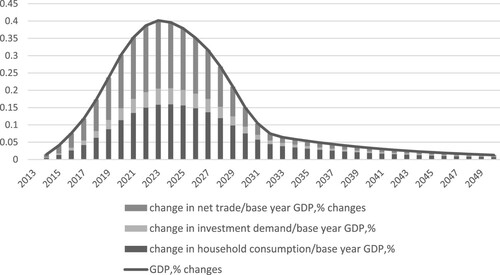
Not surprisingly, the achievement of regional targets related to the ERDF TO1 has a positive impact on all economic indicators in the selected regions because it stems from TFP improvements in all sectors. The peak in economic activity is achieved in 2023 when the policy objectives are fully accomplished. In terms of demand components determining the positive impact on GDP, suggests that both household consumption and net trade explain most of the positive effects of achieving the policy objectives (public consumption is kept fixed in the model for the closure of the model). The role of trade can be explained as follows: since policy-driven TFP improvements decrease expenditures on labour and capital per unit of output, producers gain comparative advantages in terms of pricing for the increased competitiveness of their exports, thus bringing about sizable net trade advantages in the selected regions. Smaller contributions come from household consumption and investments.
Figure 2. Gross domestic product (GDP) decomposition by demand components in the 23 analysed regions, percentage deviations from the baseline.
Source: Computer simulations with the RHOMOLO model.
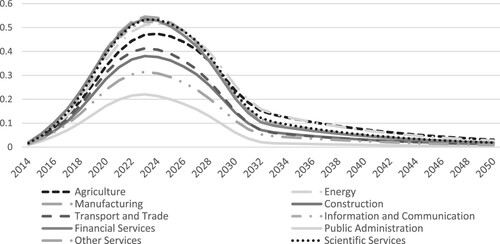
The cumulative sectoral impacts of achieving the OPs TO1 targets in the selected regions of Greece, Italy, Portugal and Spain are illustrated in . All sectors in the selected regions benefit from the achievements of ERDF TO1 R&D personnel targets. Due to the accumulation of direct policy intervention and price and demand effects, the manufacturing, scientific and financial sectors experience the most pronounced growth.
Figure 3. Sectoral impacts of TO1 targets’ achievement in the 23 analysed regions, percentage deviations from the baseline.
Source: Computer simulations with RHOMOLO model.
CONCLUSIONS
In this paper we use a general equilibrium model to evaluate the potential macroeconomic effects of the achievement of the TO1 R&D personnel targets contained in the ERDF OPs from a group of NUTS-2 regions in Greece, Italy, Portugal and Spain. These targets are considered to reflect the policymakers’ expectations following the implementation of RIS3, according to the Smart Specialisation logic of intervention. Thus, this study evaluates the potential effects that policymakers expect by the end of the funding period.
The model simulations show overall positive effects of the Smart Specialisation policy on all the main economic indicators and sectors in the regions under scrutiny, where a peak in the economic activity is reached at the end of the ERDF financial period, when the policy objectives are fully accomplished. One of the limitations of our analysis is that it does not evaluate the likelihood of the policy targets to be met. On the other hand, it offers an upper bound estimate of what could happen if the policy intervention is fully accomplished in the group of regions considered in the exercise, according to the expectations of the stakeholders involved in devising the Smart Specialisation policy.
Regional economics and (evolutionary) economic geography scholars have developed ‘some of the smart specialization debates’ main notions while at the same time being more consciously sensitive to the potential diversity of regional contexts’ (Kroll, Citation2015, p. 2080). In this vein, on the one hand, and compared with other ex-ante policy impact assessments, ours has the important advantage of evaluating the region-specific policy objectives made by the local policymakers, respecting the place-based principle of Smart Specialisation as a regional innovation policy. However, one potential shortcoming of a general equilibrium approach such as ours is that it has limited capacity to capture some of the evolutionary features of the Smart Specialisation concept. This could be overcome by adopting a framework modelling regional economies as evolutionary systems, for example, with agent-based models. Also, we do not take into account the distributional dimension of the policy intervention over specific sectors. This is part of the authors’ future research agenda.
We claim that ex-ante evaluations of the type we propose, albeit admittedly challenging from a technical point of view, should be more systematically used by policymakers in the design phase of Smart Specialisation strategies and R&I policies in general. Modelling tools are an essential step towards a broader use of ICT solutions to support the development of sound RIS3s and to facilitate the establishment of a virtuous policy learning cycle. However, this sort of impact assessment practices hinges crucially on the existence of a wide variety of adequate indicators that embed the most relevant principles and dimensions of RIS3. As we discussed in this article, the systematic collection of such data for most of EU regions is still limited. Given the existing data available, we propose an approach illustrating how regional OP targets may be used to evaluate the expected impact of a specific dimension of RIS3.
Given that RIS3 is an EU-level policy, it would be important that the EU authorities, in close cooperation with the regional authorities, define some common objectives applicable to all regions, or at least to groups of regions that share common characteristics. Furthermore, EU authorities should provide official statistics on most of the variables that regions adopt to measure the objectives they propose in the OPs. Otherwise, in future it will remain challenging to implement a systematic comparative assessment of different dimensions underlying RIS3 of European regions.
To conclude, we think that there is great potential in the use of macroeconomic models for the ex-ante evaluation of innovation policies such as Smart Specialisation. There are some crucial elements to consider in order to develop meaningful models leading to estimations that can be a realistic benchmark against which to compare the reality of the intervention once data are available. The evaluator needs first of all a clear comprehension of the logic of intervention of Smart Specialisation, both in general terms and with reference to the specific situation of the countries/regions under scrutiny. Such an understanding should be reflected in the definition of the objectives and related socio-economic indicators that will be evaluated. Finally, the evaluator should make explicit the assumptions underpinning the modelling choices and the possible limitations that may affect the results of the simulations. We provide in this paper an example of how to implement in practice such guidelines.
Supplemental Material
Download PDF (165.3 KB)DISCLOSURE STATEMENT
No potential conflict of interest was reported by the authors.
Notes
1. In comparison with other result indicators used in the ERDF-TO1, we believe the indicator we are using is more suitable for capturing structural changes in the economy. For instance, an alternative and complementary ERDF-TO1 indicator is the ‘birth rate of enterprises in knowledge-intensive sectors’. However, this is intrinsically prone to short-term fluctuations: the survival rate of firms is just close to 50% during the first five years (according to data such as those of the Bureau of Labor Statistics).
2. The impact evaluation approach we propose here can be applied to other policies for which we know the targets of policymakers. Thus, although we frame this approach here as one possible solution for RIS3 impact assessment, it can be applied for other policies and purposes beyond RIS3.
3. If data are missing or not available for a given region in a given year, we follow an imputation procedure (for details, see Appendix B in the supplemental data online).
4. Here we contribute to mitigate one of the limitations of Varga et al. (Citation2020a): although the authors estimate total factor productivity as the residual of an aggregate production function, they acknowledge it to be a shortcoming because it might lead to imprecise measures of productivity.
5. Agriculture, Forestry and Fishing (A), Energy Sector (B–D–E), Manufacturing (C), Construction (F), Trade and Transport (G–I), Information and Communication (J), Financial Activities (K–L), Scientific and Technical Activities (M–N), Public Services (O–Q) and Other Services (R–U).
6. The regions are the following: North Aegean (EL41), Western Macedonia (EL53), Central Greece (EL64), Piemonte (ITC1), Liguria (ITC3), Abruzzo (ITF1), Campania (ITF3), Calabria (ITF6), Sardegna (ITG2), Emilia-Romagna (ITH5), Toscana (ITI1), Norte (PT11), Algarve (PT15), Centro (PT16), Área Metropolitana de Lisboa (PT17), Alentejo (PT18), Principado de Asturias (ES12), Aragón (ES24), Castilla-La Mancha (ES42), Extremadura (ES43), Illes Balears (ES53), Región de Murcia (ES62) and Canarias (ES70).
7. This procedure seems more adequate than using ERDF OPs data, for two main reasons. First, the Eurostat regional statistics database is revised and updated more often than the ERDF OPs. Second, in ‘Step 1: Estimation the link between R&D personnel and technical inefficiency’ we also use Eurostat regional statistics in order to implement the econometric analysis.
REFERENCES
- Aranguren, M. J., Magro, E., Navarro, M., & Wilson, J. R. (2019). Governance of the territorial entrepreneurial discovery process: Looking under the bonnet of RIS3. Regional Studies, 53(4), 451–461. https://doi.org/10.1080/00343404.2018.1462484
- Armington, P. S. (1969). A theory of demand for products distinguished by place of production. Staff Papers – International Monetary Fund, 16(1), 159–178. https://doi.org/10.2307/3866403
- Asheim, B. (2019). Smart Specialisation, innovation policy and regional innovation systems: What about new path development in less innovative regions? Innovation: The European Journal of Social Science Research, 32(1), 8–25. https://doi.org/10.1080/13511610.2018.1491001
- Balland, P. A., Boschma, R., Crespo, J., & Rigby, D. (2019). Smart specialization policy in the EU: Relatedness, knowledge complexity and regional diversification. Regional Studies, 53(9), 1252–1268. https://doi.org/10.1080/00343404.2018.1437900
- Barca, F. (2009). An agenda for a reformed Cohesion Policy. A place-based approach to meeting European Union challenges and expectations. Independent report prepared at the request of Danuta Hübner, Commissioner for Regional Policy.
- Battese, G. E., & Coelli, T. J. (1995). A model for technical inefficiency effects in a stochastic frontier production function for panel data. Empirical Economics, 20(2), 325–332. https://doi.org/10.1007/BF01205442
- Broekel, T. (2019). Using structural diversity to measure the complexity of technologies. PLoS One, 14(5), 1–23. https://doi.org/10.1371/journal.pone.0216856
- Capello, R., & Kroll, H. (2016). From theory to practice in smart specialization strategy: Emerging limits and possible future trajectories. European Planning Studies, 24(8), 1393–1406. https://doi.org/10.1080/09654313.2016.1156058
- Christensen, M., Weiers, G., & Wolski, M. (2019). The 2019 assessment of the macroeconomic effects of the European fund for strategic investments with the RHOMOLO-EIB model. Investigaciones Regionales – Journal of Regional Research, 2019/3(45), 5–15.
- D’Adda, D., Guzzini, E., Iacobucci, D., & Palloni, R. (2019). Is Smart Specialisation strategy coherent with regional innovative capabilities? Regional Studies, 53(7), 1004–1016. https://doi.org/10.1080/00343404.2018.1523542
- David, P., Foray, D., & Hall, B. (2009). Measuring Smart Specialisation: The concept and the need for indicators. CEMI – the Chair of Economics and Management of Innovation.
- Di Comite, F., Kancs, D., & Lecca, P. (2018). Modeling agglomeration and dispersion in space: The role of labor migration, capital mobility and vertical linkages. Review of International Economics, 26(3), 555–577. https://doi.org/10.1111/roie.12313
- European Commission. (2015). The programming period 2014–2020: Guidance document on monitoring and evaluation. European Cohesion fund, European regional development fund. Concepts and recommendations. European Commission Directorate General for Regional and Urban Policy.
- European Committee of the Regions. (2017). Territorial impact assessment Smart Specialisation. Commission for Territorial Cohesion Policy and EU Budget.
- European Union. (2013a). Regulation (EU) no 1301/2013 of the European parliament and of the council of 17 December 2013 laying down common provisions on the European regional development fund, the European social fund, the Cohesion fund, the European agricultural fund for rural development and the European maritime and fisheries fund and laying down general provisions on the European regional development fund, the European social fund, the Cohesion fund and the European maritime and fisheries fund and repealing council regulation (EC) no 1083/2006.
- European Union. (2013b). Regulation (EU) no 1303/2013 of the European parliament and of the council of 17 December 2013 on the European regional development fund and on specific provisions concerning the investment for growth and jobs goal and repealing regulation (EC) no 1080/2006.
- Foray, D. (2015). Smart specialisation. Opportunities and challenges for regional innovation policy. Routledge.
- Foray, D. (2018). Smart specialization strategies as a case of mission-oriented policy – A case study on the emergence of new policy practices. Industrial and Corporate Change, 27(5), 817–832. https://doi.org/10.1093/icc/dty030
- Foray, D., David, P., & Hall, B. (2011). Smart Specialization – From academic idea to political instrument, the surprising career of a concept and the difficulties involved in its implementation (MTEI Working Paper). Management of Technology and Entrepreneurship Institute, Lausanne.
- Foray, D., David, P. A., & Hall, B. (2009). Smart specialisation – The concept (Knowledge for Growth Expert Group Policy Brief No. 9). European Commission.
- Foray, D., & Goenaga, X. (2013). The goals of Smart Specialisation (JRC Scientific and Policy Reports No. JRC82213).
- Foray, D., & Van Ark, B. (2007). Smart specialisation in a truly integrated research area is the key to attracting more R&D to Europe (Knowledge for Growth Expert Group Policy Brief No. 1). European Commission.
- Gianelle, C., Guzzo, F., & Mieszkowski, K. (2020). Smart Specialisation: what gets lost in translation from concept to practice? Regional Studies, 54(10), 1377–1388. https://doi.org/10.1080/00343404.2019.1607970
- Greene, W. (2005). Reconsidering heterogeneity in panel data estimators of the stochastic frontier model. Journal of Econometrics, 126(2), 269–303. https://doi.org/10.1016/j.jeconom.2004.05.003
- Hassink, R., & Gong, H. (2019). Six critical questions about smart specialization. European Planning Studies, 27(10), 2049–2065. https://doi.org/10.1080/09654313.2019.1650898
- Iacobucci, D., & Guzzini, E. (2016). Relatedness and connectivity in technological domains: Missing links in S3 design and implementation. European Planning Studies, 24(8), 1511–1526. https://doi.org/10.1080/09654313.2016.1170108
- Kancs, D., & Lecca, P. (2018). Long-term social, economic and fiscal effects of immigration into the EU: The role of the integration policy. The World Economy, 41(10), 2599–2630. https://doi.org/10.1111/twec.12637
- Kleibrink, A., Gianelle, C., & Doussineau, M. (2016). Monitoring innovation and territorial development in Europe: Emergent strategic management. European Planning Studies, 24(8), 1438–1458. https://doi.org/10.1080/09654313.2016.1181717
- Kroll, H. (2015). Efforts to implement smart specialization in practice – Leading unlike horses to the water. European Planning Studies, 23(10), 2079–2098. https://doi.org/10.1080/09654313.2014.1003036
- Kroll, H. (2017). The challenge of Smart Specialisation in less favoured regions (No. R1/2017). Arbeitspapiere Unternehmen und Region.
- Kumbhakar, S. C., & Lovell, C. A. (2000). Stochastic frontier analysis. Cambridge University Press.
- Kuznetsov, Y., & Sabel, C. (2017). Managing self-discovery: Diagnostic monitoring of a portfolio of projects and programs. In S. Radosevic, A. Curaj, R. Gheorghiu, L. Andreescu, & I. Wade (Eds.), Advances in the theory and practice of Smart Specialization (pp. 51–72). Academic Press.
- Lecca, P., Barbero, J., Christensen, M., Conte, A., Di Comite, F., Diaz-Lanchas, J., Diukanova, O., Mandras, G., Persyn, D., & Sakkas, S. (2018). RHOMOLO v3: A spatial modelling framework. Publications Office of the European Union.
- Lecca, P., Christensen, M., Conte, A., Mandras, G., & Salotti, S. (2020). Upward pressure on wages and the interregional trade spillover effects under demand-side shocks. Papers in Regional Science, 99(1), 165–182. https://doi.org/10.1111/pirs.12472
- McCann, P., & Ortega-Argilés, R. (2016). The early experience of Smart Specialization implementation in EU Cohesion Policy. European Planning Studies, 24(8), 1407–1427. https://doi.org/10.1080/09654313.2016.1166177
- Morgan, K. (2017). Nurturing novelty: Regional innovation policy in the age of Smart Specialization. Environment and Planning C: Politics and Space, 35(4), 569–583. https://doi.org/10.1177/0263774X16645106
- Morisson, A., & Doussineau, M. (2019). Regional innovation governance and place-based policies: Design, implementation and implications. Regional Studies, Regional Science, 6(1), 101–116. https://doi.org/10.1080/21681376.2019.1578257
- Orea, L. (2020). The measurement of firms’ efficiency using parametric techniques. In V. Charles, J. Aparicio, & J. Zhu (Eds.), Data science and productivity analytics. International series in operations research & management science (Vol. 290, pp. 161–199). Springer.
- Ramajo, J., & Hewings, G. J. D. (2017). Modeling regional productive performance using a spatial stochastic frontier approach: New evidence for Europe (1995–2007) (Unpublished Paper). http://www.real.illinois.edu/d-paper/16/16-T-2.pdf
- Rigby, D., Roesler, C., Kogler, D., Boschma, R., & Balland, P. A. (2019). Do EU regions benefit from smart specialization? Papers in Evolutionary Economic Geography #, 19, 31.
- Santoalha, A. (2019). New indicators of related diversification applied to smart specialization in European regions. Spatial Economic Analysis, 14(4), 404–424. https://doi.org/10.1080/17421772.2019.1584328
- Sebestyén, T., & Varga, A. (2019). Knowledge networks in regional development: An agent-based model and its application. Regional Studies, 53(9), 1333–1343. https://doi.org/10.1080/00343404.2019.1622663
- Szerb, L., Ortega-Argilés, R., Acs, Z. J., & Komlósi, É. (2020). Optimizing entrepreneurial development processes for smart specialization in the European Union. Papers in Regional Science, 99(5), 1413–1457.
- Trippl, M., Zukauskaite, E., & Healy, A. (2020). Shaping Smart Specialisation: The role of place-specific factors in advanced, intermediate and less-developed European regions. Regional Studies, 54(10), 1328–1340. https://doi.org/10.1080/00343404.2019.1582763
- Van Ark, B., O’Mahony, M., & Timmer, M. P. (2008). The productivity gap between Europe and the United States: Trends and causes. Journal of Economic Perspectives, 22(1), 25–44. https://doi.org/10.1257/jep.22.1.25
- Varga, A., Sebestyén, T., Szabó, N., & Szerb, L. (2020a). Estimating the economic impacts of knowledge network and entrepreneurship development in smart specialization policy. Regional Studies, 54(1), 48–59. https://doi.org/10.1080/00343404.2018.1527026
- Varga, A., Szabó, N., & Sebestyén, T. (2020b). Economic impact modelling of smart specialization policy: Which industries should prioritization target? Papers in Regional Science, 99(5), 1367–1388. https://doi.org/10.1111/pirs.12529
- Veugelers, R. (2016). The European Union’s growing innovation divide (Bruegel Policy Contribution No. 2016/08).
- Wang, H.-J., & Schmidt, P. (2002). One-step and two-step estimation of the effects of exogenous variables on technical efficiency levels. Journal of Productivity Analysis, 18(2), 129–144. https://doi.org/10.1023/A:1016565719882
