
 ?Mathematical formulae have been encoded as MathML and are displayed in this HTML version using MathJax in order to improve their display. Uncheck the box to turn MathJax off. This feature requires Javascript. Click on a formula to zoom.
ABSTRACT
Italy was unified in 1861. As part of the process of nation-building, a mandatory free-of-charge primary school system was established. Whereas the new school system greatly contributed to the modernization of the country, its initial design did not considerably reduce regional disparities in human capital, with Southern regions lagging behind. The paper studies the effects of the heterogeneous territorial diffusion of literacy during the post-unification period (1871–1911) on economic outcomes of Italian provinces 100 years later. We exploit the exogenous variations in the territorial spread in literacy rates arising from the gradual building and expansion of the railway network across provinces. We find evidence that provinces with a higher territorial diffusion of literacy in the post-unification period today have higher income per capita, lower unemployment and greater educational attainment.
KEYWORDS:
INTRODUCTION
This paper provides an empirical investigation of the causal effects of the heterogeneous territorial spread of human capital during the late 19th century on various economic outcomes today. The focus is on Italy, a country historically characterized by sizeable regional disparities.
Italy was unified in 1861. Immediately after the country’s unification, the Casati law established a mandatory and free-of-charge nationwide elementary school system. The evaluation of the Casati reform in the literature is mixed. On the one hand, there is agreement that the reform was overall effective in raising the basic educational level of the Italian population. Cipolla (Citation1969) documents that literacy rates in Italy doubled during 1871–1911 (from 31% to 62%). On the other hand, he also documents huge regional disparities. In 1871, for instance, Piedmont (Northern Italy) had literacy rates of 68%, while in Basilicata (Southern Italy) they reached just 12%. Similarly, Graff (Citation1987, pp. 299–301) notes that the 19th-century progress in human capital developments was ‘impressive, but regionally stratified’ and that ‘the educational opportunities spread far more rapidly in urban areas and in the north, thereby exacerbating the dualism of Italy’s economy’.
According to the historical literature, the ‘original sin’ of the Casati law was that the financing of the primary schooling system was left to the (often slim) budget of the municipalities (Zamagni, Citation1978). This did not take into account the very heterogeneous situation inherited from the past (Ciccarelli & Weisdorf, Citation2019) and the scarce financial resources of municipalities, especially in rural areas of the South where the career of primary school teachers was often discontinuous (De Fort, Citation2015) and literacy did not progress adequately. Important differences emerged between the functioning of the school system in the urban centres and in the countryside, with rural municipalities often isolated due to poor infrastructures. Policymakers finally acknowledged this partial failure (Zamagni, Citation1978). Indeed, the Daneo-Credaro Law of 1911 established that, with the exception of provincial capitals, the management and financing of the elementary school system, including the payment of the salary of the elementary school teachers, was taken on by the state (Cappelli & Vasta, Citation2020; De Fort, Citation1995).
The historical literature points to this late switch towards a centralized primary school system, as one of the causes for the insufficient development of human capital in some areas of the country during the half century following the unification. What we investigate here is whether this inadequate institutional design and the consequent uneven territorial diffusion of human capital produced long-lasting effects. Our story is not just that provinces with higher average literacy rates in the 19th century show a better economic performance today. Rather, we look at the 1871–1911 reduction in the gap between the literacy rates in the provincial capital city and that in the rest of the province. This distinction is among the pillars of the Daneo-Credaro reform of 1911 and represents a crucial discriminant in the territorial diffusion of human capital. As we will illustrate, the Northern regions were able to bridge this gap earlier than the Southern region, and thus were able to create a more uniform territory in terms of human capital relatively quickly. We will show that these regional differences in the territorial diffusion of basic educational levels during the late 19th century produced long-lasting effects on various regional current economic outcomes in Italy. The evidence presented in this paper should provide a useful guidance in understanding the historical roots and the assessment of the regional divide still characterizing the Italian case today.
From an empirical point of view, assessing the long-run economic effects of early literacy developments is challenging. A natural strategy is to examine the relationship between an indicator of the historical territorial diffusion of human capital and current economic outcomes across provinces in Italy. However, there are important shortcomings of such an exercise. First, there may be persistent omitted factors that affected the decision of being literate in each province that could independently influence the outcomes of interest. Second, it is also possible that literate people were attracted by locations with more growth potential. These concerns would cause the ordinary least squares (OLS) estimates to be biased. To overcome this problem, we use an identification strategy (based on an instrumental variables (IV) approach) that exploits the exogenous cross-province variation in the territorial spread of literary induced by the diffusion of the railway network (for a similar approach, see Sequeira et al., Citation2020). Indeed, during 1871–1911, the national railway network was completed. The resulting sizeable increase in accessibility and the diffusion of urban culture, through the mobility of people and circulation of ideas, penetrated the countryside at a different pace and the perception of the relevance for literacy was different in different places.
The remainder of the paper is structured as follows. The next section provides some economic background on the regional divide in Italy and a concise review of the related literature. The third section presents a new indicator of the territorial diffusion of literacy. The fourth section introduces the identification strategy, and in particular the accessibility measure tied to the diffusion of the railway network, and the validity of the instrument. The empirical results are illustrated in the fifth and sixth sections. Finally, the seventh section concludes.
ECONOMIC BACKGROUND AND RELATED LITERATURE
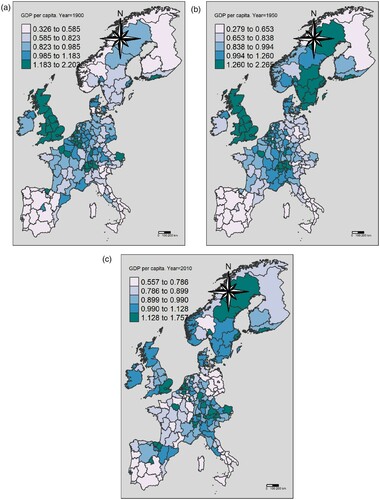
Over the course of the 20th century, the structure of the Italian economy changed radically. The role of agriculture, once predominant, is marginal today. The demographic transition completed in the 1980s. The population, once young and growing rapidly, is nowadays stagnating and ageing, and the only source of population growth is net immigration. Indeed, these long-term features are common to most Western countries. However, a persistent feature characterizes the Italian case: the enormous and long-lasting socioeconomic regional divide. While at the beginning of the 20th century the whole country lagged behind European Union (EU) regions in terms of per capita gross domestic product (GDP), over time the Italian North–South divide increased considerably (). To give an example, six out of 10 of the poorest regions of Western Europe in 2010 in terms of per capita GDP are in the Italian South.
Figure 1. Per capita gross domestic product (GDP) in selected European Union (EU) regions, 1900–2010: GDP per capita for (a) 1900; (b) 1950; and (c) 2010.
Note: The map illustrates the ratio of regional pcGDP to the EU average. Source: Authors’ elaboration on Roses and Wolf (Citation2019), a database that includes 173 NUTS-2 European regions.
The reasons behind the relative backwardness of the Italian South have been widely investigated and are often at the centre of the economic and policy debate (Federico et al., Citation2019, passim). In fact, the only historical period when the North–South income gap shrunk over the last century was the period 1950–70 (Felice, Citation2019). The prevailing literature attributes the positive performance of the South to heavy state intervention in terms of public investments. The capital endowment of the South in terms of infrastructures and industrial plants increased. However, this additional capital was concentrated in a few locations, and the potential stimulus to economic growth did not propagate to the entire South. The long-term effects of this forced industrialization were not sufficient to reduce significantly the deep economic gap between the North and the South.
Various scholars suggested that regional differences in the early accumulation of human capital are among the causes underlying the persistent regional divide. Felice (Citation2012) estimates convergence regression models for per capita GDP for Italian regions during 1891–2011 and discusses the relative role played by human and social capital. Bertola and Sestito (Citation2013) and Di Martino and Vasta (Citation2017) also follow a long-run approach and argue that poor human capital accumulation limited the development of high-tech industrial sectors, and represents one of the possible causes of underlying differentials in regional long-term developments. Diebolt and Hippe (Citation2019) extend the analysis to EU regions. They investigate the long-term effect of early human capital accumulation on innovation and inventive activity, and ultimately GDP. These contributions of the historical literature represented an important descriptive guidance to our analysis. However, they do not propose a way to identify long-term causal relations from human capital to economic development. We contribute to this literature by providing an empirical investigation of the causal effects of the territorial diffusion of human capital during the late 19th century in Italy on various economic outcomes today. As we will illustrate, we propose an IV strategy that explicitly discusses endogeneity issues and proposes a new instrument to address them.
This paper is also inspired by theoretical contributions of the regional economic literature in terms of innovation-prone and innovation-averse regions (Rodriguez-Pose, Citation1999), regional absorptive capacity (Caragliu & Nijkamp, Citation2012), and the social filter (Crescenzi & Rodriguez-Pose, Citation2012). Boschma (Citation1998) considers Italian regions and the rise of new industrial clusters since the 1950s to test the validity of the so-called window of locational opportunities (WLO), a theoretical spatial concept related to the long-term ability of regions to generate or apply new technologies. Gorin (Citation2017) focuses on European urban areas. He assumes that mobility and networks provide access to knowledge, but the proportion of accessible knowledge depends on absorptive capacity, and that the latter is positively related in turns with human capital. All these contributions investigate the set of territorial elements that favour or delay long-term development. A novel aspect of our approach is that we operationalize the important hints stemming from this literature by providing a new indicator of the territorial diffusion of literacy that focuses on the differences in early human capital accumulation between the major urban centres and the rest of the provincial territory, often constituted by rural areas.
Our paper also adds to the persistency literature by focusing on long-term regional effects of historical factors. In recent decades, an increasing number of scholars have analysed the possible persistent effects of past accumulation of human and social capital. Classical references include Guiso et al. (Citation2006), Becker and Woessmann (Citation2009) and Tabellini (Citation2010). Caicedo (Citation2019) uses historical data at the local level for Argentina, Brazil and Paraguay, and shows that in areas of former Jesuit presence educational attainment was higher and remains so today, after over two centuries. These educational differences, rooted in the late 18th century, have translated into incomes that are 10% higher today.
This literature attracts increasing interest, although it is not immune from criticism. Kelly (Citation2019), for example, examines 28 different regional persistence studies published in leading journals and finds that these studies do not adequately address spatial autocorrelation in residuals (adjacent observations are not truly independent of each other, but show a high dependence) raising doubts on the validity of the main results, at least on the reported standard errors of the estimates. Voth (Citation2020), however, discusses these criticisms and concludes that persistence is real. He notes that the presence of residual spatial autocorrelation is problematic for all empirical regional studies and is not specific for persistence studies. He also notes that nearly all of the papers considered by Kelly (Citation2019) address the issue of spatial autocorrelation in the most robust model specifications by using, for example, regional fixed effects, latitude–longitude interactions and clustered standard errors. As we will illustrate, we also address this issue in all steps of our analysis to ensure that any residual spatial autocorrelation is successfully removed.
THE HISTORICAL DIFFUSION OF LITERACY: A NEW TERRITORIAL INDICATOR
As argued in previous sections, the diffusion of literacy during the half-century after the unification of Italy was characterized by a sizeable difference between the capital cities and their hinterlands, especially in the South. In order to quantify this phenomenon, we used data from the population censuses to construct the following indicator:
computed for each province
(
) and each census year (
).Footnote1 Literacy rates are defined over the population aged six years and above (for details on the historical sources, see Appendix A in the supplemental data online). The underlying idea is that by monitoring the temporal evolution of the
variable, we are able to analyse the spatial diffusion of literacy at a fine level of disaggregation.Footnote2 documents the spatio-temporal evolution of
.Footnote3 For a given point in time, a low value of
indicates a (relatively) low value of literacy rates in the often rural ‘rest of the province’ area.Footnote4 A rise in
over time can be interpreted as a higher diffusion of human capital in the province. Thus, the indicator proposed here helps to capture the early formation of a homogeneous territory in terms of basic human capital formation that represents a crucial ingredient of the absorptive capacity of certain areas of the country. clearly points to a widespread diffusion of literacy, with average values increasing in the three macro areas. Large differences can be noticed, however, in the speed of reduction of the standard deviations, from rapidly in the North to moderate in the South.
Table 1. SpreadLit variable: descriptive statistics.
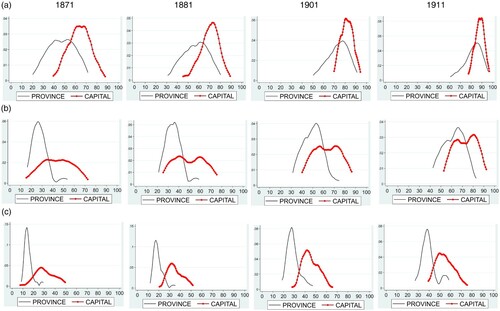
displays the kernel density estimates of the numerator (literacy rate in the whole province) and the denominator (literacy rate in the provincial capital) of . A shift to the right of all the distributions indicates a generalized increase of literacy during 1871–1911, in line with the diffusion of the national schooling system. However, regional stratification is impressive. Only in the North did the rise in literacy go along with a marked reduction in its territorial dispersion, in the cases of both whole provinces and capital cities. At the end of the sample period, a few years before the First World War, the overlap between the two curves is particularly pronounced, indicating a clear closure of the gap between literacy rate in the capital city and the rest of the province. A similar reduction of the gap does not emerge for the rest of the country. In the Centre, we observe just a little reduction of spatial dispersion, but also a tendency towards a bimodal distribution, suggesting polarization. In the South, there is very little overlap of the two density functions even at the end of the sample period.
Figure 2. Distribution of literacy rates in Italian provinces and provincial capital cities, by macro-areas, 1871, 1881, 1901 and 1911: (a) North; (b) Centre; and (c) South.
Note: The two curves represent the numerator and denominator of the SpreadLit variable. Literacy rates (on the x-axis, scale 0–100) are defined over the population aged six years and above.
Source: Authors’ elaboration on population census data.
THE IDENTIFICATION OF THE EFFECT OF THE TERRITORIAL DIFFUSION OF LITERACY
Estimating the long-run effects of literacy diffusion at the local level on current economic outcomes is challenging. It might not be the creation of a homogeneous territory in terms of human capital that induced economic development of an area, but rather the high growth potential of that area that has attracted skilled workers and favoured the formation of a homogeneous territory in terms of literacy. To address this endogeneity problem, we follow an IV approach exploiting the exogenous cross-province variation in induced by the building of the national railway network. We use a new measure of the accessibility of cities by railroad as a valid instrument to control for the endogeneity of
in a two-stage least squares (2SLS) procedure.
Accessibility measures
The accessibility of a node in a network can be defined as the inverse of the travel costs between the particular node and all other nodes in the network, weighted by the importance of each node.Footnote5 Following standard gravity models (Harris, Citation1954), we measure costs in time and weights by provincial population size. We follow Koopmans et al. (Citation2012) and define the index of accessibility for nodes in the Italian railway network as:
(1)
(1) where
indicates the accessibility of node
at time
;
is the population of
at time
;
is the average internal travel time in
at time
;
is the lowest travel time between nodes
and
at time
; and
is a distance–decay parameter. As in Koopmans et al. (Citation2012), we set the value of
= 1. The nodes (
and
) are all 69 Italian provincial city capitals. Total accessibility consists of two elements: the internal accessibility (within province
) and the external accessibility, defined as the sum of the travel times from province
to all other provinces.
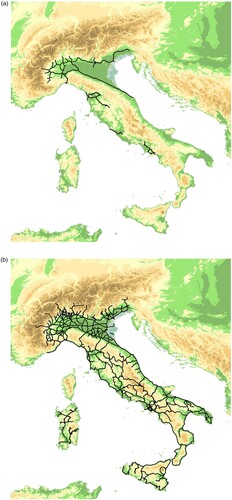
To evaluate external accessibility, we use population data from the historical censuses and calculated travel times between each provincial capital and all other provincial capitals using the geodatabase of the Italian railway network (1839–1913) by Ciccarelli and Groote (Citation2018). During 1861–1911, the network developed and covered the national territory. In terms of thousands of kilometres it increased from about 2.5 to about 18.5. illustrates the railway network in 1861 and 1911 (for additional maps covering the period 1861–1911, see Appendix D1 in the supplemental data online). The maps clearly show that flat lands, which make railway construction less costly, fit railway development, and are mainly present in the North and along the coast.Footnote6 In 1911, the density of the network in Northern regions is considerable. Instead, Central and Southern regions are crossed by the Apennines, limiting the capillarity of the network and consequently accessibility. As detailed in Appendix D1 online, accessibility is constructed as a topological network in the ESRI ArcGIS 10.3 geographical information system. For each railway line, the geodatabase contains the exact location of the whole route, its network characteristics (i.e., if and where it links to other railway lines) and attribute data that include the year of construction and the type of gauge. Also included as an attribute is a variable that indicates the year-dependent assumed speed, that in turns differs for standard and narrow gauges.Footnote7 We derived origin–destination matrices for each census year, giving the shortest travel time between each pair of provincial capitals (so matrices for each year).
Figure 3. The Italian railway network in (a) 1861 and (b) 1911.
Sources: Authors’ elaboration on Ciccarelli and Groote (Citation2018); and USGS.
The internal accessibility is conceptualized by Koopmans et al. (Citation2012) as the population size of province at time
, divided by the ‘internal travel time’
. The latter, then, is calculated ‘by dividing the average internal travel distance by the average internal travel speed’. We followed them in the calculation of the internal travel distance (the square root of the area of the province, divided by
). The area and population size of each province are available from the population censuses. While Koopmans et al. use a constant walking speed of 5 km/h, we estimate travel speed by taking into account our knowledge of the development of the railway network within the province:
(2)
(2) By definition, this results in an internal travel speed in province
of 5 km/h before the arrival of the railway. With the extension of the network, the speed will gradually increase in a province-specific way.
Instrument’s validity
The choice of our instrument based on accessibility is supported by arguments which are extensively discussed in Appendix D in the supplemental data online, and which are briefly summarized here.
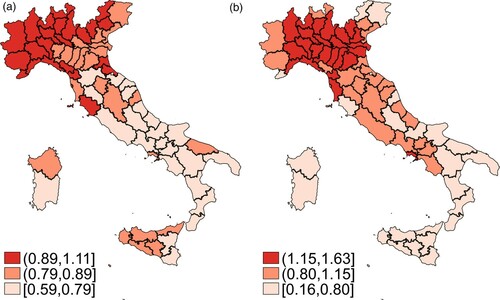
First, there is ample evidence in the literature that the newly built railway network contributed to the diffusion of literacy within and between provinces. This means that if a province became connected to the rail network during the period 1871–1911, it would have a higher value. Therefore, we expect to find a strong correlation between
and
in the first stage of our 2SLS model. This indeed is what , referring to the year 1911, suggests. However, it is important to underline that, as we will see in detail in the empirical discussion, the influence of rail accessibility on the spread of literacy is considered conditionally on a rich set of local socioeconomic variables (including population density and growth, and measures of industrial and patent activities) and various indicators of the education system (including school density, pupil–teacher ratio, and school expenditure per pupil). As discussed in detail in Appendix D2 in the supplemental data online on the relevance of the instrument, on the one hand, the diffusion of railway contributed to the dissemination of knowledge by distributing newspapers, postal and telegraph services throughout the country. On the other hand, the development of the railway contributed greatly to the spread of literacy through its crucial connection with the newborn Italian army. After the unification of the country, millions of young Italians from rural areas were initiated to schooling (by attending mandatory military schools) and to travelling. Indeed, as part of the nation-building process and to reduce their tie with their place of origin, soldiers were systematically relocated among military headquarters. These were typically located in cities, often in the North. Through this crucial channel, soldiers received the stimuli of the urban experience, often for the first time. This represented a culture shock through which modernization and the importance of achieving literacy penetrated the countryside for generations of soldiers and their families.
Figure 4. (a) SpreadLit and (b) accessibility in 1911.
Source: Authors’ elaboration on the data reported in the population censuses and in Ciccarelli and Groote (Citation2018).
Second, there is wide evidence in the literature that the backbone of the Italian railway network was built for military or strategic reasons. In addition, the choice of routes of subsequent secondary internal lines built during the 1880s and the early 1890s was mostly based on political and electoral reasons. In other words, throughout the 19th century provinces were well connected by railway mainly for military, strategic and political/electoral reasons rather than for economic ones (the point is discussed in detail in the Appendix D3.1 in the supplemental data online). This implies that our instrument is not related to the error term (exogeneity of the instrument argument). Therefore, the advantage of using historical information on rail accessibility is that it generates an inter-provincial variation in that is unlikely to affect our contemporary economic outcomes of interest other than through the territorial historical spread of literacy. Moreover, we provide empirical evidence that, conditioning on a wide set of socioeconomic variables, railway developments were uncorrelated to economic growth (see Appendix D3.2 online). This evidence helps to corroborate our thesis that the increase in rail accessibility during 1871–1911 influenced directly (rather than indirectly through an overall improvement in well-being) our historical measure of spatial diffusion of literacy.
EMPIRICAL STRATEGY
Our empirical approach is inspired by Sequeira et al. (Citation2020), who assessed the long-run effects of European immigration to the United States during the age of mass migration, also exploiting the gradual expansion of the railway network in the United States for the identification strategy. We begin with a ‘zero-stage’ regression where we examine a panel of provinces every census decade from 1871 to 1911, and estimate the determinants of the ratio between the literacy rate in the whole province and that in the provincial capital (). Let
, the zero-step equation is specified as follows:
(3)
(3) where
is the provincial index; and
is the time index. The specification includes our measure of railway accessibility in logarithmic scale –
– at the beginning of the census period, which is the basis of our instrument, as discussed in the fourth section; and
is the corresponding coefficient. The
coefficients represent provincial fixed effects capturing time-invariant unobserved heterogeneity, while the
are temporal fixed effects capturing common effects. The
matrix in equation (3) includes those control variables (lagged by one period) which have proved to correlate well with provincial literacy rates through the diffusion of the national primary school system (Casati Law and subsequent reforms) during the historical period considered. These variables (data from Bozzano & Cappelli, Citation2019) include in particular the (log of the) pupil–teacher ratio (
), the (log of the) schooling expenditure per pupil (
), and the (log of the) school density (
).
Given the concern that the early railway accessibility may have had a direct effect on long-term development by allowing industrialization, innovation, urbanization and population growth, we also include in matrix the following variables: a measure of provincial industrial specialization (
, that is, the log of the share of manufacturing value added on total value added both at 1911 prices, data from Ciccarelli & Fenoaltea, Citation2013), a measure of provincial inventive and innovation activity (
, that is, the log of the number of patents per capita; data from Nuvolari & Vasta, Citation2015), the log of provincial population density (
), and inter-census provincial population growth
. The inclusion of these controls of demographic nature is particularly important considering that the Italian population was growing rapidly in the second half of the 19th century, and possibly at different regional speeds. The last control variable included in equation (3) is the share of population in the provincial capital over the total provincial population during the different census years. The rationale behind the introduction of this variable is the possibility that our zero-step dependent variable (
) actually captures the expansion of the provincial capital within the province, rather than the territorial diffusion of literacy.
Using the zero-stage estimates, we construct, for each province and census decade, a measure of literacy diffusion that is predicted using only the railway accessibility variable (, where
is the estimate of
from equation 3). In other words, the only variation that we interpret as exogenous is the effect of being connected to the railway during the aggregate post-unification period. This procedure yields a predicted literacy diffusion rate for each province and decade. Using these estimated rates, we then create, for each province, an average across decades from 1871 to 1911:
(4)
(4) Finally, we estimate the cross-province relationship between the average historical literacy diffusion rate and an economic outcome today using the predicted literacy diffusion rate,
, as an instrument for the actual historical literacy diffusion rate. We implement our IV procedure using 2SLS. The first-stage equation is specified as:
(5)
(5) where
is the actual temporal average (1871–1911) of
.
The second-stage equation is:
(6)
(6) where
is a contemporary economic outcome of interest (real disposable income, unemployment rate, human capital and patent intensity), measured in 2011.Footnote8 The vector
includes only two purely exogenous geographical characteristics of the province, namely (1) the (log of) population-weighted average altitude of the municipalities belonging to the province, and (2) a dummy ‘North’ indicating whether or not the province belongs to the North of the country.
EMPIRICAL EVIDENCE
Zero-stage estimation results
The results of the zero-stage regression (equation 3) are reported in . The standard errors are computed using heteroskedasticity and both spatial and serial autocorrelation consistent (HAC) robust covariance matrices of parameters for fixed effects panel data models. In column model 1, we report a simple specification without other controls than for spatial and temporal fixed effects. In model 2, we extend the specification by including other control variables.
Table 2. Zero-stage fixed effects estimates. Dependent variable: SpreadLit.
These results suggest that the railway accessibility variable (our key variable) is a strong predictor of the territorial diffusion of literacy in a province. The associated coefficient is positive and statistically significant, which means that provinces with higher accessibility to the railway network experienced higher human capital diffusion. Noteworthy, the result is robust to the inclusion of various socioeconomic control variables, and the spatial and temporal fixed effects as well.
Among the controls, and in line with the results in Ciccarelli and Fachin (Citation2017) and Bozzano and Cappelli (Citation2019), both the ratio and the
variables are positively correlated with our measure of territorial diffusion of literacy at 5% level of significance, while the coefficient of
is only significant at 10% significance level. Also, the coefficient of
is positive and significant, while
has a negative effect on
. Finally, we can exclude any demographic effect on the territorial diffusion of literacy, since the coefficients of the three demographic variables are not significantly different from zero.
As mentioned in the previous section, we have computed a predicted literacy diffusion rate for each province and decade using as predictor the railway accessibility (exogenous) variable only, and then we have created, for each province, an average across decades from 1871 to 1911, obtaining our IV (; see equation 4) for the 2SLS approach (see equations 5 and 6). For reason of space, the positive correlation between actual and predicted average values of
and their geographical distribution are assessed in Appendix E1 in the supplemental data online.
The long-term effects of territorial diffusion of literacy on economic outcomes
In this section we discuss the estimation results of the long-run effect of historical territorial diffusion of literacy on economic outcomes (Equationequation 6(6)
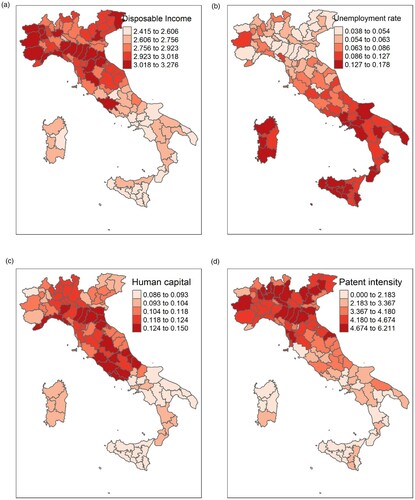
(6) ). We selected four provincial contemporary economic outcomes for the year 2011: (1) disposable income; (2) unemployment rate; (3) human capital (average years of schooling); and (4) patent intensity.Footnote9 shows the spatial distribution of these variables: the North of Italy is strongly characterized by higher incomes, lower unemployment rates and higher patent intensities with respect to the rest of the country; human capital is higher in the Centre of Italy and in Emilia-Romagna. The degree of spatial autocorrelation is indeed always significantly positive (with the standardized Moran’s I of 9.455–10.545).
Figure 5. Economic outcomes, 2010: (a) disposable income; (b) unemployment rate; (c) human capital; and (d) patent intensity.
Source: Author’s elaboration on EUROSTAT, ISTAT and PROMETEIA data.
reports the 2SLS estimates with and without the two exogenous geographical controls (the dummy ‘North’, and the logarithm of population-weighted average altitude of the municipalities belonging to the province).Footnote10 The upper part displays OLS estimates to compare the magnitude of the coefficients with and without control for endogeneity. Preliminary regression models were characterized by spatially autocorrelated residuals, indicating a misspecification error. In order to solve this problem, we have applied the Moran eigenvector approach discussed by Tiefelsdorf and Griffith (Citation2007).Footnote11 As shown by the results of the Moran’s I test reported in , residual spatial autocorrelation has been removed by this semiparametric spatial filter method.
Table 3. Spatially filtered ordinary least squares (OLS) and two-stage least squares (2SLS) estimates of the effects of historical diffusion of literacy on economic prosperity today.
As for the diagnostics of the 2SLS estimates, the Wu–Hausman tests always confirm that our historical measure of territorial diffusion of literacy () is endogenous, while the weak-instrument tests corroborate the hypothesis of a significant correlation between our external instrument (the predicted value of
from the zero-step model) and the endogenous regressor (the observed
variable). reports the robust first-stage
-statistics.Footnote12 In all cases (see Appendix E2 in the supplemental data online for further details), we can reject the null hypothesis of weak instruments.
The estimated 2SLS coefficients clearly show that the spread of literacy over the 1871–1911 period resulted in significantly higher income, less unemployment, higher human capital and higher patent intensity today. This evidence is robust to the inclusion of geographical controls. The magnitude of the coefficients suggests that a 1% increase in the territorial diffusion of literacy () resulted in a 1.1% increase in income, a 0.1% increase in human capital, a 0.3% decrease in the unemployment rate and in 12% increase in patent intensity.Footnote13 Comparing OLS and 2SLS estimates, it clearly emerges that the OLS correlation between
and every contemporary economic outcome is systematically much smaller (in absolute terms) than the 2SLS estimates. Thus, OLS estimates understate the long-run economic benefits of the historical territorial diffusion of literacy, indicating the existence of persistent omitted variables, correlated to the historical territorial diffusion of literacy, that independently affected the contemporary economic outcomes.
The above evidence is fully consistent with the historical and regional economic literature considered in the second section. By closing the urban–rural human capital gap during the early stages of the transition into modern economic growth, Northern regions were able to create the solid territorial conditions able to produce long-lasting economic advantages, thereby exacerbating the dualism of Italy’s economy.
CONCLUSIONS
The Italian economy is characterized by a sizeable and persistent regional divide, with Southern regions lagging behind. The regional economic literature points to differences in territorial conditions (i.e., absorptive capacity) as a crucial element of regional access to knowledge, innovation and inventive activities, and ultimately economic growth. History can help to shed some light on why certain regions are better endowed then others in terms of these crucial territorial elements.
The paper uses a new set of historical data and proposes a new indicator of the territorial diffusion of human capital to investigate the long-term consequences of the heterogeneous diffusion of basic education in 19th-century Italy on the regional economic divide nowadays. After the country’s unification in 1861, a free and mandatory schooling system at the national level was introduced. The financing of the school system was left for decades to the (often poor) budgets of the municipalities. The historical literature documents that the late adoption of a centralized educational system was a partial institutional failure that contributed to a very heterogeneous diffusion of literacy across regions. We show that the consequences lasted well into the 20th century. Our historical data and indicator show that literacy rates were generally higher in provincial capital cities than in their hinterlands and that in the 50 years from the unification of the country to the First World War, only Northern regions were able to close this gap. Our results show that this early creation of a homogeneous territory in terms of human capital endowment, occurring when the country was taking its first steps to modern economic growth, has determined a persistent relative advantage of Northern over Southern regions in terms of income and other economic outcomes.
The possible reasons behind the persistence of the Italian regional divide, and the limited success of both national and European policies to reduce it, continue to attract the interest of researchers and policymakers (Floerkemeier et al., Citation2021). Indeed, the analysis of within-country variations to understand how human capital contributes to economic development and interacts with institutions in the long-run has been partly neglected in the literature (Acemoglu et al., Citation2014). Our contribution also aims at enriching this branch of the regional economics literature. One of the aspects that surely deserves further investigation is the empirical analysis of the actual mechanisms through which the early uneven territorial diffusion of human capital contributed over decades to determine current regional disparities. Beyond gathering new homogeneous data at the local level for intermediate benchmark years, this will ask for an explicit consideration of various factors that may have contributed to persistence. These include structural change away from agriculture and related urbanization process (Accetturo et al., Citation2019, focus on the period 1951–2011), but also internal migrations and their skill content (Fratesi & Percoco, Citation2014, consider the period 1980–2011). We have left these important aspects for future research.
Supplemental Material
Download PDF (4.3 MB)ACKNOWLEDGMENTS
Previous versions of the paper were presented at the 2019 and 2020 AISRe conferences, and at the University of Rome Tor Vergata. The authors thank Sascha Becker, Torben Dall Schmidt, Stefano Maggi, Tommaso Proietti and Marco Rovinello for comments and suggestions. The authors are grateful to Editor David Bailey and three anonymous reviewers for their constructive suggestions. The usual disclaimer applies.
DISCLOSURE STATEMENT
No potential conflict of interest was reported by the authors.
Notes
1. There was no population census in 1891.
2. Appendix B1 in the supplemental data online illustrates the historical administrative units of Italy (regions and provinces). Appendix C online reports additional evidence on the geographical distribution of the variable .
3. In Belluno in 1881, Massa Carrara in 1901 and 1911, and Ravenna in 1871, the historical sources report literacy rates higher at the provincial level than in the provincial city capitals, so assumes a value slightly > 1.
4. For certain provinces, such as Leghorn in Tuscany, Porto Maurizio in Liguria and Naples in Campania, the dimension of the provincial territory is particularly reduced, so that there is little territory left once we take into account the provincial capital city.
5. Appendix D1 in the supplemental data online presents several additional details on accessibility.
6. The map for 1861 shows this point particularly well. The first lines were built in areas with no mountains.
7. Included in the network of railway lines are the virtual shortest-distance lines between each provincial capital and the closest railway line. These are necessary as links in the network analysis if a capital is not yet connected to the railway network. The speed on these virtual links is set to walking speed (5 km/h).
8. For the sources of these data, see Appendix A in the supplemental data online.
9. For the sources of these data, see Appendix A in the supplemental data online.
10. The North includes seven regions: Lombardy, Piedmont, Valle d’Aosta, Liguria, Veneto, Friuli-Venezia Giulia and Emilia-Romagna. As a robustness check, Appendix E3 in the supplemental data online reports the econometric results based on a third model specification which includes additional (not strictly exogenous) control variables, such as the shares of agriculture, manufacturing and service employment on total employment and population density.
11. In the case of 2SLS estimates, we have first estimated the model without control for spatial autocorrelation. We have then identified the set of eigenvectors needed to filter out spatial autocorrelation from the second-stage residuals. Finally, we have re-estimated the 2SLS model by including this additional set of exogenous regressors in both the first and the second stages.
12. The value of this statistic differs slightly across the equation depending on the outcome variable used, since the set of eigenvectors is included as control functions to filter out spatial autocorrelation from the residuals differs across these equations.
13. To assess whether the effect of varies across the two territorial areas, we have estimated a 2SLS model with an interaction between the variable
and the dummy variable North. Evidence for all types of economic outcomes considered in our analysis does not reveal any spatial difference in the marginal effect of
.
REFERENCES
- Accetturo, A., Cascarano, M., & de Blasio, G. (2019). Dynamics of urban growth: Italy, 1951–2011. Economia Politica: Journal of Analytical and Institutional Economics, 36(2), 373–398. https://doi.org/https://doi.org/10.1007/s40888-019-00155-7
- Acemoglu, D., Gallego, F. A., & Robinson, J. A. (2014). Institutions, human capital, and development. Annual Review of Economics, 6(1), 875–912. https://doi.org/https://doi.org/10.1146/annurev-economics-080213-041119
- Becker, S. O., & Woessmann, L. (2009). Was Weber wrong? A human capital theory of protestant economic history. Quarterly Journal of Economics, 124(2), 531–596. https://doi.org/https://doi.org/10.1162/qjec.2009.124.2.531
- Bertola, G., & Sestito, P. (2013). Human capital. In G. Toniolo (Ed.), The Oxford handbook of the Italian economy since unification (pp. 249–270). Oxford University Press.
- Boschma, R. A. (1998). The industrial rise of the third Italy: Open window of locational opportunity? Paper presented at the 38th Congress of European Regional Science Association, Vienna, August 28–September 1, 1998.
- Bozzano, M., & Cappelli, G. (2019). The legacy of history or the outcome of reforms? Primary education and literacy in Liberal Italy (1871–1911) (DEPS Working Papers, University of Siena No. 801).
- Caicedo, F. V. (2019). The mission: Human capital transmission, economic persistence, and culture in South America. The Quarterly Journal of Economics, 134(1), 507–556. https://doi.org/https://doi.org/10.1093/qje/qjy024
- Cappelli, G., & Vasta, M. (2020). Can school centralization foster human capital accumulation? A quasi-experiment from early twentieth-century Italy. The Economic History Review, 73(1), 159–184. https://doi.org/https://doi.org/10.1111/ehr.12877
- Caragliu, A., & Nijkamp, P. (2012). The impact of regional absorptive capacity on spatial knowledge spillovers: The Cohen and Levinthal model revisited. Applied Economics, 44(11), 1363–1374. https://doi.org/https://doi.org/10.1080/00036846.2010.539549
- Ciccarelli, C., & Fachin, S. (2017). Regional growth with spatial dependence: A case study on early Italian industrialization. Papers in Regional Science, 96(4), 675–695. https://doi.org/https://doi.org/10.1111/pirs.12217
- Ciccarelli, C., & Fenoaltea, S. (2013). Through the magnifying glass: Provincial aspects of industrial growth in post-unification Italy. The Economic History Review, 66(1), 57–85. https://doi.org/https://doi.org/10.1111/j.1468-0289.2011.00643.x
- Ciccarelli, C., & Groote, P. (2018). The spread of railroads in Italian provinces: A GIS approach. Scienze Regionali, Italian Journal of Regional Science, 2, 189–224. https://doi.org/https://doi.org/10.14650/90221
- Ciccarelli, C., & Weisdorf, J. (2019). Pioneering into the past: Regional literacy developments in Italy before Italy. European Review of Economic History, 23(3), 329–364. https://doi.org/https://doi.org/10.1093/ereh/hey014
- Cipolla, C. M. (1969). Literacy and development in the west. Penguin.
- Crescenzi, R., & Rodriguez-Pose, A. (2012). Infrastructure and regional growth in the European Union. Papers in Regional Science, 91(3), 487–513. https://doi.org/https://doi.org/10.1111/j.1435-5957.2012.00439.x
- De Fort, E. (1995). Scuola e analfabetismo nell’Italia del ‘900. Il Mulino.
- De Fort, E. (2015). Maestri e maestre in Italia dalla fine dell’Antico Regime alla salita al potere del fascismo. Nascita e sviluppo di una professione. Historia y Memoria de la Educación, 1(1), 131–201. https://doi.org/https://doi.org/10.5944/hme.1.2015.12817
- Diebolt, C., & Hippe, R. (2019). The long-run impact of human capital on innovation and economic development in the regions of Europe. Applied Economics, 51(5), 542–563. https://doi.org/https://doi.org/10.1080/00036846.2018.1495820
- Di Martino, P., & Vasta, M. (2017). Ricchi per caso. La parabola dello sviluppo economico italiano. Il Mulino.
- Federico, G., Nuvolari, A., & Vasta, M. (2019). The origins of the Italian regional divide: Evidence from real wages, 1861–1913. The Journal of Economic History, 79(1), 63–98. https://doi.org/https://doi.org/10.1017/S0022050718000712
- Felice, E. (2012). Regional convergence in Italy, 1891–2001: Testing human and social capital. Cliometrica, 6(3), 267–306. https://doi.org/https://doi.org/10.1007/s11698-011-0076-1
- Felice, E. (2019). The roots of a dual equilibrium: GDP, productivity, and structural change in the Italian regions in the long run (1871–2011). European Review of Economic History, 23(4), 499–528. https://doi.org/https://doi.org/10.1093/ereh/hey018
- Floerkemeier, H., Spatafora, N., & Venables, A. (2021). Regional Disparities, Growth, and Inclusiveness (International Monetary Fund (IMF) Working Paper, No. 38).
- Fratesi, U., & Percoco, M. (2014). Selective migration, regional growth and convergence: Evidence from Italy. Regional Studies, 48(10), 1650–1668. https://doi.org/https://doi.org/10.1080/00343404.2013.843162
- Gorin, C. (2017). Accessibility, absorptive capacity and innovation in European urban areas (Working Papers halshs-01584111). HAL.
- Graff, H. J. (1987). The legacy of literacy: Continuities and contradictions in western culture and society. Indiana University Press.
- Guiso, L., Sapienza, P., & Zingales, L. (2006). Does culture affect economic outcomes? Journal of Economic Perspectives, 20(2), 23–48. https://doi.org/https://doi.org/10.1257/jep.20.2.23
- Harris, C. D. (1954). The market as a factor in the localization of industry in the United States. Annals of the Association of American Geographers, 44(4), 315–348. https://doi.org/https://doi.org/10.1080/00045605409352140
- Kelly, M. (2019). The standard errors of persistence (CEPR Discussion Paper No. 13783).
- Koopmans, C., Rietveld, P., & Huijg, A. (2012). An accessibility approach to railways and municipal population growth, 1840–1930. Journal of Transport Geography, 25, 98–104. https://doi.org/https://doi.org/10.1016/j.jtrangeo.2012.01.031
- Nuvolari, A., & Vasta, M. (2015). Independent invention in Italy during the liberal age, 1861–1913. The Economic History Review, 68(3), 858–886. https://doi.org/https://doi.org/10.1111/ehr.12087
- Rodriguez-Pose, A. (1999). Innovation prone and innovation Averse societies: Economic performance in Europe. Growth and Change, 30(1), 75–105. https://doi.org/https://doi.org/10.1111/0017-4815.00105
- Roses, J., & Wolf, N. (2019). The economic development of Europe’s regions: A quantitative history since 1900. Routledge.
- Sequeira, S., Nunn, N., & Qian, N. (2020). Immigrants and the making of America. The Review of Economic Studies, 87(1), 382–419. https://doi.org/https://doi.org/10.1093/restud/rdz003
- Stock, J., & Yogo, M. (2005). Testing for weak instruments in linear IV regression. In Andrews, D. W. K. (Ed.), Identification and inference for econometric models (pp. 80–108). Cambridge University Press.
- Tabellini, G. (2010). Culture and institutions: Economic development in the regions of Europe. Journal of the European Economic Association, 8(4), 677–716. https://doi.org/https://doi.org/10.1111/j.1542-4774.2010.tb00537.x
- Tiefelsdorf, M., & Griffith, D. A. (2007). Semiparametric filtering of spatial autocorrelation: The eigenvector approach. Environment and Planning A: Economy and Space, 39(5), 1193–1221. https://doi.org/https://doi.org/10.1068/a37378
- Voth, H. J. (2020). Persistence – Myth and mystery (CEPR Discussion Papers No. 15417).
- Zamagni, V. (1978). Istruzione e sviluppo economico. Il caso italiano 1861–1913. In G. Toniolo (Ed.), L’economia italiana 1861–1940 (pp. 137–178). Laterza.