
 ?Mathematical formulae have been encoded as MathML and are displayed in this HTML version using MathJax in order to improve their display. Uncheck the box to turn MathJax off. This feature requires Javascript. Click on a formula to zoom.
ABSTRACT
Automation is expected to have strong implications for labour-saving technologies. We calculate the proportion of jobs at high risk of automation across European regions using data from the 2018 Labour Force Survey (LFS). We examine the relationship between regional vulnerability to job automation, specialization, related (and unrelated) variety and agglomeration. The results indicate that regions at low vulnerability to job automation benefit from unrelated variety and high population density. Regions with higher proportions of clerical support workers, craft and related trade workers, and plant and machine operators and assemblers are likely to face greater disruption.
INTRODUCTION
In recent decades, an increasingly uneven geography of innovation and production has emerged. Many people argue that we are on the cusp of a new industrial revolution – often termed ‘Industry 4.0’ (De Propris & Bailey, Citation2020, p. 1). This is expected to unleash an exponential wave of technologies and value chain organizations that will integrate cyber physical systems, the so-called ‘Internet of Things’, big data, cloud computing, robotics, artificial intelligence (AI)-based systems and additive manufacturing (European Commission, Citation2018). One of the key components of Industry 4.0 is a potential step change in job automation and a new generation of intelligent machines. This paper focuses on increased job automation (defined as computer-controlled equipment), which is predicted to have a major impact on labour markets (Brynjolfsson & McAfee, Citation2014; Ford, Citation2015; Frey & Osborne, Citation2017).
It is highly contested as to whether automation will lead to positive or negative job growth. Some predict a doomsday outcome where technological unemployment is inevitable (Brynjolfsson & McAfee, Citation2014; Ford, Citation2015; Susskind & Susskind, Citation2015), whilst others highlight concerns around changes in the relative share of labour to capital (Acemoglu & Restrepo, Citation2017). Other views hold a more optimistic outlook for employment opportunities due to a creation of new needs, new tasks and professions, and a further benefit to the economy from technological efficiency gains (Gates et al., Citation1995; Schmidt & Cohen, Citation2014). More recently, job polarization has also become an increasing concern, with significant evidence of a decline of middle-skilled, middle-income jobs (Adermon & Gustavsson, Citation2015; Goos et al., Citation2009; Goos & Manning, Citation2007) in comparison with employment at the upper and lower ends of the skills profile. All these concerns are still persisting and creating anxiety in the age of Industry 4.0 (Autor, Citation2015; McClure, Citation2018) with empirical evidence suggesting that job polarization will continue (Arntz et al., Citation2016; Frey & Osborne, Citation2017; Muro et al., Citation2019a).
Technological job disruption and polarization are inextricably linked to the dynamics of regional labour markets and the underlying technological specializations and variety present in regions. In recent decades, regional labour markets throughout Europe have been significantly impacted by the de-industrialization process and the adoption of new technologies (Barzotto & De Propris, Citation2019). There is a limited burgeoning literature focusing on the risk of future automation to jobs at the regional level (Frank et al., Citation2018; Muro et al., Citation2019b; Organisation for Economic Co-operation and Development (OECD), Citation2018). However, Leigh et al. (Citation2020) emphasize that there is a ‘clear need for more research, data and theory to answer critical questions about the future of work and all of the ensuing implications of that future for local and regional economies and society’ (p. 95). This is further underscored by Leigh and Kraft (Citation2018) who highlight that existing analyses fail to shed any deep understandings on the spatially contingent implications of Industry 4.0 and its regional diffusions. Addressing this gap in existing knowledge is critical as Frank et al. (Citation2018) emphasize that answering the question of how local areas deal with automation will have significant impacts on ‘everything from urban migration to investment, and from social welfare policy to educational initiatives’ (p. 1). Yet despite the clear policy relevance of this issue, Leigh and Kraft (Citation2018) suggest that policymakers are operating in a knowledge vacuum relating to job automation risk at the local level.
Linked with the need to provide insights into regional automation risk, the spatial composition of industries has long been regarded as a key explanatory factor in determining the success of regions and in explaining the vulnerability of regions to shocks (Boschma, Citation2015; Ezcurra, Citation2011; Martin & Sunley, Citation2015; Porter, Citation1990). In the limited literature exploring the impending job automation shock associated with the Industry 4.0 period, regional agglomeration and underlying occupational structures have been identified as having the potential to impact regional exposure to potential job automation (Frank et al., Citation2018). In the broader literature on regional growth and innovation it is hypothesized that regions characterized by MAR externalities – Marshall (Citation1920), Arrow (Citation1962), Romer (Citation1986) – with a high concentration of firms specializing in an industry, will tend to be more innovative due to enhanced scale economies, reduced transaction costs and knowledge spillovers arising between similar firms in an industry in co-located environments. Competing to some degree with this is the literature on Jacobs (Citation1969) externalities which argues that different firms have different knowledge bases, skillsets and knowledge capabilities primarily driving innovation in agglomerations. Recent developments in the conceptual framework of related and unrelated variety suggest that some sectors are more related than others, and thus knowledge spillovers are more likely to occur between related sectors relative to unrelated sectors in regions, enhancing employment growth and recombinant innovation (Frenken et al., Citation2007). The spatial concentration of industry is intrinsically linked with the potential automation shock literature, with Frank et al. (Citation2018) emphasizing that it is not clear whether ‘the forces of diversity, specialization and the division of labour shape a city’s [/regions’] ability to accommodate automation’ (p. 2). This is further supported by Ciffolilli and Muscio (Citation2018) who identify that there is also an absence of understanding on the regional comparative advantages and regional technological specializations associated with job automation.
Our paper makes several contributions to the nascent literature of regional automation risk. First, we explicitly address the call by Leigh et al. (Citation2020) for further analysis and insights into regional automation risk by measuring the degree to which automation risk is present across European regions. Second, building on the work of Frank et al. (Citation2018), we consider the role of industry and regional structure, focusing on measures of, specialization, related and unrelated variety, and agglomeration as predictors of job risk of automation. We measure the job risks of automation by employing the occupational methodology of Frey and Osborne (Citation2017) and apply this to European Labour Force Survey (LFS) 2018 data at the NUTS-2 level. As far as we are aware, our paper is the most detailed study yet undertaken in investigating these regional and spatial implications of automation in the European Union (EU) context and thus makes a timely and necessary contribution to the Industry 4.0 literature. Our results go some way towards providing insights, deemed necessary to address the knowledge deficit identified by Leigh and Kraft (Citation2018), which will enable policymakers to strategically consider how regional industrial structures in the Industry 4.0 period may lock regions into job decline.
The remainder of this paper is structured as follows. The next section provides a review of the existing literature and develops our hypotheses. The third section outlines the methodology. The data are described in the fourth section. The fifth section discusses our findings. Section six concludes.
LITERATURE BACKGROUND
Computerization and the introduction of robotics and AI into work settings is reshaping the tasks and occupational skills required of workers and the overall nature of work (Coulibaly et al., Citation2008). This could potentially trigger a ‘transformational shift in the techno-socio-economic paradigm’ (De Propris & Bailey, Citation2020, p. 1) of economy and society. The step changes afforded by technological breakthroughs which are widely adopted across the economy and society are neither necessarily gradual nor linear. Past industrial transitions leading to job automation have proved to be disruptive and have completely reshaped the geography of economies (Audretsch, Citation2018). For example, increased automation alongside globalization led to a shift of manufacturing jobs to developing cities by reducing the relative costs of labour resulting in industrial employment to fall in regions with high labour costs (Glaeser, Citation2018). Automation causes employment in old sectors to decline, but at the same time innovation of new products and services may create new sectors to emerge (De Propris & Bailey, Citation2020). These countervailing Schumpeterian forces will introduce the need for new skills, tasks, occupations and employment opportunities (Perez, Citation2010), ultimately shaping future employment prospects. The capacity of regions to reabsorb redundant labour from declining sectors into newly created ones differs from one region to the next leading to spatial labour market imbalances and interregional labour mobility (Caroleo & Pastore, Citation2010; Martynovich & Lundquist, Citation2016). Technological changes can be costly for some sections of society as skills obsolescence, labour polarization, digital skill gaps, consumption exclusions and unemployment are transitional problems occurring within regions (De Propris & Bailey, Citation2020; Perez, Citation2010).
Significant research has been undertaken in the field of regional resilience, analysing the degree to which economic shocks impact regional economies (Boschma, Citation2015; Fingleton et al., Citation2012; Martin, Citation2012). Fingleton et al. (Citation2012), Martin et al. (Citation2016), Crowley and Doran (Citation2019) and Doran and Fingleton (Citation2018) show that industrial and economic structures are important in explaining vulnerability to shocks. How regions react to shocks is strongly influenced by path dependency and lock-in; namely the pre-existing industrial structure of the regional economy, as well as the broader set of economic, social and cultural factors that support these sectors (Wolfe, Citation2010). Regional effects and accidents of history persist (Malmberg, Citation1996), or as Krugman (Citation1991, p. 80) referred to it, ‘the long shadow cast by history over location’. Industries that emerge will be conditioned and constrained by the sectors the region has traditionally specialized in (Wolfe, Citation2010).
In the context of automation, Frank et al. (Citation2018) emphasize the lack of clarity on the role played by industrial structures in accommodating automation in urban areas. This is not isolated to the area of automation because it is recognized that different regional structures are advantageous in different situations, and in addition regional economic growth also depends on local forces and context which differ across regions (Beaudry & Schiffauerova, Citation2009; Caragliu et al., Citation2016; de Groot et al., Citation2009, Citation2016; Melo et al., Citation2009). The extent of regional vulnerability to future job automation and what to expect by the role played by different agglomeration structures is unclear. However, a regular theme in the literature is that a more varied economic structure and areas benefitting from enhanced levels of agglomeration externalities will be less vulnerable to shocks (Frenken et al., Citation2007).
Much of the debate in the literature focuses on the contrasting impacts of specialized versus diversified industrial structures. Specialization involves economies of scale external to the firm, but internal to an industry (Hoover, Citation1937). Clusters of industry specialization are linked to innovative activity in all the previous major industrial transitions (Audretsch, Citation2018).Footnote1 Industry 4.0 is expected to hit all sectors, but sectors concentrated in routine activities and physical tasks in predictable environments are predicted to be particularly vulnerable (Frey & Osborne, Citation2017). Places with lower levels of human capital and higher rates of job dependency on focused manufacturing and low-end services are predicted to be harder hit (Muro et al., Citation2019b). Specialized regions may therefore have fewer options for renewal and diversification resulting in technological lock-in and regional lock-out (Boschma, Citation2015; Crespo et al., Citation2014) and a ‘trap of rigid specialization’ (Grabher, Citation1993) and so could be particularly at risk to future decline if vulnerable to job automation. This leads to our first hypothesis:
Hypothesis 1: Specialization increases vulnerability to job automation.
The conceptual framework of related and unrelated variety also builds upon this tradition (Content & Frenken, Citation2016; Frenken et al., Citation2007). The thesis of related variety is that knowledge spillovers are more likely to occur between related sectors relative to unrelated sectors in regions, creating job growth and innovation (Frenken et al., Citation2007). The foundation behind the thesis of related variety is that effective knowledge combinations require a balance of cognitive distance to avoid lock-ins (which may occur under specialization) and of cognitive proximity to enable effective learning (which may occur under diversification/unrelated variety conditions) (Boschma & Iammarino, Citation2009; Nooteboom, Citation2000). Unrelated variety is hypothesized to be superior to related variety for insulating regions from asymmetric shocks as regional sectoral risk is spread out, akin to an investment/product portfolio strategy in business economics (Frenken et al., Citation2007). Unrelated variety can also in some situations provide a favourable climate for technological breakthroughs and the emergence of new sectors (Castaldi et al., Citation2015). Studies employing the related and unrelated variety concepts in empirical analysis have found them to be important for some types of regional growth, although with very mixed accounts across the literature with respect to significance (Content & Frenken, Citation2016). This leads to our second and third hypotheses:
Hypothesis 2: Related and unrelated variety decrease regional vulnerability to job automation.
Hypothesis 3: Unrelated variety will be more important than related variety as sectoral risk is more spread out under the conditions of unrelated variety.
Whilst, larger, populated areas would generally benefit from both industrial specialization and diversification simultaneously, holding these factors constant; there are other aspects of agglomeration economies beyond industrial scope including geographical, temporal and organizational dimensions that also effect economic growth (Ciccone, Citation2002; Ciccone & Hall, Citation1996; Henderson, Citation1997; Rosenthal & Strange, Citation2003, Citation2004). Here, we focus on the geographical aspects of agglomeration economies, or more precisely that increasing returns to density may play a crucial role (Ciccone & Hall, Citation1996) in determining job automation outcomes across regions. Agglomerations bring together pools of skilled labour, suppliers, home market demand and enhanced sharing, matching and learning effects between firms (Duranton & Puga, Citation2004) and so the density of this activity can matter as well as scale (Rosenthal & Strange, Citation2004). Indeed, there is evidence that density is associated with enhanced productivity in United States (Ciccone & Hall, Citation1996) and European regions (Brülhart & Mathys, Citation2008; Ciccone, Citation2002), enhanced income, population and house price growth (Ottaviano & Pinelli, Citation2006) and knowledge indicators (Carlino et al., Citation2007). As such, density as well as scale also appears to be related to the knowledge spillover and labour-matching features underpinning agglomeration economies. If places are subject to shocks such as automation, then if these features are indeed locally evident, this would imply that denser places will be better able to adjust to these shocks. This leads us to our fourth hypothesis:
Hypothesis 4: Regions benefiting from agglomeration effects related to density are less vulnerable to job automation.
METHODOLOGIES FOR IDENTIFYING AT-RISK OCCUPATIONS
We use the methodology developed by Frey and Osborne (Citation2017) to identify the proportion of workers at risk of automation across European regions. There are several alternative approaches to the computation of automation risk,Footnote2 each resulting in different estimates of absolute risk of automation. Frank et al. (Citation2018) emphasize that even if we treat these absolute measures with some scepticism, they are still internally consistent and are extremely useful at providing insights into the relative risk of automation across different jurisdictions. Therefore, our interpretation is to draw on the Frey and Osborne (Citation2017) methodology to provide insights into the relative exposure of European regions to automation risk.
Specifically, Frey and Osborne (Citation2017) arrive at their automation risk probabilities using machine-learning experts to assess the automatability of 70 occupations using detailed task descriptions. They asked the experts to assess whether each task for these occupations is likely to be automated given current knowledge on computerization capabilities and possibilities. Nine properties were used to assess occupations such as the level of manual dexterity or social perceptiveness.Footnote3 They drew on data from the O*Net database, which has detailed data from population surveys of 20,000 unique task descriptions and additional data on the skills, knowledge and abilities possessed by different occupations. Using big data and algorithm applications they assess automatable versus non-automatable tasks of the 70 different occupations. This algorithm was then applied to assess the automatability of another 632 occupations. Frey and Osborne were then able to examine a total of 702 occupations that existed for 97% of the workforce in the United States. They estimated that 47% of jobs in the United States were at high risk of being automated. Overall, jobs with tasks linked to perception and manipulation, creativity, and social intelligence are considered to be safer from automation (OECD, Citation2018).
Frey and Osborne (Citation2017) provide detailed information on the probability of automation of 702 occupations at US Standard Occupational Code (SOC) six-digit level. In order to operationalize the Frey and Osborne methodology in the European context, the US SOC codes must first be translated into International Standard Occupational Codes (ISCO). Frey and Osborne base their analysis on the 2010 occupational classifications of the US SOC. The US SOCs can be converted using the Bureau of Labour Statistics official conversion table to ISCOs (Bureau of Labor Statistics, Citation2012). The ISCO present in the LFS are at three-digit level. When converting US SOCS to the ISCO there is not a one-to-one match. This is due to the ISCO codes being at a higher aggregation level. Therefore, in some instances two or more of the US SOC codes are combined into one ISCO code. Where this occurs the risk of automation values from Frey and Osborne are averaged to provide an average risk for the aggregated occupation. In total, the 702 occupations present in Frey and Osborne translate to 122 ISCOs at the three-digit level present in the EU LFS. A complete list of the 122 occupational codes in this analysis are presented in Appendix A in the supplemental data online.
As we are moving from the six-digit US codes to the three-digit EU codes, we investigate whether this translation significantly impacts our measure of automation. When aggregated, the average automation risk probability using the EU codes is 0.51 (standard deviation (SD) = 0.27, minimum = 0.004, maximum = 0.97) while the average probability for the United States is 0.53 (SD = 0.36, minimum = 0.002, maximum = 0.99). This indicates that our transformation has reduced the variability within our measure, but the average, minimum and maximum values remain closely aligned with the original data, indicating that the scaling down does not negatively impact the reliability of the risk measure.
As an illustrative example of the automation risk to occupations, we consider an example of select occupations in our analysis which have amongst the highest and lowest degrees of automation risk (see Figure B1 in Appendix B in the supplemental data online). General office clerks, numerical clerks and general secretaries are some examples of occupations with the highest level of automation risk. These occupations would be characterized as requiring low levels of finger and manual dexterity, are dominated by routine tasks, require low levels of creativity and decision-making, and are situated in predictable working environments that do not require high levels of social perceptiveness or caring for others. In comparison, occupations identified at low risk such as medical doctors, teachers and health professionals would be at the opposite end of the scale on these features.
DATA
The European Labour Force Survey (LFS)
The dataset used to create our automation risk variable is the 2018 European LFS microdata from Eurostat. All other control variables are derived from alternative sources and are discussed below. The LFS microdata are available for 31 countries in total, but we limit our analysis to the 26 European Union countries and the UK. Within these 27 countries our sample is reduced to 24 due to issues surrounding missing data. For instance, the Netherlands microdata do not contain any information on the NUTS region where the surveyed individuals reside or work. Likewise, Bulgaria is dropped from the sample as the data on occupational codes for those in employment are only available at the ISCO two-digit level, while the modelling approach outlined above requires ISCO three-digit levels to be available. Cyprus is dropped for a similar reason as the ISCO codes are only available at a one-digit level.
As we analyse the exposure of regional employment to automation risk, our analysis focuses on individuals who are in employment. Therefore, we retain in our analysis approximately 1.55 million individuals who are in employment across these 24 European countries. In terms of analysis, we aggregate this individual data to the NUTS-2 level to identify the proportion of those employed at risk of automation. At this point a further issue is noted whereby 23 countries allow for individuals to be identified at the NUTS-2 level, while the UK only provides information at the NUTS-1 level. Despite this we retain the UK in our analysis, focusing on NUTS-2 regions for 23 countries and noting that the spatial scale is different for the UK.Footnote4 We also note that in some instances the NUTS-2 region considered consists of a complete country.
The EU LFS is designed to give accurate quarterly information at the national level and accurate annual information at the NUTS-2 regional level (Eurostat, Citation2019). We use the annual data. The microdata we use, which are provided by all participating countries, include the NUTS-2 level codes for each individual (with the exception of the UK where it is the NUTS-1 level code). We note that it is not possible to employ NUTS-3 level data as the provision of NUTS-3 data has no legal basis in the EU LFS and the figures are provided by participating countries on a voluntary basis (Eurostat, Citation2019).
REGIONAL EMPLOYMENT EXPOSURE TO AUTOMATION RISK
In order to identify the proportion of employment at risk of automation across European regions we adopt the following procedure. We identify the probability of each individual’s job in the LFS being automated using the ISCO three-digit codes present in the LFS and matched them with Frey and Osborne’s (Citation2017) automation probabilities. Following existing convention (Arntz et al., Citation2016; Frank et al., Citation2018; Frey & Osborne, Citation2017; OECD, Citation2018), we assume anyone with a probability of automation > 70 is at ‘high risk’ of automation. To find the number of jobs at high risk of automation in each region, we sum the number of individuals in the LFS in each NUTS region at high risk of automation. To calculate the proportion of jobs at high risk of automation, we next sum the total number of people employed in the LFS in each region. We then divide the total number of jobs at high risk of automation in the LFS in each region by the total number of people employed in the LFS in each region.
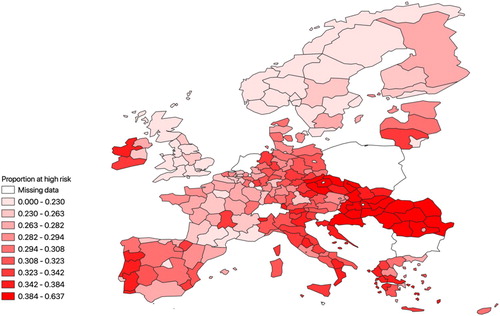
presents a heat map of job automation risk across the regions of the 24 European countries considered. What is apparent is that there is significant variation in exposure across European regions and within countries to automation risk. Norway is the least exposed nation on average, while Romania has the highest exposure to automation. The clustering of high-risk regions in Eastern Europe, the Mediterranean area and in the most western regions is particularly striking. Appendix C in the supplemental data online provides a discussion of two sample regions, NO01 – Oslo og Akershus and RO21 – Nord-Est, and highlights how different occupational labour market structures explains the degree of observed automation risk in each region.
Figure 1. Job automation risk across European regions (based on the 2018 European Union Labour Force Survey (LFS).
EXPLANATORY VARIABLES
Structural business statistics: industrial structure variables
When considering the industrial structure variables, we use Structural Business Statistics (SBS) derived from Eurostat. This provides information on NACE Rev. 2 two-digit sectors at the NUTS two-digit regional level. We follow the approach of Cainelli et al. (Citation2019) and Ketels and Protsiv (Citation2021) in our use of the SBS data, and where data are missing for some sectors use a similar methodology to their imputation approaches (see Appendix D in the supplemental data online for details). We construct three indicators of industrial structure, the Herfindahl index and related/unrelated variety indexes. All indicators are constructed for 2017. Equation (1) displays the method of calculating the Herfindahl index:
(1)
(1) where
is the Herfindahl index for region i;
is the level of employment in region i in NACE two-digit industry h; and
is the level of employment in region i. The Herfindahl index measures concentration in a particular industry. A higher value indicates higher industrial concentration in a region, while a lower value indicates a lower level of industrial concentration in the region (van Egeraat et al., Citation2018).
Variety of industrial structure can be decomposed into unrelated and related variety. Which we specify following Basile et al. (Citation2017):
(2)
(2)
(3)
(3) where the two-digit NACE classification h fall exclusively under a one-digit NACE classification j; and where
indicates the one-digit shares. Higher values of these indices indicate higher levels of unrelated variety or higher levels of related variety.
Population density
To capture agglomeration effects related to density we use population density at the NUTS-2 level as per equation (4):
(4)
(4) where
is the natural logarithm of the population density of region i in 2017;
is the population of region i; and
is the area of region i in km2.
The use of population density to measure scale of agglomeration is consistent with Frank et al. (Citation2018) and Muro et al. (Citation2019b).
Regional context control variables
Apart from industrial structures and agglomeration, regional economic growth also depends on local forces and context which differ across regions (de Groot et al., Citation2009). These additional contextual factors include issues such as regional innovation systems (Asheim & Isaksen, Citation2002), human capital accumulation (Bronzini & Piselli, Citation2009), learning regions (Morgan, Citation2007), institutions (Rodríguez-Pose, Citation2013), cultural and creative regions (Cooke & De Propris, Citation2011), and the extent of start-up intensity and entrepreneurial regimes (Audretsch & Fritsch, Citation2002; Klepper, Citation1996). Subject to data availability, we attempt to control for a variety of factors which may impact a region’s exposure to automation risk.
The first set of control variables considered are derived from the European Regional Innovation Scoreboard 2017. From this dataset we obtain a ranking of the region’s educational quality, engagement in lifelong learning, and the overall innovativeness of the region. The measures included are the normalized rankings of each region as calculated in the Regional Innovation Scorecard (RIS) 2017. The regions educational quality is proxied for by the normalized ranking of the percentage of population aged 25–34 having completed a tertiary education. For lifelong learning this is the normalized ranking of the share of the population aged 25–64 enrolled in education or training aimed at improving knowledge, skills and competences. For the innovativeness of the region, to avoid double counting the education and lifelong learning variables, we calculate the average of each region’s normalized ranking in every other category.
A significant literature emphasizes that creative occupations are less exposed to automation risk. Therefore, we calculate an indicator of the proportion of the workforce that is employed in creative occupations based on the LFS (in a similar way to our automation risk variable). To identify creative occupations, we follow the definitions set out by Bakhshi et al. (Citation2013) of creative occupations at the ISCO three-digit level.
To capture other occupational labour market structure impacts, we also include the proportion of the workforce employed in ISCO one-digit occupations in each region. This provides nine alternative occupational categories and we exclude ‘managers’Footnote5 as the reference category.
In addition to this we also incorporate measures of economic performance. Specifically, we incorporate the natural logarithm of gross domestic product (GDP) per capita and the unemployment rate of each region. Controls are also included to capture the proportion of the population aged under 15 and over 65. The proportion of the population which is male is also included.
Descriptive statistics for our variables
presents the descriptive statistics for the variables considered. It can be noted that the average degree to which employment across European regions is at high risk of job automation is approximately 30%, but this has significant variation. Similarly, there are wide disparities across the independent variables by region, highlighting the need to control for heterogenous context effects across European regions. We also present a correlation matrix for our variables in Appendix E in the supplemental data online.
Table 1. Summary statistics.
EMPIRICAL STRATEGY
We empirically analyse the association between regional industry structure, agglomeration related to density and the exposure to automation risk, controlling for a variety of regional specific characteristics which may impact automation risk. To do so we specify the following model:
(5)
(5) where
is the proportion of workers in region i at high risk of automation;
is the Herfindahl index;
and
are unrelated variety and related variety, respectively;
is the natural logarithm of population density;
is a series of regional control variables outlined previously and country dummies. The coefficient
allows us to test Hypothesis 1, and if significant and positive implies that specialization increases employment risk of automation.
and
allow us to assess Hypotheses 2 and 3. If
and
are negative, this provides support for Hypothesis 2, and if
has a more negative effect on automation risk than
, this provides support for Hypothesis 3.
allows us to test Hypothesis 4. If this coefficient is significant and negative it implies that more dense regions have lower exposure to automation risk.
Our model is estimated in stages, with additional controls added at each point, as discussed below. We utilize ordinary least squares (OLS) to estimate equation (1) while including country fixed effects and robust standard errors.
RESULTS
presents the results of our analysis. The OLS estimation of equation (1) is presented in column (I). Additional specifications of the results whilst controlling for broad sectors (II) and occupational sectors (III) are also presented. Across all estimations the results are broadly consistent in terms of the signs and significance of the coefficients.
Table 2. Results of models.
Beginning with Hypothesis 1, which hypothesized that specialized regions are more vulnerability to job automation, the coefficients across all models for the Herfindahl index are statistically insignificant. This suggests that specialization has no impact on the degree to which regions are exposed to potential job automation. As noted previously, sectors concentrated in routine activities and physical tasks in predictable environments are predicted to be particularly vulnerable to job automation (Frey & Osborne, Citation2017). The Herfindahl index does not make a distinction between sectors which are characterized by routine activities and physical tasks and those which are more creative and require critical thinking. What this analysis suggests is that specialization itself is not a predictor of automation risk; however, in model (III), which considers concentration in certain occupations, we do observe that specialization in certain, distinct occupations poses an increased risk of automation. For example, regions with a higher concentration of employment in occupations such as clerical support workers, and plant and machine operators and assemblers are more exposed to potential job automation. This suggests that it is specialization in certain occupations, rather than specialization itself, which may explain automation exposure.
Regarding Hypothesis 2, which proposed that related and unrelated variety lower vulnerability from job automation, we find partial support for this hypothesis. Related variety is found to be statistically insignificant across all models; however, unrelated variety is consistently statistically significant and negative across our models. This suggests that higher levels of unrelated variety are associated with lower job automation risk in regions, while related variety is neither associated with higher or lower job automation risk in regions. The finding on unrelated variety, and its greater impact on automation risk than related variety, is not surprising and provides support for Hypothesis 3. Unrelated variety is hypothesized to provide a greater ‘industry portfolio’ insulating regions from external shocks such as automation.
Regarding Hypothesis 4, which proposes agglomeration effects related to density lowers vulnerability from job automation, we find significant negative coefficients present for population density across all models. The results indicate that more populously dense regions are at lower risk of job automation. This finding is partly consistent with that of Frank et al. (Citation2018) who note that smaller agglomerations are predicted to be more vulnerable to automation in the future.
When this is combined with insights from our control variables, one can observe that regions with larger pools of better educated workers are also at lower risk. These latter results reinforce and support the literature highlighting the importance of agglomeration forces in explaining regional vulnerability, resilience and growth (Glaeser & Gottlieb, Citation2009).
We now turn to our control variables. Regarding the proportion of the workforce engaged in creative occupations, we identify a consistently negative effect across all specifications as is to be expected. This finding on creative occupations lends additional support to the argument by Cooke and De Propris (Citation2011) that cultural and creative industries have a crucial role to play in supporting a balanced industrial mix for resilient regions in Europe. The results from model (I) indicate that the regional innovation systems index is significant and positively related to higher automation risk. However, this factor loses significance once broad sectors and occupational categories are controlled for in models (II) and (III). Similarly, regions with higher GDP per capita are significantly associated with lower regional job automation risk, but once sector and occupational groupings are controlled for, this significance disappears. This suggests that regions with a greater proportion employed in services is driving this pattern. The proportion of males in the region is also associated with higher job automation risk (in model I), but again once broad sectors and occupational categories are controlled for, this significance disappears. Considering that occupational automation risk is related to underlying sectoral composition, it is not surprising that we see the clustering of automation risk at a broad sectoral level and by occupational grouping. When we control for these factors in models (II) and (III), workers in agriculture and manufacturing sectors are associated with higher risk, relative to their service counterparts. The sectors of agriculture and manufacturing have undergone significant transition from once labour-intensive industries to industries now dominated by mechanization and power-intensive production systems and continue to be the most susceptible sectors to automation (Nedelkoska & Quintini, Citation2018). Workers in the occupational groupings of clerical support workers, craft and related trade workers and plant and machine operators are at higher risk relative to their counterparts in managerial occupations. This result can rationally be decomposed down to the narrow and low complexity of tasks underpinning these types of jobs giving rise to routine work in more predictable environments. Finally, we note a negative sign on the unemployment coefficient, which in models I and II suggests that the risk of automation is lower in the regions where there is a high level of unemployment. A relatively low risk of automation in a region may reflect the fact that automation technologies have already been implemented successfully in the affected region. However, this relationship loses significance once occupational groupings are controlled for in model III.
In order to ensure the validity of our results, we perform several robustness tests to ensure our interpretation of our coefficients are not sensitive to model specification or the inclusion or exclusion of variables. Interested readers can examine these in Appendices F and G in the supplemental data online.
CONCLUSIONS
Automation and AI are not the same thing, although in the current technological climate their distinctions look increasingly blurred, especially in the domain of robotization. Consideration therefore needs to be given to the profound shifts underway in these broad technological regimes, which are often collectively termed as ‘Industry 4.0’. Relatively little is known about the comparative advantages of regions in this regard (Ciffolilli & Muscio, Citation2018). Using Frey and Osborne’s (Citation2017) definition of automation, the types of occupations at lower risk of automation are characterized as non-routine, require judgements and the ability to adapt to changing circumstances. This article identifies that the geography of low-risk jobs is varied across Europe, with regions in Central and Northern Europe containing higher proportions of low-risk jobs. The places with the greater ability to adapt to the automation shocks of Industry 4.0 are those which are more diversified (in the specific sense of unrelated variety) and with higher population densities and higher shares of knowledge and creative workers. Our analysis suggests that these types of regions are less vulnerable to potential automation shocks. We suggest this may be attributed to the portfolio effect of Jacobs externalities, where separately agglomeration effects related to density also act as a mitigating factor providing diverse and highly populated regions security in the face of a technological shock that will impact all industries and occupations, albeit at different intensities.
Policymakers looking to transform the regional resilience of their region in the longer run, at least throughout Industry 4.0, could focus on encouraging entrepreneurship, labour mobility and research collaborations from unrelated industries and involving actors with unrelated competencies (De Propris & Bailey, Citation2020), whilst at the same time implementing horizontal policies targeting aspects of places rather than sectors specific to the region (Nathan & Overman, Citation2013).
An ongoing regional policy concern is to enhance local human capital and skills (McCann & Ortega-Argilés, Citation2015). We identify that regions with higher proportions of clerical support workers, craft and related trade workers, and plant and machine operators and assemblers may face greater disruption. Whilst occupations such as craft and related trade workers have competencies that enable them to tackle complex and unpredictable situations (Barzotto & De Propris, Citation2019), the skill mismatch between old and emerging sectors within a region and the geography mismatch between where jobs are lost and created may impact the employment transition of affected workers (Ghimire et al., Citation2020). Skills shortages are creating difficulties for four out of 10 employers in Europe and only 56% of employees report that their skills match their job (Panorama, Citation2016). Against this background, a focus on skills and occupational mix to develop the pool of skills necessary for regions to absorb technological innovations and harness productivity improvements should be an important component of any future EU industrial strategy (Barzotto & De Propris, Citation2019).
One particular challenge in transforming regional occupational knowledge and skills competencies is that non-core regions often have more specialized industrial structures, dominated by a few sectors, which are deeply embedded in the locale (McCann & Ortega-Argilés, Citation2015). Consequently, it will be unrealistic for many regions to pivot abruptly away from their hereto now path dependency. For this reason, it may make sense for specialized regions to (re)create a supply of competences and smart skill mix that reflect its underlying industrial structure but widen it with new and emerging technologies (Barzotto & De Propris, Citation2019; Martynovich & Lundquist, Citation2016). In essence, this may entail creating a step-change approach towards harnessing related varieties (McCann & Ortega-Argilés, Citation2015) before making connections between related and unrelated industries (De Propris & Bailey, Citation2020; Grillitsch et al., Citation2018).
Finally, regarding the future, the pace of adoption of new technologies such as automation is neither linear nor necessarily gradual. In the months immediately before the Covid-19 pandemic, there was some evidence of a slowing down in the rate at which companies were pursuing integrated digital strategies (McKinsey, Citation2020). In the short run it is many of Europe’s most prosperous cities and regions which are at the centre of the pandemic. However, the pandemic is also likely to increase the pace at which new automation technologies are adopted (Muro et al., Citation2020b) as recessionary shocks tend to increase the rate of adoption of new technologies. In these recessionary shocks, the introduction of new technologies such as automation disproportionately affects lower skilled workers, especially in more routinized activities in a range of sectors including services, manufacturing, food services and transportation, and in the types of regions typically specialized in these sectors (Muro et al., Citation2020b). In the long run our results suggest that there is no reason to assume that these patterns will be any different in the post-Covid-19 era (Muro et al., Citation2020a), although the rate of transformation may be even faster than many had until recently anticipated (Muro et al., Citation2020b). These technological and regional trends are likely to exacerbate the growing ‘geography of discontent’ evident in many European regions (Dijkstra et al., Citation2020; McCann, Citation2020).
Supplemental Material
Download PDF (350.7 KB)ACKNOWLEDGEMENTS
The authors thank the Editor-in-Chief, Professor David Bailey, and special issue editors, Professor Lisa De Propris and Professor Marco Bellandi, for their efforts in making this issue possible. The authors also thank the participants at the Industry 4.0: Disrupting Regions workshop, Birmingham Business School, December 2019, and the anonymous reviewers for their helpful comments to various versions of this paper.
DISCLOSURE STATEMENT
No potential conflict of interest was reported by the authors.
Notes
1. Indeed, this is already being observed in the context of AI and robotics. Firms involved in the research and development of core general-purpose technologies in AI are setting up in places that combine research and industrial activities related to them, indicating that a clustering and co-location pattern is already emerging in AI industries (Klinger et al., Citation2018). Industrial robotics, whilst global, is currently a concentrated industry, with robot-related foreign direct investment in the United States following a geographically concentrated pattern (Leigh & Kraft, Citation2018).
2. Such as the task-based approach by Nedelkoska and Quintini (Citation2018), who use the OECD’s Survey of Adults Skills (PIACC), which contains individual data that enables them to apply Frey and Osborne automation probabilities to the task make-up of jobs; and Dengler and Matthes (Citation2018) who also use a task-based approach but use occupational experts to assess automation risk for tasks specific in the German case.
3. The nine properties are: finger dexterity; manual dexterity; cramped workspace, awkward positions; originality; fine arts; social perceptiveness; negotiation; persuasion; and assisting and caring for others. For more information, see Frey and Osborne (Citation2017).
4. Subsequently we re-run our analysis excluding the UK for robustness, which produces no significant difference in our results.
5. ISCO-08 one-digit code of 1.
REFERENCES
- Acemoglu, D., & Restrepo, P. (2017). Robots and jobs: Evidence from US labor markets. https://papers.ssrn.com/sol3/papers.cfm?abstract_id=2941263
- Adermon, A., & Gustavsson, M. (2015). Job polarization and task-biased technological change: Evidence from Sweden, 1975–2005. The Scandinavian Journal of Economics, 117(3), 878–917. https://doi.org/https://doi.org/10.1111/sjoe.12109
- Arntz, M., Gregory, T., & Zierahn, U. (2016). The risk of automation for jobs in OECD countries. OECD Social, Employment and Migration Working Papers No. 189.
- Arrow, K. J. (1962). The economic implications of learning by doing. Review of Economic Studies, 29(3), 155–173. https://doi.org/10.2307/2295952
- Asheim, B. T., & Isaksen, A. (2002). Regional innovation systems: The integration of local ‘sticky’ and global ‘ubiquitous’ knowledge. The Journal of Technology Transfer, 27(1), 77–86. https://doi.org/https://doi.org/10.1023/A:1013100704794
- Audretsch, D. (2018). What works in innovation policy? New insights for regions and cities: Developing strategies for industrial transition. Background paper for an OECD/EC Workshop on 15 October 2018 within the workshop series ‘Broadening innovation policy: New insights for regions and cities’.
- Audretsch, D. B., & Feldman, M. P. (1996). R&D spillovers and the geography of innovation and production. The American Economic Review, 86(3), 630–640. www.jstor.org/stable/2118216
- Audretsch, D. B., & Fritsch, M. (2002). Growth regimes over time and space. Regional Studies, 36(2), 113–124. https://doi.org/https://doi.org/10.1080/00343400220121909
- Autor, D. H. (2015). Why are there still so many jobs? The history and future of workplace automation. Journal of Economic Perspectives, 29(3), 3–30. https://doi.org/https://doi.org/10.1257/jep.29.3.3
- Bakhshi, H., Freeman, A., & Higgs, P. L. (2013). A dynamic mapping of the UK’s creative industries. National Endowment for Science, Technology and the Arts (NESTA). http://eprints.qut.edu.au/57251/
- Balland, P.-A., Rigby, D., & Boschma, R. (2015). The technological resilience of US cities. Cambridge Journal of Regions, Economy and Society, 8(2), 167–184. https://doi.org/https://doi.org/10.1093/cjres/rsv007
- Barzotto, M., & De Propris, L. (2019). Skill up: Smart work, occupational mix and regional productivity. Journal of Economic Geography, 19(5), 1049–1075. https://doi.org/10.1093/jeg/lby050
- Basile, R., Pittiglio, R., & Reganati, F. (2017). Do agglomeration externalities affect firm survival? Regional Studies, 51(4), 548–562. https://doi.org/https://doi.org/10.1080/00343404.2015.1114175
- Beaudry, C., & Schiffauerova, A. (2009). Who’s right, Marshall or Jacobs? The localization versus urbanization debate. Research Policy, 38(2), 318–337. https://doi.org/https://doi.org/10.1016/j.respol.2008.11.010
- Boschma, R. (2015). Towards an evolutionary perspective on regional resilience. Regional Studies, 49(5), 733–751. https://doi.org/https://doi.org/10.1080/00343404.2014.959481
- Boschma, R., & Iammarino, S. (2009). Related variety, trade linkages, and regional growth in Italy. Economic Geography, 85(3), 289–311. https://doi.org/https://doi.org/10.1111/j.1944-8287.2009.01034.x
- Bronzini, R., & Piselli, P. (2009). Determinants of long-run regional productivity with geographical spillovers: The role of R&D, human capital and public infrastructure. Regional Science and Urban Economics, 39(2), 187–199. https://doi.org/https://doi.org/10.1016/j.regsciurbeco.2008.07.002
- Brown, L., & Greenbaum, R. T. (2017). The role of industrial diversity in economic resilience: An empirical examination across 35 years. Urban Studies, 54(6), 1347–1366. https://doi.org/https://doi.org/10.1177/0042098015624870
- Brülhart, M., & Mathys, N. A. (2008). Sectoral agglomeration economies in a panel of European regions. Regional Science and Urban Economics, 38(4), 348–362. https://doi.org/https://doi.org/10.1016/j.regsciurbeco.2008.03.003
- Brynjolfsson, E., & McAfee, A. (2014). The second machine age: Work, progress, and prosperity in a time of brilliant technologies. W. W. Norton.
- Bureau of Labor Statistics. (2012). Crosswalk between the International Standard Classification of Occupations (ISCO-08) and the 2010 Standard Occupational Classification (SOC).
- Cainelli, G., Ganau, R., & Modica, M. (2019). Industrial relatedness and regional resilience in the European Union. Papers in Regional Science, 98(2), 755–778. https://doi.org/https://doi.org/10.1111/pirs.12377
- Caragliu, A., de Dominicis, L., & de Groot, H. L. F. (2016). Both Marshall and Jacobs were Right! Economic Geography, 92(1), 87–111. https://doi.org/https://doi.org/10.1080/00130095.2015.1094371
- Carlino, G. A., Chatterjee, S., & Hunt, R. M. (2007). Urban density and the rate of invention. Journal of Urban Economics, 61(3), 389–419. https://doi.org/https://doi.org/10.1016/j.jue.2006.08.003
- Caroleo, F. E., & Pastore, F. (2010). The labour market impact of the EU enlargement. Springer.
- Castaldi, C., Frenken, K., & Los, B. (2015). Related variety, unrelated variety and technological breakthroughs: An analysis of US state-level patenting. Regional Studies, 49(5), 767–781. https://doi.org/https://doi.org/10.1080/00343404.2014.940305
- Ciccone, A. (2002). Agglomeration effects in Europe. European Economic Review, 46(2), 213–227. https://doi.org/https://doi.org/10.1016/S0014-2921(00)00099-4
- Ciccone, A., & Hall, R. E. (1996). Productivity and the density of economic activity. The American Economic Review, 86(1), 54–70. http://www.jstor.org/stable/2118255
- Ciffolilli, A., & Muscio, A. (2018). Industry 4.0: National and regional comparative advantages in key enabling technologies. European Planning Studies, 26(12), 2323–2343. https://doi.org/https://doi.org/10.1080/09654313.2018.1529145
- Content, J., & Frenken, K. (2016). Related variety and economic development: A literature review. European Planning Studies, 24(12), 2097–2112. https://doi.org/https://doi.org/10.1080/09654313.2016.1246517
- Cooke, P., & De Propris, L. (2011). A policy agenda for EU smart growth: The role of creative and cultural industries. Policy Studies, 32(4), 365–375. https://doi.org/https://doi.org/10.1080/01442872.2011.571852
- Coulibaly, S., Deichmann, U. K., Freire, M. E., Gill, I. S., Goh, C., Kopp, A. D., Lall, S. V., Montenegro, C. E., Packard, T. G., & Ross Larson, B. C. (2008). World development report 2009: Reshaping economic geography. The World Bank.
- Crespo, J., Suire, R., & Vicente, J. (2014). Lock-in or lock-out? How structural properties of knowledge networks affect regional resilience. Journal of Economic Geography, 14(1), 199–219. https://doi.org/https://doi.org/10.1093/jeg/lbt006
- Crowley, F., & Doran, J. (2019). Automation and Irish towns: Who’s most at risk? Working Paper, Spatial and Regional Economics Research Centre, University College Cork.
- de Groot, H. L., Poot, J., & Smit, M. J. (2016). Which agglomeration externalities matter most and why? Journal of Economic Surveys, 30(4), 756–782. https://doi.org/https://doi.org/10.1111/joes.12112
- de Groot, H. L., Poot, J., & Smit, M. J. (2009). Agglomeration externalities, innovation and regional growth: Theoretical perspectives and meta-analysis. In Handbook of regional growth and development theories (pp. 256–281). Edward Elgar. https://doi.org/10.4337/9781848445987
- De Propris, L., & Bailey, D. (2020). Industry 4.0 and regional transformations. Taylor & Francis.
- Dengler, K., & Matthes, B. (2018). The impacts of digital transformation on the labour market: Substitution potentials of occupations in Germany. Technological Forecasting and Social Change, 137, 304–316. https://doi.org/https://doi.org/10.1016/j.techfore.2018.09.024
- Dijkstra, L., Poelman, H., & Rodríguez-Pose, A., (2020). The geography of EU discontent. Regional Studies, 54(6), 737–753. doi:10.1080/00343404.2019.1654603
- Doran, J., & Fingleton, B. (2018). US metropolitan area resilience: Insights from dynamic spatial panel estimation. Environment and Planning A: Economy and Space, 50(1), 111–132. https://doi.org/https://doi.org/10.1177/0308518X17736067
- Duranton, G., & Puga, D. (2004). Micro-foundations of urban agglomeration economies. Handbook of Regional and Urban Economics, 4, 2063–2117. https://doi.org/https://doi.org/10.1016/S1574-0080(04)80005-1
- European Commission. (2018). Key lessons from national Industry 4.0 policy initiatives in Europe. https://ec.europa.eu/digital-single-market/en/fourth-industrial-revolution
- Eurostat. (2019). Quality report of the European Union. Labour Force Survey 2017. Publications Office of the European Union.
- Ezcurra, R. (2011). Unemployment volatility and regional specialization in the European Union. Regional Studies, 45(8), 1121–1137. https://doi.org/https://doi.org/10.1080/00343401003713332
- Fingleton, B., Garretsen, H., & Martin, R. (2012). Recessionary shocks and regional employment: Evidence on the resilience of U.K. regions. Journal of Regional Science, 52(1), 109–133. https://doi.org/https://doi.org/10.1111/j.1467-9787.2011.00755.x
- Ford, M. (2015). Rise of the robots: Technology and the threat of a jobless future. Basic Books.
- Frank, M. R., Sun, L., Cebrian, M., Youn, H., & Rahwan, I. (2018). Small cities face greater impact from automation. Journal of the Royal Society Interface, 15(139), 20170946. https://doi.org/https://doi.org/10.1098/rsif.2017.0946
- Frenken, K., Van Oort, F., & Verburg, T. (2007). Related variety, unrelated variety and regional economic growth. Regional Studies, 41(5), 685–697. https://doi.org/https://doi.org/10.1080/00343400601120296
- Frey, C. B., & Osborne, M. A. (2017). The future of employment: How susceptible are jobs to computerisation? Technological Forecasting and Social Change, 114, 254–280. https://doi.org/https://doi.org/10.1016/j.techfore.2016.08.019
- Gates, B., Myhrvold, N., Rinearson, P., & Domonkos, D. (1995). The road ahead. Viking.
- Ghimire, R., Skinner, J., & Carnathan, M. (2020). Who perceived automation as a threat to their jobs in metro Atlanta: Results from the 2019 Metro Atlanta Speaks survey. Technology in Society, 63, 101368. https://doi.org/https://doi.org/10.1016/j.techsoc.2020.101368
- Glaeser, E. L. (2018). Framework for the changing nature of work. In World development report 2019: The changing nature of work. World Bank.
- Glaeser, E. L., & Gottlieb, J. D. (2009). The wealth of cities: Agglomeration economies and spatial equilibrium in the United States. Journal of Economic Literature, 47(4), 983–1028. https://doi.org/https://doi.org/10.1257/jel.47.4.983
- Glaeser, E. L., Kallal, H. D., Scheinkman, J. A., & Shleifer, A. (1992). Growth in cities. Journal of Political Economy, 100(6), 1126–1152. https://doi.org/https://doi.org/10.1086/261856
- Goos, M., & Manning, A. (2007). Lousy and lovely jobs: The rising polarization of work in Britain. Review of Economics and Statistics, 89(1), 118–133. https://doi.org/https://doi.org/10.1162/rest.89.1.118
- Goos, M., Manning, A., & Salomons, A. (2009). Job polarization in Europe. American Economic Review, 99(2), 58–63. https://doi.org/https://doi.org/10.1257/aer.99.2.58
- Grabher, G. (1993). The embedded firm on the socioeconomics of industrial networks. Routledge.
- Grillitsch, M., Asheim, B., & Trippl, M. (2018). Unrelated knowledge combinations: The unexplored potential for regional industrial path development. Cambridge Journal of Regions, Economy and Society, 11(2), 257–274. https://doi.org/https://doi.org/10.1093/cjres/rsy012
- Henderson, V. (1997). Externalities and industrial development. Journal of Urban Economics, 42(3), 449–470. https://doi.org/https://doi.org/10.1006/juec.1997.2036
- Hoover, E. M. (1937). Location theory and the shoe and leather industries. Harvard University Press.
- Jacobs, J. (1969). The economy of cities. Vintage.
- Ketels, C., & Protsiv, S. (2021). Cluster presence and economic performance: A new look based on European data. Regional Studies, 55(2), 208–220. doi:10.1080/00343404.2020.1792435
- Klepper, S. (1996). Entry, exit, growth, and innovation over the product life cycle. American Economic Review, 86(3), 562–583. http://www.jstor.org/stable/2118212
- Klinger, J., Mateos-Garcia, J. C., & Stathoulopoulos, K. (2018). Deep learning, deep change? Mapping the development of the artificial intelligence general purpose technology. SSRN Electronic Journal. https://ssrn.com/abstract=3233463 or http://dx.doi.org/10.2139/ssrn.3233463
- Krugman, P. (1991). History and industry location: The case of the manufacturing belt. The American Economic Review, 81(2), 80–83. http://www.jstor.org/stable/2006830
- Leigh, N. G., Kraft, B., & Lee, H. (2020). Robots, skill demand and manufacturing in US regional labour markets. Cambridge Journal of Regions, Economy and Society, 13(1), 77–97. https://doi.org/https://doi.org/10.1093/cjres/rsz019
- Leigh, N. G., & Kraft, B. R. (2018). Emerging robotic regions in the United States: Insights for regional economic evolution. Regional Studies, 52(6), 804–815. https://doi.org/https://doi.org/10.1080/00343404.2016.1269158
- Malmberg, A. (1996). Industrial geography: Agglomeration and local milieu. Progress in Human Geography, 20(3), 392–403. https://doi.org/https://doi.org/10.1177/030913259602000307
- Marshall, A. (1920). Principles of economics (8th Ed.). Macmillan.
- Martin, R. (2012). Regional economic resilience, hysteresis and recessionary shocks. Journal of Economic Geography, 12(1), 1–32. https://doi.org/https://doi.org/10.1093/jeg/lbr019
- Martin, R., & Sunley, P. (2015). On the notion of regional economic resilience: Conceptualization and explanation. Journal of Economic Geography, 15(1), 1–42. https://doi.org/https://doi.org/10.1093/jeg/lbu015
- Martin, R., Sunley, P., Gardiner, B., & Tyler, P. (2016). How regions react to recessions: Resilience and the role of economic structure. Regional Studies, 50(4), 561–585. https://doi.org/https://doi.org/10.1080/00343404.2015.1136410
- Martynovich, M., & Lundquist, K.-J. (2016). Technological change and geographical reallocation of labour: On the role of leading industries. Regional Studies, 50(10), 1633–1647. https://doi.org/https://doi.org/10.1080/00343404.2015.1052062
- McCann, P. (2020). Perceptions of regional inequality and the geography of discontent: Insights from the UK. Regional Studies, 54(2), 256–267. https://doi.org/https://doi.org/10.1080/00343404.2019.1619928
- McCann, P., & Ortega-Argilés, R. (2015). Smart specialization, regional growth and applications to European Union cohesion policy. Regional Studies, 49(8), 1291–1302. https://doi.org/https://doi.org/10.1080/00343404.2013.799769
- McClure, P. K. (2018). ‘You’re fired,’ says the robot: The rise of automation in the workplace, technophobes, and fears of unemployment. Social Science Computer Review, 36(2), 139–156. https://doi.org/https://doi.org/10.1177/0894439317698637
- McKinsey, D. (2020). Managing the fallout from technology transformations. https://www.mckinsey.com/business-functions/mckinsey-digital/our-insights/managing-the-fallout-from-technology-transformations
- Melo, P. C., Graham, D. J., & Noland, R. B. (2009). A meta-analysis of estimates of urban agglomeration economies. Regional Science and Urban Economics, 39(3), 332–342. https://doi.org/https://doi.org/10.1016/j.regsciurbeco.2008.12.002
- Morgan, K. (2007). The learning region: Institutions, innovation and regional renewal. Regional Studies, 41(S1), S147–S159. https://doi.org/https://doi.org/10.1080/00343400701232322
- Muro, M., Maxim, R., & Whiton, J. (2019a, November). What jobs are affected by AI? Better-paid, better-educated workers face the most exposure. Brookings Metropolitan Program.
- Muro, M., Maxim, R., & Whiton, J. (2020a). The places a Covid-19 recession will likely hit hardest. Brookings Metropolitan Program.
- Muro, M., Maxim, R., & Whiton, J. (2020b, March). The robots are ready as the COVID-19 recession spreads. Brookings Metropolitan Program.
- Muro, M., Maxim, R., Whiton, J., & Hathaway, I. (2019b, January). Automation and artificial intelligence: How machines are affecting people and places. Brookings Metropolitan Program.
- Nathan, M., & Overman, H. (2013). Agglomeration, clusters, and industrial policy. Oxford Review of Economic Policy, 29(2), 383–404. https://doi.org/https://doi.org/10.1093/oxrep/grt019
- Nedelkoska, L., & Quintini, G. (2018). Automation, skills use and training. OECD Social, Employment and Migration Working Papers, No. 202. OECD Publ.
- Nooteboom, B. (2000). Learning and innovation in organizations and economies. Oxford University Press.
- Organisation for Economic Co-operation and Development (OECD). (2018). Job creation and local economic development 2018. https://www.oecd-ilibrary.org/content/publication/9789264305342-en
- Ottaviano, G. I., & Pinelli, D. (2006). Market potential and productivity: Evidence from Finnish regions. Regional Science and Urban Economics, 36(5), 636–657. https://doi.org/https://doi.org/10.1016/j.regsciurbeco.2006.06.005
- Panorama, S. (2016). Focus on skills challenges in Europe (Analytical Highlight Series). ICF GHK and Cedefop for the European Commission. https://skillspanorama.cedefop.europa.eu/en/analytical_highlights/skills-challenges-europe-2016
- Perez, C. (2010). Technological revolutions and techno-economic paradigms. Cambridge Journal of Economics, 34(1), 185–202. https://doi.org/https://doi.org/10.1093/cje/bep051
- Porter, M. E. (1990). The competitive advantage of nations. Harvard Business Review, 68(2), 73–93.
- Rodríguez-Pose, A. (2013). Do institutions matter for regional development? Regional Studies, 47(7), 1034–1047. https://doi.org/https://doi.org/10.1080/00343404.2012.748978
- Romer, P. M. (1986). Increasing returns and long-run growth. Journal of Political Economy, 94(5), 1002–1037. https://doi.org/https://doi.org/10.1086/261420
- Rosenthal, S. S., & Strange, W. C. (2003). Geography, industrial organization, and agglomeration. Review of Economics and Statistics, 85(2), 377–393. https://doi.org/https://doi.org/10.1162/003465303765299882
- Rosenthal, S. S., & Strange, W. C. (2004). Evidence on the nature and sources of agglomeration economies. In J. V. Henderson & J.-F. Thisse (Eds.), Handbook of regional and urban economics (Vol. 4, pp. 2119–2171). Elsevier. https://doi.org/10.1016/S1574-0080(04)80006-3
- Schmidt, E., & Cohen, J. (2014). The new digital age: Transforming nations, businesses, and our lives (p. 336). Knopf Doubleday.
- Susskind, R. E., & Susskind, D. (2015). The future of the professions: How technology will transform the work of human experts. Oxford University Press.
- Van Egeraat, C., Morgenroth, E., Kroes, R., Curran, D., & Gleeson, J. (2018). A measure for identifying substantial geographic concentrations. Papers in Regional Science, 97(2), 281–300. https://doi.org/https://doi.org/10.1111/pirs.12241
- Wolfe, D. A. (2010). The strategic management of core cities: Path dependence and economic adjustment in resilient regions. Cambridge Journal of Regions, Economy and Society, 3(1), 139–152. https://doi.org/https://doi.org/10.1093/cjres/rsp032