
 ?Mathematical formulae have been encoded as MathML and are displayed in this HTML version using MathJax in order to improve their display. Uncheck the box to turn MathJax off. This feature requires Javascript. Click on a formula to zoom.
ABSTRACT
This paper criticizes traditional models of urban–regional expansion, which depart from monocentric ideals of urban core and ring. The original spatial-cycle model (SCM) suggests repeating stages of urbanization, suburbanization, disurbanization and re-urbanization. We reconceptualize the relations between core(s) and ring(s) to test the formation of urban regions under mono-, multi- and polycentric trajectories. The analysis employs local population data in functional urban regions in Finland, Austria and the Netherlands, three countries with different urbanization patterns, for the period 1961–2011. Results suggest a ‘break of the cycle’ in polycentric regions and a shift towards a different period, which we call ‘syncurbanization’.
INTRODUCTION
Urban regions have for a long time been conceptualized as composed of an urban core surrounded by a suburban and rural hinterland, forming a coherent entity through functional, cultural and institutional interdependencies. From a demographic perspective, these interdependencies are often framed in hierarchical terms, described along a concentric ideal type, with population gradually decentralizing ‘from big central cities to adjacent smaller ones, old and new’ (Hall & Pain, Citation2006, p. 3). In the past, researchers have tried to capture demographic trends in urban regions by building generic models of demographic growth stressing this distinction between core and periphery. Most well-known is the spatial-cycle model (SCM) by Van den Berg et al. (Citation1982). It suggests that demographic growth differs in timing and intensity between core and ring, following a cyclical model of four stages: urbanization, suburbanization, disurbanization and re-urbanization. All four stages share the feature of a notably offset and sometimes counter-cyclical rise and decline development of core versus ring.
Models are reductionist by definition and there is evident advantage in using them to generalize how urban regions emerge. However, we find an increasing gap between textbook-type models and the urban–regional formation that takes place in a post-modern realm. Changes are due to societal advancement and economic globalization, featuring, amongst others, the spatial redistribution of economic activities, increasing mobility, pluralization of life courses, and the emergence of interdependent, polycentric urban systems (Capello, Citation2000; Champion, Citation2001; Scott, Citation2019; Weichhart, Citation2015). Through these drivers, urban areas are no longer just local but incorporate a regional dimension, as cities become embedded in larger multicentric metropolitan areas. Demographically, the concentric ideal model of an urban core surrounded by a suburban or rural ring around it, together forming a functional urban region (FUR) has become contested, especially in the more densely populated and maturely urbanized parts of the world. In increasingly networked regional structures, urban hierarchies and core–hinterland relations are becoming more diverse. The functional hinterland of any city is likely to comprise other cities as well as populated ‘in-between’ areas (European Observation Network for Territorial Development and Cohesion (ESPON), Citation2005; Hall & Pain, Citation2006) and classic urban indicators, such as population density or demographic heterogeneity no longer follow a descendent slope from core to periphery (Soja, Citation2011). As a consequence, urban–suburban–rural relations are complemented with complex urban–urban (or core–core) relationships, and even hinterland–hinterland relations, as low-density, sprawling areas of urban activity engage in mutual interaction (Balducci et al., Citation2017; Van Meeteren, Citation2016). Simple models based on core–periphery hierarchies have therefore been losing ground in research and policymaking. Yet, the monocentric urban region still provides the conceptual point of departure for applying the Van den Bergian SCM.
One of the most developed bodies of work to understand current urbanization is based on the concept of polycentricity, typically framed as functional and morphological polycentricity in regions consisting of several different centres and a shared in-between territory. For the sake of precision, while the reference to ‘multicentric’ used so far simply means that all urban regions entail multiple centres, regardless of size and importance, ‘polycentric’, as popularized in the term ‘polycentric urban region’ (PUR), is used to describe the special case of multicentric regions where all the centres have similar size and importance (Kloosterman & Musterd, Citation2001; Parr, Citation2004). We will use this distinction between multi- and polycentric henceforth in the paper. Research has produced insightful knowledge on the socio-economic constitution and spatial processes of PURs. However, the interest thus far has mostly focused on case studies, and, increasingly, cross-sectional empirical studies, which are time-wise static. There are not many longitudinal studies of how PURs are formed. Conceptually, Champion (Citation2001), and lately Shu et al. (Citation2019), provide alternative pathways to how (functional) urban regions emerge over time, although the application of their theoretical models to actual case studies has been limited. Additionally, unlike morphological and functional perspectives, questions of regional demographic development have not been a key part of polycentricity research. This is surprising because the population base is constitutive when defining and distinguishing a PUR from other forms of urban region. For example, Meijers et al. (Citation2018) identify 117 European PURs on the basis of a maximum variation of differences in population size between the cities of a PUR. Moreover, while absolute population numbers may say little about urban transformations, population change, especially over a long period of time, is both an influence on and a consequence of socioeconomic and spatial development processes (Turok & Mykhnenko, Citation2007), with the added advantage of being an indicator that can be easily compared across places and long time periods in a geographically detailed way. Therefore, there are deeper insights to explore into the demography of PURs, particularly their dynamics over time – which motivates this contribution.
Our specific aim is to relate PURs to models of demographic development. Therefore, we pose two research questions: (1) How is the distinction between urban cores and hinterlands changing over time in terms of demographic growth rates, in particular in multicentric urban regions and PURs? With the results of this first question, we further ask: (2) To what extent does the demographic development of multicentric urban regions and PURs represent an evolution from the monocentric-based SCM?
To answer these questions, we first discuss different demographic models of urban–regional formation, and the existing evidence for their accuracy. This leads to the formulation of four hypotheses linking polycentricity to these models. Our methodological approach to test these hypotheses is introduced in the third section, which describes the construction of a longitudinal dataset for Finland, Austria and the Netherlands in 10-year periods from 1961 to 2011. This selection allows one to compare different development trajectories, with Finland dominated by monocentric urbanization, the Netherlands by polycentric urbanization, and Austria taking a middle position, albeit definitely more monocentric than polycentric. Results are presented in the fourth section. In the conclusions, we return to the implications of a PUR perspective to the completeness of the four-stage SCM, and identify a new stage of urban development that appears to break the cycle: ‘syncurbanization’. After these academic findings, we close with possible implications for regional policy and planning.
THEORETICAL BACKGROUND: MODELS OF URBAN–REGIONAL FORMATION
Here, we present several generic models of urban region formation processes that focus on demographic patterns, making a distinction between mono- and polycentric models, before moving to an identification of the potential weaknesses of the spatial cycle model (SCM) in present times.
Monocentric models of urban–regional formation
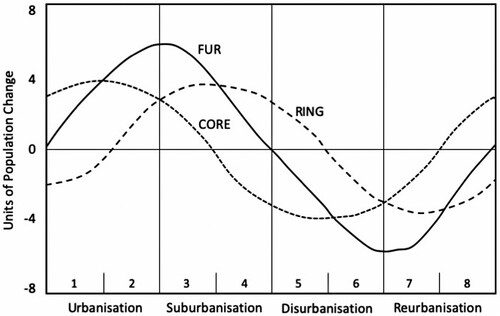
By scientific zeitgeist, the establishment of the SCM corresponds to late industrialization, say the mid-20th century. In their well-known model, Van den Berg et al. (Citation1982) provide a standard trajectory for the population base of an urban core and a ring in an FUR in four stages, illustrated by a repeating wave of (I) urbanization, (II) suburbanization, (III) disurbanization/counter-urbanization and (IV) re-urbanization (). In times of urbanization, first the core and later the ring grow. During suburbanization, the core loses population while the ring grows. Disurbanization features a declining core and ring. Re-urbanization entails a re-growth of the core and a slowly decreasing decline of the ring. This phase closes the cycle, eventually leading to stage I again. During the various stages, core and ring develop counter-cyclically at times, with a clear offset between rise and decline trends.
Figure 1. The spatial-cycle model (SCM).
Source: Adapted from Van den Berg et al. (Citation1982).
The Van den Bergian standard model has received much attention in urban and regional research.Footnote1 Empirical studies have searched for evidence of stages II and III in particular, and conceptual discussions criticized the outlook on a stage IV (Cividino et al., Citation2020; Nyström, Citation1992; Salvati et al., Citation2018). Parr (Citation2012) provides an alternative version of the SCM, criticizing the repeating nature of the standard model assumption that after stage IV a new stage I would start. His alternative version confirms the four stages but builds upon relative population change rates between core and ring, thus speaking of stages of decentralization and concentration within the FUR. With his alternative calculation of an SCM, Parr allows a spatially systemic view on demographic urban–regional development, rather than a single view, because one can display and compare several FURs in one figure and compare their development rates regardless of their size. In contrast to the strictly stepwise Van den Bergian standard version, Parr’s version also allows cities to remain in a certain stage, to step back or jump over to other stages. However, this alternative remains with four stages and departs from a monocentric perspective (urban core and ring).
Polycentric models of urban–regional formation
To understand how polycentric urban development relates to the SCM, we need to stress the different modes through which multicentric urban regions and PURs arise. Here, we refer to multicentricity simply as multiple urban cores existing in a functional region, and consider PURs a subclass of those, in which the relative size importance of urban cores does not differ too much (Kloosterman & Musterd, Citation2001). Hence, PURs are rather balanced urban systems and exist next to multicentric urban regions in which there is a clear hierarchical relationship between the cities.
Champion (Citation2001) presents a valuable theoretical argument around demographic development and PUR formation because he accounts for qualitative demographic changes, in terms of population and household structures. He juxtaposes two megatrends: (1) demographic structural changes (in Western Europe) towards higher life expectancy and lower fertility rates (resulting in an ageing society) and increasing amount and frequency of migration flows (resulting in a more mobile and diverse society, termed ‘second demographic transition’ by Van de Kaa, Citation1987); and (2) regional structural changes in terms of emerging polycentric patterns that supersede previous monocentric urban structures. Post-modern household patterns – involving an increasing importance of single households, patchwork families, fewer or changed multi-generation households and multi-local residence – attach theoretically better to PURs than to concentric, monocentric urban regions. Champion (Citation2001) distinguishes three modes of urban region formation. The first, ‘centrifugal mode’, resembles the regional characteristics of urban sprawl (Gordon & Richardson, Citation1996) in that a multicentric urban region originates from a single city that sprawls into the hinterland, leading to many sub-centres. The second, ‘incorporation mode’, refers to the situation in which a large urban centre expands to incorporate smaller centres in the surrounding area whose own growth patterns had been relatively independent in terms of employment, services and demographic trends. Cardoso (Citation2018) finds this similar to the trajectories of second-tier cities because of the flatter hierarchy between the core city and nearby centres, whose growth is less affected by the decentralization of the core, when compared with urban regions centred around a dominant capital city. A third, ‘fusion mode’, comes close to what Kling et al. (Citation1995) or Phelps and Wu (Citation2011) identify as post-suburbia. Here, the hinterlands of single, independent and relatively equally sized cities start to overlap in a way that these cities fuse into a PUR – this is the mode most likely to form PURs as defined here.
A recent contribution by Shu et al. (Citation2019) updates the conceptualization of how PURs form, without operationalizing a time dimension and intra-/interregional growth and decline. Overall, they present four routes of ‘polycentralization’, each going through five phases. Focusing on functional PURs – thus not considering morphological polycentricity – Shu et al. present a crossing of topographical/topological understanding and decentralization/coalescence routes. In a topographical understanding, the attributes of the centres (such as services, jobs) are key, while in a topological understanding, the flows (as in firm networks) are key. Decentralization points at the relative importance of sub-centres of a city; while coalescence describes a path of originally separated cities that become connected. A first phase is always ‘acentric’, that is, there is no centre of a region, all local units are isolated. From monocentric via multicentric to polycentric regions, a fully developed PUR is again acentric (stage II), this time on a higher, fully integrated, level, in the sense that former centres have been diluted into a continuous urban (functional) landscape: an ideal type ‘in which everywhere is hinterland/centre to everywhere’ (p. 9). This is close to the idea of centreless ‘fields’ replacing nodal ‘networks’ proposed in the metropolization project by Cardoso and Meijers (Citation2020), partly anticipated by the Zwischenstadt concept (Sieverts, Citation1997), a plea for attention to the in-between places outside ‘proper’ cities, and reaches its ultimate extension in Brenner and Schmid’s (Citation2014) models of planetary urbanization. In a similar vein, several authors in the economic geography tradition suggest that agglomeration benefits are no longer confined to cities as such, but spread as ‘externality fields’ over larger territories as a result of new technologies such as information and communication technology (ICT) (Burger & Meijers, Citation2016; Parr, Citation2002; Phelps et al., Citation2001). Shu et al. (Citation2019) suggest that the transformation over time from a monocentric to such a polycentric, field-like state is inevitable, merely being a matter of maturity of the urban system.
Polycentricity and demography
In light of these fundamental transformations in the processes of urban region formation and their demographic trends, as well as in the models designed to capture them, the question is whether the stages predicted by the SCM are empirically visible, and if so, where and to what extent. For the last decades we indeed witnessed an extensive stage II of suburbanization across European urban regions (Dembski et al., Citation2019; Kabisch & Haase, Citation2011). However, Van den Berg’s theoretical prediction of a stage III – a total population decrease of the whole FUR – has not taken place in Europe. Lately, and which was not seen as inevitable some time ago (Nyström, Citation1992), a stage IV of re-urbanization, featuring a regrowing core city, took shape, although this process is selective, dependent on active policy incentives, and sometimes reserved for the larger core cities. A deviating empirical experience in most European urban regions was that, unlike the model suggests, suburban areas actually grew during all stages, leading functional and demographic densification up to the point where the very notion of ‘suburban’ became contested (Andersen et al., Citation2011; Tzaninis & Boterman, Citation2018), in line with Shu et al., Citation2019. In addition, and again pointing to the role of policy rather than assuming a ‘natural’, structural principle governing the SCM, we can identify plenty of shrinking core cities in Europe (Wolff & Wiechmann, Citation2018).
Despite its monocentric point of departure stressing simple core–periphery relationships, it may not be too difficult to engage with these new developments and add a multicentric dimension to the SCM by identifying, next to a clear core city, several cities that were part of the suburban ring and have grown to prominence over the years. As Friedmann (Citation1966) mentioned, it is possible that those subordinate cities have their own core–ring dynamics with the nearby territory, independently of core city expansion. However, the overall demographics of a PUR are likely to be different from, and not reducible to, the sum of the core–ring demographics of these individual cities due to inter-city interdependencies within the PUR along the growth-shrinkage dimension – growth in one centre may trigger growth in some other centres, empty out others, and the overall result at the PUR scale may take a variety of forms in terms of direction, intensity, speed and timing. Based on that, a call for enhancing the SCM towards a polycentric understanding arises, for which we cannot build on a common ‘centre–periphery’ logic but rather a ‘centre–centre’ logic with ‘inner peripheries’ (Humer, Citation2018) in between, whose hierarchical relations to the various centres are not at the same level as in monocentric arrangements – these peripheries are not only connected by demographic flows to more than one centre simultaneously, but also they can engage in population exchanges with other peripheries over time, bypassing the existing centres altogether (Hall & Pain, Citation2006).
Therefore, in order to confront the departure assumptions and resulting stages of the SCM model with demographic trajectories at the scale of multicentric urban regions and PURs, we formalize four hypotheses to test empirically. The hypotheses examine the development of core, ring and FUR with a different emphasis, however always on an aggregate, systemic level. Hypothesis 1 compares the development of cores and rings; Hypothesis 2 examines the development of regional aggregates; Hypothesis 3 concentrates on ring growth rates; Hypothesis 4 focuses on core growth rates in different types of urban region.
Hypothesis 1 (cores and rings): The difference in demographic trajectories of cores and rings has become less pronounced over time, and may even have disappeared.
This relates to the field interpretation of metropolization, mentioned above, namely ‘spatial externality fields’, where far-reaching agglomeration effects would blur demographic, but also spatial, functional and socioeconomic distinctions between different forms of urbanization. Empirically, it relates to the aforementioned observation of continuous growth in (conventionally called) ‘suburban’ areas in European urban regions. Obviously, if this hypothesis were true, this would mean that a new and different phase of the SCM would need to be discerned, rather than the cycle starting again with phase I.
Hypothesis 2 (FURs): FURs that are part of larger multi-/polycentric metropolitan areas grow faster than FURs that are not part of such metropolitan areas.
The argumentation for this hypothesis is that being part of a larger metropolitan area translates into access to more benefits of agglomeration, which are assumed to spread over larger territories. The larger critical mass of multi-/polycentric metropolitan regions makes them more attractive (e.g., a larger labour market, more amenities and services within reach). This positive effect is likely to increase over time as the functional, cultural and institutional integration of these urban areas increases (Meijers et al., Citation2018). This hypothesis would introduce a systematic difference between monocentric and multi-/polycentric urban regions that the SCM, based on a generic FUR type, cannot capture.
Hypothesis 3 (rings): The ring areas in multi-/polycentric metropolitan areas are likely to grow faster than similar areas in isolated/monocentric FURs.
The argumentation for this hypothesis is that part of the ring will be in-between cities, thus providing easy access to multiple centres. This makes rings in multi-/polycentric metropolitan areas more attractive to live in – for postmodern societies experiencing the second demographic transition – than truly ‘suburban’ rings on the outskirts of single cities. As above, due to growing integration of multi-/polycentric areas (transport, etc.), the gap between growth rates in these rings and those in monocentric areas may have increased over time. Confirming this hypothesis would implicate a new type of ‘hinterland’ or ‘ring’ with multiple and overlapping relations whose characteristics are not included in the categorical distinctions of the SCM.
Hypothesis 4 (cores): Smaller urban cores in (unbalanced) multicentric metropolitan areas are likely to grow slower than the respective prime city, whereas urban cores in (balanced) polycentric metropolitan areas are less likely to experience a negative effect on demographic growth.
The argumentation for this last hypothesis is that larger cities tend to cast an agglomeration shadow over smaller cities, whereas equally sized neighbours do not cast such a shadow. This has been proven for urban functions (Burger et al., Citation2015; Cardoso & Meijers, Citation2016), but it is unclear whether this also holds for population growth, which can be unrelated to functions. In parallel to the previous hypothesis, this one would reveal the need to differentiate core typologies beyond the single denomination present in the SCM.
DATA AND RESEARCH APPROACH
Our hypotheses demand a diachronic analysis of the demography of PURs, which (1) distinguishes between mono-, multi- and polycentric FURs, in connection to (2) a differentiation between cores and rings (or hinterlands) and (3) their embeddedness in larger multi- or polycentric metropolitan areas, while (4) covering a long period of 50 years. The time period accounts for the longue durée of demographic transition of societies (Van de Kaa, Citation1987). We compare demographic trends in three countries of similarly advanced societal development, however with different urbanization patterns, in order to check whether results for the link between polycentricity and demography are context related: Finland, Austria and the Netherlands. Finland has a vastly monocentric urban system, Austria a medium polycentric one, and the Netherlands a vastly polycentric one – at both the regional (Meijers et al., Citation2018) and national levels (Waterhout et al., Citation2005).
We consider two spatial scales – first, the FUR, and then whether these FURs are part of a larger metropolitan area. The identification of FURs was taken from the ESPON 1.4.3 project (ESPON, Citation2007) – there referred to as functional urban areas (FUAs) consisting of at least one morphological urban area (MUA) plus surrounding local units that exceed minimum thresholds of commuting towards the MUA. An MUA can be composed of multiple smaller jurisdictions when they form one contiguous built-up area. To distinguish between urban cores and rings – which is required in order to apply the SCM – we declare all MUA municipalities as part of the urban core, while all remaining ‘non-MUA’ municipalities of an FUA are part of the ring. Note that we use this ‘fixed geography’ classification throughout the study period, which is needed for consistency in definitions, but be aware that some FURs will have changed slightly over the study period.
In addition to the FUR scale, we also consider whether they are part of a larger metropolitan area. For this, we take the poly-FUA definition (ESPON, Citation2007). Poly-FUAs are constructed when contiguous FURs are merged based on criteria such as city sizes and distances between them. For instance, large cities (> 500,000) positioned less than 60 km apart with labour basins touching each other were merged, while for smaller cities this threshold was set at 30 km. In reality, these commuting zones will not just touch, but overlap. Obviously, such larger metropolitan areas are by definition multi- or polycentric since they contain multiple urban cores.Footnote2
For both the FUR and the metropolitan area scale, we calculated the level of mono-, multi- or polycentricity. For this, we use the method proposed by Meijers et al. (Citation2018), based on the Herfindahl index. This index is most commonly applied as a measure of competition in the framework of antitrust laws preventing the rise of monopolies from firm mergers. As such, measuring ‘primacy’ is its essence, which parallels nicely with the basic idea that polycentricity is about the lack of a primate city. It is computed as:
where si is the population share of city i in the total population of all cities (MUAs here) in the region; and N is the number of urban centres in the region. Scores range from 1/N to 1. The advantage of this measure is that it allows for easy interpretation: fully monocentric urban regions will have a score of 1. Multicentric urban regions or metropolitan areas have a score < 1, and according to Meijers et al. (Citation2018), those with a score of ≤ 0.56 should be considered as having a balanced urban system, which is why we will refer to them as ‘polycentric’. The scores between 0.56 and 1 are classified as multicentric urban regions or metropolitan areas. These are still characterized by a dominant urban core and secondary cities. Note that this way, for instance, a monocentric FUR can be part of a larger polycentric metropolitan area. provides a visualization of our delimitation, while provides an overview of the occurrence of mono-, multi- and polycentricity in Austria, Finland and the Netherlands.
Figure 2. Classification of urban regions and metropolitan areas.
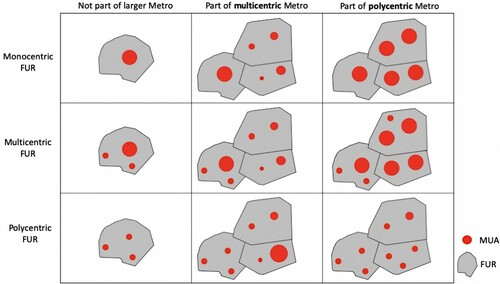
Table 1. Number of functional urban regions (FURs) (municipalities in parentheses) per class in Finland, Austria and the Netherlands.
Finally, the basic unit of analysis are municipalities (local administrative unit (LAU)-2), and Eurostat provided harmonized data on the total population for each municipality in 10-year steps from 1961 to 2011. Municipal mergers, name changes and other events affecting the LAU-2 units over the years were accounted for. We compare population growth rates for each decade covered, and for the overall period 1961–2011 in our models. Comparative studies mostly fail to build upon morphological and functional delineations (Dembski et al., Citation2019, p. 8), which weakens the explanatory value of results concerning ring (hinterland, suburban) development and interregional relations. By achieving a combination of LAU data from Eurostat and the FUA delineation from ESPON, the method is close to the theoretical core of the SCM.
Finland consists of monocentric FURs only, with the exception of the cross-border FUR involving the three MUAs of Kemi, Tornio and Haparande (Sweden), with Simo as the ‘ring’. Note that Austria also includes municipalities in Switzerland and Germany which are part of cross-border FURs (Bregenz–Lindau; Dornbirn–Lustenau). The polycentric metro areas in Austria are Klagenfurt–Villach–Wolfsberg and Linz–Wels–Steyr.
RESULTS AND DISCUSSION
Hypothesis 1: The different demographic trajectories of core and ring have become less pronounced over time, and may even have disappeared
Basically, testing this hypothesis implies testing the SCM, and therefore we visualize the trajectories of growth and decline of urban cores and rings over time (). For comparison with the stages of the SCM, we carry out this analysis at the FUR scale. We include a baseline depicting the national average growth in each period. We rely our calculations on Parr’s (Citation2012) alternative to the regular SCM: population change rates per unit. Therefore, it is not directly about (absolute) growth and decline but about (relative) centralization and decentralization between cores and rings over time.
Figure 3. Population change rates in Finland, Austria and the Netherlands, functional urban region (FUR) cores and rings.
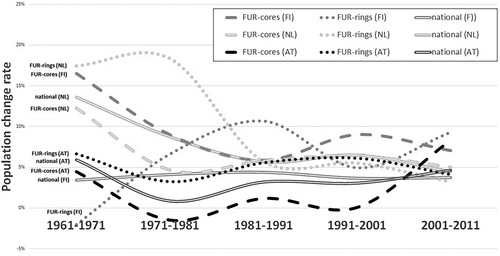
The general growth trajectories of city regional cores and rings differ per decade and country. Overall, FUR rings have been growing nearly all the time (i.e., have been over the 0% line). This confirms earlier studies that could not detect a clear stage III of disurbanization. In Finland, cores and rings show a clear counter-cyclical development across the decades. Constantly, since 1971, both urban cores and urban rings exceed by far the national average development, which points at a high development rate of urban regions compared with the rest of the country. In Austria, FUR rings were growing quicker than cores until 2001. Thus, we may speak of an enduring stage II suburbanization, with signs of some stage III disurbanization due to shrinking/stagnating cores in the 1970s and 1990s. From 2001 onwards, however, Austrian urban cores grew faster than rings, which matches with a stage IV re-urbanization. The Netherlands experienced a stage II suburbanization from the 1960s until the 1980s.Footnote3 Suburbanization happened more intensely than in Finland and Austria. Since the 1990s, Dutch urban cores and rings continued to grow equally and synchronically on a low level – which is strikingly different from Finnish and Austrian FURs – and which is obviously not following one of the four stages of the SCM. It might be at best described as an enduring shallow stage IV re-urbanization because the cores have consistently higher growth rates than the rings, but the time lag and periods of counter-cyclical trends have disappeared. In Austria, national level growth rates were for a long time in between the rates of urban cores and rings; this only changed after 2001. In contrast, FUR rings, cores and the national growth rates in the Netherlands have met and stayed in relative synchrony from the 1980s on, which suggests that there are hardly any areas in the country outside some form of extended urban region and that the Netherlands is almost fully urbanized.
Finland is an empirical illustration of the (recurring) waves of the SCM, while Austria shows a very lengthy cycle, recently entering stage IV: re-urbanization. However, the Netherlands seems to have passed the counter-cyclical development of cores and rings, including stage IV. It seems to go beyond the four stages of the SCM towards a condition of continuous urbanization, varying only in morphology and intensity, and dissolving contrasts between cores, rings and places within and outside conventional FURs. This evolution is closer to the functional ‘Acentric II’ final stage in the model by Shu et al. (Citation2019), limited only by faster growth in a handful of attractive centres, for which further research could be carried out to see which factors make them stand out (e.g., capital city effects). But the overall principle was already part of Friedmann’s (Citation1978) ‘urban field’ concept, whose key ideas have been recently revitalized for the European context by the claim about the ‘end of urbanization’ by Andersen et al. (Citation2011) and the work on metropolization processes by Cardoso and Meijers (Citation2020).
Overall, the SCM does indeed have value to interpret the demographic trajectories of FURs in European countries. Yet, we are approaching some limits of the model, as evidenced by the Netherlands. First, because the distinction between core and ring becomes much less pronounced, and trends seem to synchronize in time and direction. Second, because we are reaching a state of maturity, or perhaps better, saturation, of urbanization levels in many countries, as almost everyone is already living in urban regions. This makes a return to a stage I (urbanization), as the cycle suggests, unlikely.Footnote4
The analysis from this point on will only cover the cases of Austria and the Netherlands, since Finland is a prototypical country of monocentric urban regions – with one exceptional case of the PUR around Tornio at the Swedish–Finnish border ().
Hypothesis 2: FURs that are part of larger multi-/polycentric metropolitan areas grow faster than FURs that are not part of such metropolitan areas
We first test this through two simple boxplots, one for the Netherlands (a) and one for Austria (b), presenting the population growth between 1961and 2011. Recall that not all categories were present in Austria. In the Netherlands, we exclude growth centres – generally satellite towns that were identified as growth poles by the government – due to their extreme outlying values.
Figure 4. Population growth in (a) Dutch and (b) Austrian mono-, multi- and polycentric urban regions, 1961–2011.
Note: In (a), outlying values (Barendrecht and IJsselstein) are not depicted (in both the polycentric functional urban region (FUR) and part of a larger metro).
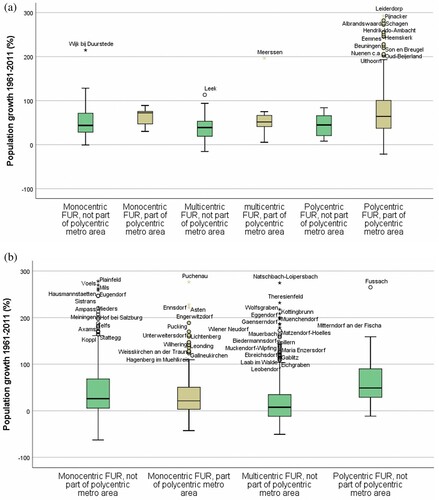
For the Netherlands, there is no difference among FURs that are either mono-, multi- or polycentric. However, it appears that municipalities in any of the three types of FUR that are part of a larger metro area grow faster than those located in an isolated FUR, introducing indeed a differentiation to FURs related to their position in the larger spatial scale. For Austria, over the entire study period, polycentric FURs grew slightly more than multicentric FURs. As to the difference that being part of a larger metro area makes, we can only compare it for monocentric FURs, since there are no multi- or polycentric FURs that are part of such an area. Unlike the case of the Netherlands, being in a larger metro area does not bring much difference in growth rates in these FURs. What Austria and the Netherlands have in common, though, is that multicentric FURs, characterized by a dominant urban core next to other cores, grew slower than polycentric FURs with balanced urban centres. We will consider the intra-regional dynamics of both types of regions in more depth when addressing Hypothesis 4.
Hypothesis 3: The ring areas in multi-/polycentric metropolitan areas are likely to grow faster than similar areas in isolated/monocentric FURs
provides the average growth for ‘hinterland’ municipalities distinguishing between those belonging to a FUR that is part of a larger metro area versus those that are not, irrespective of mono- or polycentricity at FUR scale. This appears in the first two data rows for each country. Then, to separate monocentric and multi- or polycentric FURs, we also present results where we compare the average growth rates of municipalities located in monocentric FURs with municipalities located in the hinterland of a multi- or polycentric FUR, this time irrespective of whether or not they are part of a multi-/polycentric metropolitan area (last two data rows per country).
Table 2. Polycentricity and the growth of hinterland areas.
The results for the Netherlands show that over the entire study period, what we could call ‘polyhinterlands’ – that is, hinterlands that are in the sphere of influence of multiple cities – grew significantly faster in population (+68.8%) than those that are just in the hinterland of one urban core (+41.9%). The difference between municipalities in the hinterland of larger metro areas versus those hinterland municipalities that are not part of a larger metropolitan area is even more substantial (74.6% versus 40.1%). This confirms our hypothesis. If we take a more detailed look, it is evident that differences in demographic growth rates converge over time in the four combinations studied, becoming insignificant in the 1990s – which runs counter to our expectation.
For Austria, the pattern is remarkably opposite. Here, municipalities in the hinterland of just one city (significantly) outperformed those in the hinterland of multiple cities (41.6% versus 25.3%). This growth gap has decreased over time, and turned insignificant after the year 2000. There is no significant difference between the growth of hinterland municipalities that are part of larger metropolitan areas, or not.
These mixed results obviously do not allow to draw final conclusions regarding our hypothesis; in general, in static terms it fits with differences in growth rates in the Netherlands, while in dynamic terms, the tendencies in Austria fit somewhat better. If the trajectories of cores carry more explanatory value than those of rings, we follow up with the fourth hypothesis.
Hypothesis 4: Smaller urban cores in (unbalanced) multicentric metropolitan areas are likely to grow slower than the respective prime city, whereas urban cores in (balanced) polycentric metropolitan areas are less likely to experience a negative effect on demographic growth
Testing this hypothesis requires comparing the development of primary and secondary cities in multi- and polycentric FURs, which is what the boxplots in do. Obviously, monocentric FURs do not have secondary centres, so such FURs are excluded. While defining ‘primary’ and ‘secondary’ cities in PURs runs counter to our own definition, we opted to keep the multi- versus polycentric comparison consistent by simply identifying the largest city in the PUR, even if slightly so. Since we are comparing cores, we do not use municipalities, but contiguous built-up areas (MUAs) as units of analysis. Note that the scaling of the population growth variable (y-axis) differs – our interest is in the comparison between the bars. We only cover the Netherlands, since in Austria there were not enough secondary cities in FURs to warrant meaningful further analysis.
Figure 5. Population growth in first and second cities over time: comparing multi- and polycentric functional urban regions (FURs) in the Netherlands.
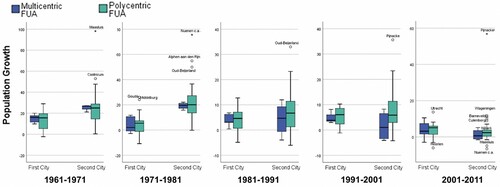
In the 1960s and 1970s, secondary cities in multicentric FURs were clearly gaining from their proximity to the core, apparently borrowing size from the larger scale to boost their growth rates. Later, however, the trend shifted and large core cities enjoying re-urbanization processes began to grow more than their smaller neighbours. These started experiencing a form of agglomeration shadow when core city growth limits their own opportunities. In polycentric FURs, smaller cities were also growing faster than the main city in the 1960s and 1970s, and not too differently, on average, than their counterparts in multicentric FURs. Two phenomena became visible since the 1980s though. First, secondary cities in polycentric FURs started to grow faster than those in multicentric FURs. Second, they were able to keep up with the growth level of the main city – they did not experience an agglomeration shadow, as could be expected from the less pronounced size differences between prime and secondary cities. Overall, our analysis suggests that secondary cities in multicentric FURs are more volatile than in polycentric FURs, experiencing major shifts in their growth rates presumably depending on the core city trends and expansion agenda. By contrast, there is greater stability, for better and for worse in what growth is concerned, in polycentric FURs.
DISCUSSION AND CONCLUSIONS: THE SHIFT TOWARDS A PERIOD OF SYNCURBANIZATION?
This paper relates polycentricity to models of demographic growth trajectories, searching for patterns in how PURs differ from multi- or monocentric urban regions in demographic terms, thereby engaging critically with the current validity of the SCM. Starting from the assumption that growth trajectories in urban cores and hinterlands depart from the expectations of existing core–periphery models when we analyse PURs, we developed a series of hypotheses to test demographic development under polycentricity. Our results can be summarized as follows:
Growth differentials between core and hinterland
The distinction in demographic growth between urban core and hinterland decreased over time, especially in polycentric contexts. The SCM of Van den Berg et al. (Citation1982) has proven its value in the past, and still allows to position population trends in Finland and Austria, but no longer holds in the Netherlands, where polycentricity is common. Here, we see a form of synchronized development – which we call ‘syncurbanization’ in the spirit of the SCM nomenclature. Syncurbanization is a period where core and ring follow similar demographic trends, in terms of direction, timing and intensity, over longer periods of time. This could be explained through agglomeration externalities no longer being confined to urban cores, but rather spreading over larger territories, with other urban cores in the hinterland acting as extension points of such ‘agglomeration externality fields’ and allowing the population to spread more equally across the territory.
Growth differences between mono-, multi- and polycentric urban regions
In the Netherlands, municipalities in more monocentric urban regions initially grew faster than those in multicentric urban regions or PURs, but this effect disappeared over time. However, an important distinction is whether these FURs are part of a larger metropolitan area. Municipalities in FURs in such metropolitan areas grew faster in the 1980s and 1990s than those in isolated FURs. However, after 2001, this effect also disappears, and the explanation may be, as above, that a large part of the Dutch territory is now spatially and demographically ‘synchronized’ under an agglomeration externality field, in which location does not matter so much to tap into the benefits associated with proximity. As could perhaps be expected given the different shape of its urban system, Austria developed in a different way. Here, more PURs grew faster, and being part of a larger polycentric metropolitan area was also generally positive, except for the last decade studied. This signals a potentially multiplicative interaction between different spatial scales of polycentricity (at least during some periods), and the definition of those scales may have an impact on to the assumptions about the benefits and costs of polycentricity.
Growth differentials between hinterlands in multi- or polycentric regions and hinterlands in monocentric regions
Hinterlands in the sphere of influence of multiple cities grew significantly faster than those in the hinterland of just one core in the polycentric Dutch urban system. Differences have disappeared in both countries, but in Austria it used to be the other way around: municipalities in the hinterland of a monocentric urban region grew faster than those in the hinterland of multiple cities. An explanation for this opposite trend might be the low number of multi- and polycentric FURs in Austria. Also, those FURs are mostly across or close to national borders, which calls for deeper investigation of cross-border FURs in future research.
Growth differentials between main and secondary cities in multicentric urban regions and PURs
Secondary cities in PURs grew faster than secondary cities in multicentric FURs, especially in recent decades, and, importantly, suffered fewer major shifts in their growth rates, suggesting a weaker role of the core on the FUR trajectories. Differences in main cities are less pronounced, but it is striking that main cities in multicentric urban regions do not grow faster than the largest city of PURs. In other words, larger, dominant cities cast a strong influence over other cities around them when it comes to population growth, but the apparent agglomeration shadow in recent decades does not mean expressive growth in these core cities – when compared with cities in polycentric FURs, they are not gaining from being larger and more dynamic than their neighbours.
This paper does not present just one set of conclusions about the hypotheses, as Finland and Austria often exhibit different population trajectories than the Netherlands. This may be due to a variety of reasons. One ‘evolutionary’ interpretation would be that all urban systems eventually mature – or rather saturate – as increasingly polycentric and synchronized, and the Netherlands is simply further ahead, having moved beyond the SCM into a new urbanization period. Under that interpretation, Austria would be lagging behind the Netherlands by one or two decades. This would be a very interesting phenomenon and future observations can give us more indications of the general development trends of European urban systems. But more mundane explanations for the differences are also possible. For instance, there is no abundance of multicentric urban regions or PURs in Austria, making the analysis vulnerable to specific geopolitical, social or economic conditions in individual cases. Perhaps travel times – partly subject to the topography – mean that polycentric metropolitan areas in Austria are less integrated than in the Netherlands (an important explanatory factor for their performance, as shown in Meijers et al., Citation2018).
However, the different trends may simply confirm that polycentricity is a more dominant characteristic of the Dutch urban system, and one could argue that because of this, findings for the Netherlands illustrate better the relation between polycentricity and new demographic modes than those for Austria or Finland. Future research can therefore look into other European countries with similarly polycentric systems and check whether our findings hold in those cases, in which case our hypothesis would be better justified: Is the gradual erasure of growth rate differences between cores and rings, as well as mono-, multi- and polycentric regions, a general feature of all mature urban systems, constrained only by a time lag in urban development in different countries? Is Europe overall on this trajectory, even if countries phase into such a state of ‘syncurbanization’ at different times? The ability to anticipate such a process would have an important impact on spatial planning and sustainable development policies.
Our rather explorative and descriptive analysis certainly needs to be extended, and we see different avenues to overcome its limitations. First, we need to address endogeneity issues more clearly to avoid bias related to the fact that metropolitan areas may become polycentric through public policy-designated population growth, rather than being associated with growth for being polycentric. Even though this issue may hold more for studying polycentricity at the urban rather than the regional scale addressed here (with centres defined as pockets of employment or economic activity rather than individual cities as in our case), we cannot fully exclude this. However, by controlling for institutionally designated growth poles, we tried to reduce this possible bias. Second, the long-term perspective adopted in this paper and applied similarly to three countries involved some data limitations, meaning that our simple models did not yet include many other possible drivers of population growth, for which we could not control. This is a challenge for future research. Third, detailed case studies of PURs would be welcome, which could reveal the political dimension of demographic trajectories, as local government budgets may be tied to population numbers through local tax income. This could also allow more spatial detail, for instance, distinguishing more precisely which hinterland areas in between cores grow faster. Finally, additional sociodemographic and socio-cultural indicators could be of interest, for instance, studying qualitatively PUR formation through changing household structures, age, and sex structures in cores and rings (cf. Brenner, Citation2013; Champion, Citation2001; Van de Kaa, Citation1987).
To conclude, does this new phase of urban–regional development that we call syncurbanization mark the end of the SCM? The empirical analysis has proven the SCM’s lasting validity under monocentric conditions (Finland, partly Austria). Yet, the cyclic development of urbanization, suburbanization, disurbanization and re-urbanization comes to an end when the demographic and urban–regional trajectory of a society arrives at an advanced polycentric structure, as we find it in the Netherlands, where core and ring distinctions are blurred and all urban areas establish relations with multiple neighbours. Indeed, being in the hinterland of multiple cities makes a difference in demographic growth – this is another relevant finding of this paper – and these ‘polyhinterlands’ deserve further attention. In the line of Shu et al. (Citation2019) about everywhere being hinterland and centre to everywhere else, the question is to what extent can these areas still be seen as hinterlands. When considering the advantages of proximity to multiple cores, arguably each hosting important, complementary amenities and activities, but none covering the full spectrum of urban activity, then these ‘polyhinterlands’ can actually be the best located areas in the urban region, becoming ‘central’ in relation to accessibility to a larger array of urban activities and thereby attracting population inflows. Emerging questions are, for instance, how municipal boundaries influence the preferential relations established by these areas with nearby cores, namely distinguishing between polyhinterlands that are autonomous municipalities themselves and those that were originally peripheries to other municipalities. These questions demand further research on forms of urbanization beyond core–periphery assumptions and how to delineate and govern urban regions.
Clearly, this postmodern development does not imply a ‘final’ stage of a stable equilibrium. On the contrary, when cores and rings synchronize their demographic trajectory, new, intra-regional centralities and flows emerge, which might be more flexible and unpredictable in their locational geography and demographic trajectory than the long-term cycles of modern urban–regional development of the 20th century known before. This study was able to advance the hypothesis of ‘syncurbanization’ as a new stage – or period – of urban–regional development and discuss its implications for the definition of, and relations between, cores and peripheries, for the notion of centrality versus the hinterland, and for a better understanding of polycentricity. It will take more in-depth research to find out whether syncurbanization is an exception to the models or indeed indicates a general direction of a new period of European urbanization – departed from the ‘old’ period described by the four known stages of the SCM – and if other development sequences are emerging within this new, polycentric period.
There are related implications for regional policy and planning. The urbanization path of syncurbanization with synchronous growth and decline of (many) cores and regional hinterlands will reshuffle regional centralities as well as expose single urban regions to urban-systemic developments across larger territories. However, is this period of syncurbanization ‘good’ news for regional policy and planning? In substantial terms, we must gain more knowledge in how far PUR forms are actually leading to or jeopardizing sustainable urban development; particularly in terms of land consumption (Marquard et al., Citation2020) and ecological externalities of transport. In strategic terms, future EU regional policy is advised to further raise attention into urban territories (Meijers & Sandberg, Citation2021; Rauhut & Humer, Citation2020; Zimmermann & Atkinson, Citation2021). Additionally, residual spaces in-between (Humer, Citation2018) – polyhinterlands – and their specific spatial constraints need novel functional programmes to make them participate in the life of the urban region. Presumably, urban-system perspectives of funding schemes and planning programmes should gain importance over single-territorial views. This includes the attention of core–core, core–hinterland and hinterland–hinterland relations inside and across urban regions as well as the distinction of cores according to their character of town-ness and city-ness and how they play together (Humer & Granqvist, Citation2020; Taylor et al., Citation2010). New, future-oriented approaches to, and perspectives on, regional planning (Harrison et al., Citation2021a; Purkarthofer et al., Citation2021a) carry some possible answers for planning in a syncurbanization period, which start with an urban–regional strategic planning practice beyond statutory boundaries (Granqvist et al., Citation2021) and continue towards a new culture of regional planning at large (Harrison et al., Citation2021b; Purkarthofer et al., Citation2021b).
DISCLOSURE STATEMENT
No potential conflict of interest was reported by the authors.
Additional information
Funding
Notes
1. At times, the City-Life Cycle Model (Roberts, Citation1991; Metzger, Citation2000) is confused, associated or equated with the Van den Bergian SCM. For conceptual clarity, the present paper bears with the latter concept only since the former is originally occupied with describing cycles of real estate booms and busts, social improvement, and degradation of urban neighbourhoods, and other socio-economic long-term cycles of urban development.
2. Some of the Austrian FURs cross borders. The concerned Swiss and German municipalities are also included in our analyses.
3. In quite some instances in the Netherlands, suburbanization took place from urban cores to adjacent municipalities that are (nowadays) part of the same MUA, and hence counted as ‘core’ here. If we were to split the core into the main core city and smaller mostly suburban settlements (the first suburban ring), suburbanization would be even more pronounced. The growth percentages for the core city in the 1960s and subsequent decades were 9%, 2%, 5%, 6% and 5%, respectively. Corresponding numbers for the ‘first suburban ring’ are 30%, 17%, 9%, 7% and 3%.
4. The Differential Urbanization Concept (DUC) (Geyer & Kontuly, Citation1993; Geyer, Citation1996; Kontuly & Geyer, Citation2003) is different in essence compared with the SCM, because (1) it only takes cities – be they large or small – of a country into account, while not regarding hinterlands/rings; and (2) the key indicator is migration flows. However, the low amplitudes shown in in later decades suggest some similarity to the trajectory of the DUC. Borrowing from the argumentation of the DUC, a level of maturity/saturation is reached after some stages of (more dynamic) development.
REFERENCES
- Andersen, H. T., Moller-Jensen, L., & Engelstoft, S. (2011). The end of urbanization? Towards a new urban concept or rethinking urbanization. European Planning Studies, 19(4), 595–611. https://doi.org/https://doi.org/10.1080/09654313.2011.548472
- Balducci, A., Fedeli, V., & Curci, F. (2017). Post-metropolitan territories. Looking for a new urbanity. Routledge.
- Brenner, N. (2013). Theses on urbanization. Public Culture, 25(1), 85–114. https://doi.org/https://doi.org/10.1215/08992363-1890477
- Brenner, N., & Schmid, C. (2014). The ‘urban age’ in question. International Journal of Urban and Regional Research, 38(3), 731–755. https://doi.org/https://doi.org/10.1111/1468-2427.12115
- Burger, M., & Meijers, E. (2016). Agglomerations and the rise of urban network externalities. Papers in Regional Science, 95(1), 5–15. https://doi.org/https://doi.org/10.1111/pirs.12223
- Burger, M., Meijers, E., Hoogerbrugge, M., & Tresserra, J. M. (2015). Borrowed size, agglomeration shadows and cultural amenities in north-west Europe. European Planning Studies, 23(6), 1090–1109. https://doi.org/https://doi.org/10.1080/09654313.2014.905002
- Capello, R. (2000). The city network paradigm: Measuring urban network externalities. Urban Studies, 37(11), 1925–1945. https://doi.org/https://doi.org/10.1080/713707232
- Cardoso, R. V. (2018). Localising urbanisation trajectories: Comparing the emergence of second-tier urban regions in Europe (1890–2011). Urban Research & Practice, 11(3), 223–246. https://doi.org/https://doi.org/10.1080/17535069.2017.1328068
- Cardoso, R. V., & Meijers, E. (2016). Contrasts between first-tier and second-tier cities in Europe: A functional perspective. European Planning Studies, 24(5), 996–1015. https://doi.org/https://doi.org/10.1080/09654313.2015.1120708
- Cardoso, R. V., & Meijers, E. (2020). Metropolisation: The winding road toward the citification of the region. Urban Geography, 1–20. https://doi.org/https://doi.org/10.1080/02723638.2020.1828558
- Champion, A. (2001). A changing demographic regime and evolving poly centric urban regions: Consequences for the size, composition and distribution of city populations. Urban Studies, 38(4), 657–677. https://doi.org/https://doi.org/10.1080/00420980120035277
- Cividino, S., Halbac-Cotoara-Zamfir, R., & Salvati, L. (2020). Revisiting the ‘city life cycle’: Global Urbanization and implications for regional development. Sustainability, 12(3), 1151. https://doi.org/https://doi.org/10.3390/su12031151
- Dembski, S., Sykes, O., Couch, C., Desjardins, X., Evers, D., Osterhage, F., Siedentop, S., & Zimmermann, K. (2019). Reurbanisation and suburbia in northwest Europe: A comparative perspective on spatial trends and policy approaches. Progress in Planning, article 100462. https://doi.org/https://doi.org/10.1016/j.progress.2019.100462
- European Observation Network for Territorial Development and Cohesion (ESPON). (2005). ESPON/1.1.1: Potentials for polycentric development in Europe. Project report. Nordregio.
- European Observation Network for Territorial Development and Cohesion (ESPON). (2007). ESPON/1.4.3: Study on urban functions. Final report. ESPON & IGEAT.
- Friedmann, J. (1966). Regional development policy: A case study of Venezuela. MIT Press.
- Friedmann, J. (1978). The urban field as human habitat. In L. Bourne & J. Simmons (Eds.), Systems of cities: Readings on structure and growth policy (pp. 42–52). Oxford University Press.
- Geyer, H. S. (1996). Expanding the theoretical foundation of differential urbanization. Tijdschrift voor Economische en Sociale Geografie, 87(1), 44–59. https://doi.org/https://doi.org/10.1111/j.1467-9663.1998.tb01536.x
- Geyer, H. S., & Kontuly, T. (1993). A theoretical foundation for the concept of differential urbanization. International Regional Science Review, 15(2), 157–177. https://doi.org/https://doi.org/10.1177/016001769301500202
- Gordon, P., & Richardson, H. W. (1996). Beyond polycentricity: The dispersed metropolis, Los Angeles, 1970–1990. Journal of the American Planning Association, 62(3), 289–295. https://doi.org/https://doi.org/10.1080/01944369608975695
- Granqvist, K., Humer, A., & Mäntysalo, R. (2021). Tensions in city-regional spatial planning: The challenge of interpreting layered institutional rules. Regional Studies, 55(55), 844–856. https://doi.org/https://doi.org/10.1080/00343404.2019.1707791
- Hall, P., & Pain, K. (2006). The polycentric metropolis: Learning from mega-city regions in Europe. Earthscan.
- Harrison, J., Galland, D., & Tewdwr-Jones, M. (2021a). Whither regional planning? Regional Studies, 55(1), 1–5. https://doi.org/https://doi.org/10.1080/00343404.2020.1862412
- Harrison, J., Galland, D., & Tewdwr-Jones, M. (2021b). Regional planning is dead: Long live planning regional futures. Regional Studies, 55(1), 6–18. https://doi.org/https://doi.org/10.1080/00343404.2020.1750580
- Humer, A. (2018). Linking polycentricity concepts to periphery: Implications for an integrative Austrian strategic spatial planning practice. European Planning Studies, 26(4), 635–652. https://doi.org/https://doi.org/10.1080/09654313.2017.1403570
- Humer, A., & Granqvist, K. (2020). The gradual city-ness and town-ness of public service locations: Towards spatially sensitive sector policies. Geoforum; Journal of Physical, Human, and Regional Geosciences, 113, 81–91. https://doi.org/https://doi.org/10.1016/j.geoforum.2020.05.008
- Kabisch, N., & Haase, D. (2011). Diversifying European agglomerations: Evidence of urban population trends for the 21st century. Population, Space and Place, 17(3), 236–253. https://doi.org/https://doi.org/10.1002/psp.600
- Kling, R., Olin, S., & Poster, M. (1995). Postsuburban California: The transformation of orange county since World War Two. University of California Press.
- Kloosterman, R., & Musterd, S. (2001). The Polycentric Urban Region: towards a research agenda. Urban Studies, 38(4), 623–633. https://doi.org/https://doi.org/10.1080/00420980120035259
- Kontuly, T., & Geyer, H. S. (2003). Lessons learned from testing the differential urbanisation model. Tijdschrift voor Economische en Sociale Geografie, 94(1), 124–128. https://doi.org/https://doi.org/10.1111/1467-9663.00242
- Marquard, E., Bartke, S., Gifreu i Font, J., Humer, A., Jonkman, A., Jürgenson, E., Marot, N., Poelmans, L., Repe, B., Rybski, R., Schröter-Schlaack, C., Sobocká, J., Sørensen, M. T., Vejchodská, E., Yiannakou, A., & Bovet, J. (2020). Land consumption and land take: Enhancing conceptual clarity for evaluating Spatial Governance in the EU context. Sustainability, 12(19), 8269. https://doi.org/https://doi.org/10.3390/su12198269
- Meijers, E., Hoogerbrugge, M., & Cardoso, R. V. (2018). Beyond polycentricity: Does stronger integration between cities in polycentric urban regions improve performance? Tijdschrift voor Economische en Sociale Geografie, 109(1), 1–21. https://doi.org/https://doi.org/10.1111/tesg.12292
- Meijers, E., & Sandberg, K. (2021). Territorial cohesion, polycentrism and regional disparities: Revisiting an unsolved debate. In D. Rauhut, S. Sielker, & A. Humer (Eds.), EU Cohesion Policy and Spatial Governance: territorial, Social and Economic challenges (pp. 127–141). Edward Elgar.
- Metzger, J. T. (2000). Planned abandonment: The neighborhood life-cycle theory and national urban policy. Housing Policy Debate, 11(1), 7–40. https://doi.org/https://doi.org/10.1080/10511482.2000.9521359
- Nyström, J. (1992). The cyclical urbanization model. A critical analysis. Geografiska Annaler Series B, 7(2), 133–144. https://doi.org/https://doi.org/10.2307/490569
- Parr, J. (2002). Agglomeration economies: Ambiguities and confusions. Environment and Planning A: Economy and Space, 34(4), 717–732. https://doi.org/https://doi.org/10.1068/a34106
- Parr, J. (2004). The Polycentric Urban Region: a closer inspection. Regional Studies, 38(3), 231–240. https://doi.org/https://doi.org/10.1080/003434042000211114
- Parr, J. (2012). The spatial-cycle model (SCM) revisited. Regional Studies, 46(2), 217–228. https://doi.org/https://doi.org/10.1080/00343404.2011.558895
- Phelps, N. A., Fallon, R. J., & Williams, C. L. (2001). Small firms, borrowed size and the urban–rural shift. Regional Studies, 35(7), 613–624. https://doi.org/https://doi.org/10.1080/00343400120075885
- Phelps, N. A., & Wu, F. (2011). International perspectives on suburbanization. A post-suburban world? Palgrave Macmillan.
- Purkarthofer, E., Humer, A., & Mattila, H. (2021a). Subnational and dynamic conceptualisations of planning Culture: The Culture of regional planning and regional planning Cultures in Finland. Planning Theory & Practice, https://doi.org/https://doi.org/10.1080/14649357.2021.1896772
- Purkarthofer, E., Humer, A., & Raine Mäntysalo, R. (2021b). Regional planning: An arena of interests, institutions and relations. Regional Studies, 55(55), 773–777. https://doi.org/https://doi.org/10.1080/00343404.2021.1875128
- Rauhut, D., & Humer, A. (2020). EU Cohesion Policy and spatial economic growth: Trajectories in economic thought. European Planning Studies, 28(11), 2116–2133. https://doi.org/https://doi.org/10.1080/09654313.2019.1709416
- Roberts, S. (1991). A critical evaluation of the city life cycle idea. Urban Geography, 12(5), 431–449. https://doi.org/https://doi.org/10.2747/0272-3638.12.5.431
- Salvati, L., Ferrara, A., & Chelli, F. (2018). Long-term growth and metropolitan spatial structures: An analysis of factors influencing urban patch size under different economic cycles. Geografisk Tidsskrift–Danish Journal of Geography, 118(1), 56–71. https://doi.org/https://doi.org/10.1080/00167223.2017.1386582
- Scott, A. J. (2019). City-regions reconsidered. Environment and Planning A: Economy and Space, 51(3), 554–580. https://doi.org/https://doi.org/10.1177/0308518X19831591
- Shu, X., Han, H., Huang, C., & Li, L. (2019). Defining functional polycentricity from a Geographical perspective. Geographical Analysis. https://doi.org/https://doi.org/10.1111/gean.12195
- Sieverts, T. (1997). Cities without cities: An interpretation of the zwischenstadt. Routledge.
- Soja, E. W. (2011). Regional urbanization and the End of the metropolis Era. In G. Bridge, & S. Watson (Eds.), The new Blackwell companion to the city (pp. 679–689). Blackwell.
- Taylor, P. J., Hoyler, M., & Verbruggen, R. (2010). External urban relational process: Introducing central flow Theory to complement central place Theory. Urban Studies, 47(13), 2803–2818. https://doi.org/https://doi.org/10.1177/0042098010377367
- Turok, I., & Mykhnenko, V. (2007). The trajectories of European cities 1960–2005. Cities, 24(3), 165–182. https://doi.org/https://doi.org/10.1016/j.cities.2007.01.007
- Tzaninis, Y., & Boterman, W. (2018). Beyond the urban–suburban dichotomy. City, 22(1), 43–62. https://doi.org/https://doi.org/10.1080/13604813.2018.1432143
- Van de Kaa, D. (1987). Europe’s second demographic transition. Population Bulletin, 42(1), 1–57.
- Van den Berg, L., Drewett, R., Klaassen, L. H., Rossi, A., & Vijverberg, C. H. T. (1982). A study of growth and decline, urban Europe, Vol. 1. Pergamon.
- Van Meeteren, M. (2016). From polycentricity to renovated urban systems theory: Explaining Belgian settlement geographies (Doctoral dissertation). Ghent University, Ghent.
- Waterhout, B., Zonneveld, W., & Meijers, E. (2005). Polycentric development policies in Europe: Overview and debate. Built Environment, 31(2), 163–173. https://doi.org/https://doi.org/10.2148/benv.31.2.163.66250
- Weichhart, P. (2015). Residential multi-locality: In search of theoretical frameworks. Tijdschrift voor Economische en Sociale Geografie, 106(4), 378–391. https://doi.org/https://doi.org/10.1111/tesg.12156
- Wolff, M., & Wiechmann, T. (2018). Urban growth and decline: Europe’s shrinking cities in a comparative perspective 1990–2010. European Urban and Regional Studies, 25(2), 122–139. https://doi.org/https://doi.org/10.1177/0969776417694680
- Zimmermann, K., & Atkinson, R. (2021). Urban policy in European Cohesion policy. In D. Rauhut, S. Sielker, & A. Humer (Eds.), EU Cohesion Policy and Spatial Governance: territorial, Social and Economic challenges (pp. 83–97). Edward Elgar.