
 ?Mathematical formulae have been encoded as MathML and are displayed in this HTML version using MathJax in order to improve their display. Uncheck the box to turn MathJax off. This feature requires Javascript. Click on a formula to zoom.
ABSTRACT
Our modelling strategy assesses model uncertainty explicitly and aims to identify the main drivers of differences in digital variables at the household and individual levels in 99 European NUTS-2 regions. Several economic and demographic covariates are found to be robust predictors of these variables. Our benchmark projection results indicate that historical convergence trends in variables related to the access to digital technologies (broadband and internet use) are expected to continue, but that in the absence of particular policy impulses, the digital divide existing in Europe for international e-commerce and e-government interactions is not expected to disappear in the coming years.
INTRODUCTION
The importance of global digitalization phenomena for the European Union has led to the development of a large number of policy measures aimed at facilitating the improvement of infrastructure and the creation of incentives to innovation. The European Commission’s Digital Single Market (DSM) strategy is the best example of such wide-ranging policy endeavours. The DSM builds upon three pillars related to: (1) unrestricted digital market access for consumers and businesses; (2) ensuring fair rules and efficient support for the development of infrastructure and content services; and (3) maximizing the potential of the digital economy in terms of aggregate economic growth and progress in key technologies (European Commission, Citation2015).
Understanding the policy challenges posed by digitalization trends on the continent requires the quantitative assessment of potential asymmetries related to the future dynamics of access to digital platforms and their use. Quantifying the penetration of digital technologies poses several challenges to researchers. The empirical literature concerned with differences in digital adoption often combines competing (highly correlated) variables measuring different aspects related to digitalization phenomena into indicators using factor analysis (e.g., Cruz-Jesus et al., Citation2012; Lucendo-Monedero et al., Citation2019; Ruiz-Rodríguez et al., Citation2018; Vicente & López, Citation2011). While working with indicators based on the extraction of one or more common factors from several variables measuring digital trends has the advantage of reducing the high dimensionality of the phenomenon under scrutiny, it has the drawback that the changes in such a factor variable do not have a direct interpretation. Instead of attempting to simplify the complex multidimensional nature of the digital divide and the policy initiatives in Europe to assess their driving forces, in this study we choose a set of individual indicators (e.g., Szeles, Citation2018) based on their direct economic relevance. They measure the access to broadband, and internet, international e-commerce and e-government use. Most internet connections in households have moved towards broadband, while the variable is valuable to proxy internet infrastructure and access at a reasonable bandwidth. Similarly, daily internet use measures active engagement of individuals with online technologies. Obstacles to the use of international e-commerce relate to the lagging digital integration of the single market due to barriers such as tax procedures and delivery limitations, while e-government promotion by central administrations could save time and money for firms and consumers though data-sharing and streamlining procedures (European Commission, Citation2015).
In this paper we present an econometric framework at the regional (NUTS-2) level in Europe aimed to provide a tool for analysing selected indicators of digital penetration. The study presents an econometric modelling strategy aimed at assessing the drivers of digital adoption trends in the last decade and delivering scenario-driven projections for variables related to digital penetration in European regions. In particular, we apply Bayesian model averaging (BMA) methods to address the robustness of the driving factors of digital trends at the regional level in Europe and to create scenario-based projections for future developments. The method used allows us to explicitly assess uncertainty in both the nature of the variables included in the model and the specification of the spatial correlation structure present in the digital penetration data using techniques based on averaging spatial autoregressive (SAR) models (Crespo-Cuaresma et al., Citation2014; Crespo-Cuaresma & Feldkircher, Citation2013).
The results of the BMA exercise reveal that convergence dynamics, as well as demographic, sectoral and economic variables, are central to explaining trends in digitalization variables over the last decade. However, the particular robust drivers of digital penetration differ across indicators: while income per capita differences across European regions are important determinants of internet use and e-government, sectoral composition and activity rates play a more relevant role for broadband access (together with educational attainment and ageing indicators). No robust determinants of variation in international e-commerce use within countries are found in our analysis, and all four variables show indications of convergence to country-specific equilibria in the sample period considered. The analysis reveals a strong heterogeneity in the nature of the drivers of digitalization processes across our studied phenomena after controlling for country-specific effects, which indicates that no one-size-fits-all specification exists linking socioeconomic developments to the different dimensions of digitalization. In this respect, our results emphasize the need to address model uncertainty and specification choice when constructing econometric tools aimed at performing inference on the linkages between digital divides and the demographic and economic developments in European regions. Benchmark projections of our digital penetration variables suggest that unconditional convergence trends are expected to continue and close the differences in digital access variables (broadband access and daily internet use). On the other hand, no systematic convergence paths are projected for e-government interactions, and changes in international e-commerce appear dominated by club convergence related to institutional and country-specific characteristics.
The remainder of the paper is structured as follows. In the next section we provide a literature review and present the theoretical foundation for our analysis. We then present the data and a descriptive account of the relative dynamics of digitalization indicators in European regions over the last decade, concentrating on convergence and divergence patterns both across and within countries. After this we present the econometric methodology based on model averaging techniques, including an extension that incorporates uncertainty in spatial spillovers. The next section empirically investigates the determinants of the penetration of digital technologies present in the data. This is followed by a projection exercise based on the BMA modelling framework. The final section concludes.
DIGITAL DIVIDES AND MEASURES OF DIGITALIZATION: A LITERATURE REVIEW
Vicente and López (Citation2011) highlight potential theoretical channels that identify explanatory factors in information and communication technology (ICT) diffusion. High population size and density can lower access costs, making urbanization an important driver of the adoption of digital technologies. Conditional on specific skills and access options, higher educated individuals tend to adopt new technologies faster, while individuals of different ages may display different preferences, abilities and demand for ICT technologies. The role of industrial structure as a determinant of differential dynamics in digitalization processes has also been discussed by Billon et al. (Citation2009b). To the extent that income growth affects infrastructure investments and is in turn affected by the socioeconomic characteristics and human capital levels of a region, it can also act as a predictor of digitalization trends (Billon et al., Citation2008; Vicente & López, Citation2011). Determining the causality mechanisms in place between digitalization and economic developments has been emphasized in part of the existing literature (e.g., Czernich et al., Citation2011). Using US data, Tranos and Mack (Citation2016) find a bidirectional causality relationship between broadband provision and the growth of knowledge-intensive business services. The nature of the interaction between ICT diffusion and regional productivity dynamics, in addition, depends on the horizon considered and the speed of adoption. Tranos et al. (Citation2020), for instance, find persistent long-run positive effects of online content creation on regional productivity in the UK for the first decades of the current century. Such results suggest a complex quantitative linkage between developments in ICTs and economic activity at the subnational level.
Billon et al. (Citation2009b) find that differences in the patterns of ICT adoption across regions can be explained by income differences, as well as by differences in the importance of the service sector, education levels and governmental effectiveness. The literature analysing the determinants of digitalization across European subnational regions is relatively limited. Szeles (Citation2018) uses panel data ranging from 2001 to 2016 on both country and regional level indicators to assess empirically the differences in penetration of digital technologies observed across European regions. Szeles’s results suggest that differences in economic growth, educational attainment, and research and development expenditure may explain the European digital divide.
The importance of including the geographical dimension in this context is often highlighted in the existing economic literature (e.g., Billon et al., Citation2008), underlining the reasoning for an explicit treatment of spatial spillovers when modelling the determinants of digitalization indicators. Digital technology adoption by firms in comparison with individuals can be treated as distinct but related perspectives. Billon et al. (Citation2009a) find spatial effects in ICT adoption by firms to be constrained by national borders, along with an important role for regional disparities in gross domestic product (GDP) and identifying high adoption regions in the geographical centre of Europe. Lutz (Citation2019), on the other hand, provides recent evidence on the existence of a spatially consistent North–South polarization across digitalization indicators for the general population, with the North of Europe consistently presenting more widespread adoption of digital technologies than the South and East of the continent. The growth performances in terms of digital indicators, however, take on more complex spatial structures.
Recent contributions to the literature also include Castellacci et al. (Citation2020), who focus on explaining regional technology diversification making use of patent data. This study finds that e-skills can positively impact diversification dynamics, especially in less-developed regions. Lucendo-Monedero et al. (Citation2019) assess regional data and report on the important role of broadband access in the digital divide for individuals and households, and present further evidence for spatial autocorrelation in digital penetration data. At a more global level, Pick and Nishida (Citation2015) compare major world regions in a spatial framework and find that the degree of innovation capacity and independence of the judiciary are important factors to explain the spread of digital platforms worldwide, and in Europe in particular. Kathuria and Oh (Citation2018) further argue that the digital divide across countries has declined in relative but not absolute terms. An incipient literature studies digitalization phenomena related to Industry 4.0. Castelo-Branco et al. (Citation2019), for instance, assess the development of infrastructure and the capabilities related to the implementation of Industry 4.0 technologies across European economies. Balland and Boschma (Citation2021), on the other hand, study innovation activities by assessing the empirical distribution of patents related to Industry 4.0 technologies.
The research question posed by this contribution aims at closing the knowledge gap existing in the literature concerning the characteristics of the robust drivers of the dynamics of the penetration and adoption of digital technologies. The complex multidimensional nature of the process of digitalization has led to the use of different variables to approximate these phenomena related to the penetration of digital technologies in the empirical studies discussed above. The proxies used as can be grouped into (1) composite indicators based on the application of dimensionality-reduction methods for the dependent variable, such as weighted indicators, factor analysis or canonical correlation analysis to different individual indicators measuring use of digital services and other phenomena related to digitalization (e.g., Billon et al., Citation2009b); (2) individual variables related to the adoption of one particular technology, such as the use of websites by firms (Billon et al., Citation2009a), broadband access (Lucendo-Monedero et al., Citation2019), internet use or e-commerce use (Szeles, Citation2018); and (3) variables aimed at measuring the outcome of innovation activities related to technological progress in digitalization, such as patents (e.g., Castellacci et al., Citation2020). In our empirical analysis, we acknowledge the multidimensionality of digitalization processes, but instead of creating a composite indicator, we examine different variables that measure access to broadband and the adoption of internet services, (international) e-commerce and e-government. The parallel analysis of these different aspects of digitalization allows us to unveil particular drivers for each variable and thus explore the degree of heterogeneity existing in their determinants and dynamics, something that would not be possible using composite indicators such as those employed by Billon et al. (Citation2009b).
DATA
Digital indicators
Our variables of interest assess different aspects of the digitalization process in European regions. We source data from Eurostat (Citation2021) on the proportion of households with broadband connections, the proportion of the population being daily internet users, using e-commerce internationally (buying from sellers in other EU countries) and interacting electronically with the government. The information is available at the NUTS-2 level and covers the period 2008–18 for the broadband variable and 2011–18 for the rest of the indicators. These indicators are measured as percentages (reaching a maximum at 100%) of households or the population. The starting values for the variables were chosen so as to balance data availability and the requirement of having a balanced dataset across variables, since the method employed for the analysis cannot deal with data having different number of observations across the later described covariates.
Empirical conceptualization and stylized facts
We start by analysing the dynamics of the series of selected digitalization indicators across European regions during the last decade. presents scatterplots depicting the relationship between the change in these variables between the earliest year available (2008 or 2011) and 2018, and the initial level of the digitalization variable. These so-called β-convergence regressions are routinely used to assess the relative dynamics of a variable across observational units and are often employed in the analysis of income convergence patterns across countries (e.g., Barro & Sala-i-Martin, Citation1992). A significant negative relationship between the initial level of the variable and its subsequent change indicates that regions that start with a lower degree of digitalization (as measured by the corresponding variable) tend to increase the value of this variable by more than those which started with a high value, thus leading to convergence patterns within the group of subnational units considered.
Figure 1. Convergence graphs for digitalization indicators: unrestricted samples with 119–138 NUTS-2 regions (percentages and percentage point change).
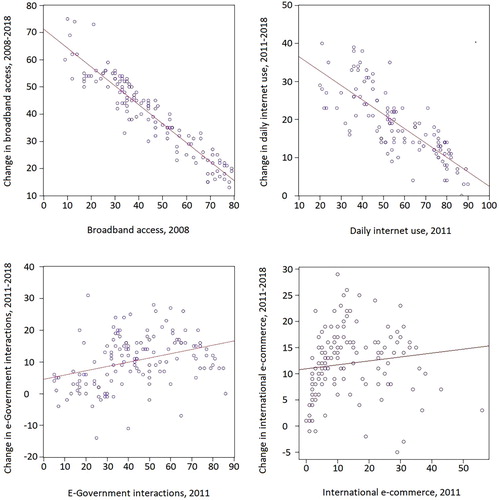
These convergence plots reveal marked differences across regions in the relative dynamics of the different digitalization indicators. While overall convergence trends can be observed across European regions for the broadband access and the internet use indicators (as indicated by the significant negative correlation between the initial value of these variables and its change), for the indicators of e-government and e-commerce divergence dynamics dominated the period. We analyse the characteristics of the convergence patterns in the penetration of digital economies across NUTS-2 regions by estimating simple β-convergence regressions. In particular, we regress the change in each one of the corresponding digitalization variables on its initial value, using the regression specification:
(1)
(1) where Δdij denotes the change in digitalization variable d of region i in country j for the period under consideration; and dij,0 is the initial variable value. In order to assess overall convergence patterns within Europe, we estimate specifications where αj = α for all j, while within-country convergence is captured by alternative specifications including country-specific intercepts. The estimates of the convergence parameter β are presented in and show substantial differences in patterns across two groups of indicators. R2 values are generally relatively high, although international e-commerce and e-government show lower explanatory power in the formulation without country fixed effects. For the case of broadband access and internet use, convergence dynamics can be observed between countries with a high speed of convergence, particularly for broadband. On the other hand, our e-government and e-commerce measures present overall divergent dynamics at the European level. All variables show within-country convergence to country-specific equilibria, with tests for equality of country fixed effects across EU member states rejecting this null hypothesis for all of our digitalization measures. This hints at the fact that institutional differences at the national level are important factors explaining regional differences in the penetration of digital technologies. The analysis of drivers of different digital penetration phenomena and how they differ across the four measures assessed gives us more insights about whether cross-regional gaps are expected to close in the near future or to persist for longer periods of time.
Table 1. Convergence regressions: digitalization indicators.
Potential determinants
The aim of our analysis is to identify the empirical determinants of digitalization trends at the regional level in Europe, concentrating on the four indicators presented above. The set of potential determinants considered includes socioeconomic variables covering information on population density, age structure, labour market outcomes, education outcomes and income. The source and definition of these variables are presented in . We use a standardized set of indicators sourced from Cambridge Econometrics (Citation2021) to cover income and investment, population and labour market conditions in our dataset. These data range until 2014 and span information for 99 NUTS-2 regions.Footnote1 The set of potential determinants is complemented by additional variables sourced from Eurostat (Citation2021) on population, human capital and sectoral composition in order to cover other theoretically relevant categories (e.g., see the explanatory variables in Billon et al., Citation2008, Citation2009a, Citation2009b; Vicente & López, Citation2011).Footnote2
Table 2. Potential explanatory variables: definition and sources.
We construct several different spatial linkage matrices to address possible spillover structures in European digitalization dynamics. The group of spatial linkage matrices entertained include several contiguity (shared borders) and nearest neighbour structures, as well as matrices based on inverse geodesic distance. We consider queen contiguity matrices from first to third order, assessing both matrices that include lower order neighbours and those that exclude them. Also, k-nearest neighbour matrices (based on region centroids) including three, nine, 15 or 21 nearest neighbours are included in the set of potential spatial matrices. We also include neighbour definitions based on circular inverse distance bands of 550, 650 and 750 km.
MODELLING THE EXPANSION OF DIGITAL PLATFORMS: AN ECONOMETRIC FRAMEWORK
When analysing the possible underlying mechanisms of digital penetration, Billon et al. (Citation2008) consider a theoretical framework based on economic and spatial mechanisms (e.g., knowledge spillovers) to explain the spread of ICT. Broader considerations in terms of the assessment of general technological diffusion determinants are also conceivable (Benhabib & Spiegel, Citation2005), but there appears to be no universally accepted theoretical framework on how to model the complex interactions behind technological penetration paths. Empirical contributions on the study of the digital divide in Europe tend to choose a reasonable set of explanatory variables related to particular theoretical mechanisms, and provide inference conditional on this particular choice of covariates. By using such a modelling framework, the existing empirical studies tend to ignore the source of uncertainty which is inherent to the choice of an individual model upon which inference is based.
In contrast to the existing empirical approaches, we use a data-driven approach that is able to carry out inference using the full set of possible model specifications that can be created with a given group of covariates and thereby can be used to deal with the inherent uncertainty related to specification choice in the context of the assessment of the empirical drivers of digitalization trends in Europe.
Bayesian model averaging (BMA) and inference under specification uncertainty
When quantifying the effect of a particular variable (xi) on a digitalization indicator (yi), inference is routinely carried out within a (linear) regression model where the effect of other covariates is controlled for. The effect estimate therefore depends on the choice of controls and integrating this source of uncertainty into our inference is necessary in order to identify the empirical drivers of digitalization trends and to quantify their influence in a robust manner. BMA provides a rigorous statistical framework to estimate the effects of the determinants of digitalization trends in Europe while explicitly assessing the uncertainty that is implied by the fact that many competing regression models could be created to obtain such estimates.
Let y denote a vector that contains information on a given digitalization variable for N regions. Assume that we use a set of k explanatory variables as controls, collected in an N × k-matrix represented by Xk, and consider a standard normal linear regression model linking the digitalization variable to these determinants:
(2)
(2) where βk is a vector of dimension k summarizing the effects of the explanatory variables; and ε is the realization of a multivariate normal error term. Assuming that models such as that presented in equation (2) can be built for all combinations of K potential covariates that have been identified as potential drivers of the digitalization variable, we can define the cardinality of the model space M, that is, the number of different linear regression models that can be estimated, as card(M) = 2K (for an early conceptualization of the problem of model uncertainty, see Leamer, Citation1978).
BMA proceeds by integrating the uncertainty about model specification into our inference of the effect of a particular covariate xi, which is subsumed in the parameter βi. Bayesian inference naturally implies that the posterior distribution over βi is given by:
(3)
(3) where Mm refers to a particular model specification, indexed by m (given by a specific choice of exogenous variables) and the posterior model probability of a given specification is denoted by p(Mm|y). In turn, applying Bayes’ theorem, p(Mm|y) can be written as the product of the marginal likelihood of the model, p(y|Mm), and p(Mm), the prior model probability. Following the logic behind equation (3), projections that incorporate uncertainty in the choice of controls can be obtained for a given scenario S by evaluating the posterior distribution:
(4)
(4) where
is the vector containing the projected values of the dependent variable for a selected point in time under scenario S, which is defined by assumptions on the development of the potential covariates.
Following standard practice in BMA applications, the marginal likelihood of a given model, p(y|Mm), can be evaluated in a straightforward manner making use of the so-called g-prior developed by Zellner (Citation1986) for the parameters of the individual specifications given by equation (2). Such a prior is of the form:
(5)
(5) and is therefore governed by a single parameter, g, that scales the variance–covariance matrix of the prior distribution of the parameter vector of the effects of the covariates, βk.
Combined with an uninformative prior on the intercept of the regression model, Zellner’s g-prior results in a tractable closed-form solution for the marginal likelihood of each model with Occam’s razor properties. The resulting expression for p(y|Mm) is given by:
(6)
(6) which increases with the fit of the model (as measured by the coefficient of determination,
) and decreases with the number of covariates included in the specification (k). The choice of g determines the trade-off between goodness of fit and the complexity of the model (as measured by the number of variables included). Fernandez et al. (Citation2001a) present an analysis of the effect of different elicitation strategies for the prior parameter g.
For our application, the full set of potential covariates that can be related to our dependent digitalization variables was described in the last section and includes socioeconomic and demographic covariates. The application of this method to the analysis of the observed differences in the penetration of digital technologies across European regions allows for the identification of robust drivers of digitalization processes in the continent, which in turn is used for prediction exercises after suitable scenarios are designed.
BMA with uncertain spatial linkages
Given that the unit of observation of our empirical analysis is the subnational (NUTS-2) region, even after controlling for their determinants, spatial autocorrelation may be present in the digitalization variable. Accounting for spatially correlated errors may thus appear necessary in the specifications entertained, and accounting for the uncertainty implied by the choice of spatial linkage structures across regions requires a generalization of the BMA setting presented above.
At the regional level, digital variables present strong spatial patterns, with high correlation between the value of a given digitalization variable in a subnational unit and that of neighbouring regions. To the extent that this correlation cannot be captured by the set of control variables in a given regression model, an SAR term would need to be included in the specification to account for this characteristic of the digital variable and avoid misleading inference (e.g., Lesage & Pace, Citation2009).
The BMA setting described above can be generalized to the class of models that include an SAR structure (SAR models) which accounts for spillovers across regions. A spatial lag of the endogenous variable is used to address such global spillovers:
(7)
(7) where W(r) is a conventional (row-normalized) matrix of spatial weights, out of a pool of R potential matrices, indexed by r (see Lesage & Pace, Citation2009, for a description of the specification of such spatial matrices) with characteristic element w(r)ij satisfying w(r)ii = 0 (preventing regions from being their own neighbours), w(r)ij ≥ 0 for i ≠ j (positive) and
. The particular form of w(r)ij is given by prespecified exogenous weights that capture the strength of the spatial relationship between region i and j. For a given choice of the spatial weights matrix W(r), the SAR parameter ρ contains information on the strength of spatial spillovers. Allowing for uncertainty on the choice of the spatial weights matrix, the cardinality of the model space increases as compared with that given by specifications that do not explicitly account for the SAR term and is given by card(M) = (1 + R)2K. Model averaging methods based on Bayesian techniques can be applied to carry out inference under uncertainty both in the choice of explanatory variables and the spatial linkages.
Lesage and Parent (Citation2007) outline the computational difficulties of integrating the spatial dimension into BMA methods. The computational burden associated with obtaining posterior model probabilities in SAR specifications (e.g., Lesage & Fischer, Citation2008) implies that the number of spatial linkage matrices that can be incorporated in the model space is in effect relatively limited. Crespo-Cuaresma and Feldkircher (Citation2013) overcome this problem using spatial filtering methods based on the approach developed by Getis and Griffith (Citation2002) and Tiefelsdorf and Griffith (Citation2007), which allow for the inclusion of a very large number of potential spatial linkage structures within BMA exercises. In this setting, Markov chain Monte Carlo methods (Madigan & York, Citation1995) are used to approximate the distribution of posterior model probabilities across specifications (see Crespo-Cuaresma & Feldkircher, Citation2013, for the application to spatially filtered SAR models). The use of methods which assess the robustness of the analysis to a large number of spatial autocorrelation patterns ensures that the results found are not driven by spillovers across neighbouring subnational units.
EMPIRICAL ANALYSIS
The determinants of digital trends in Europe under model uncertainty
Using the set of potential determinants described before, we carry out a BMA exercise to explain differences in changes in digitalization trends across NUTS-2 regions and unveil the nature of robust drivers of the penetration of digital technologies. In line with literature conventions, we apply a g-prior over the model-specific parameters (Zellner, Citation1986).Footnote3 The elicitation of g is carried out making use of the BRIC prior (Fernandez et al., Citation2001a, Citation2001b) and we consider only specifications including country fixed effects that account for differences in time-invariant institutional and cultural factors at the national level. The results of the BMA exercise without SAR terms are presented in . The dependent variable in each case is the change of the corresponding digitalization variable over the period considered and the explanatory variables are evaluated at the beginning of the period, to avoid potential reverse causality effects on the changes. In addition to the explanatory variables presented in , we expand the set of potential covariates with the initial value of the corresponding digitalization indicator and of the broadband variable, to control for conditional convergence dynamics and for infrastructure, respectively.
Table 3. Bayesian model averaging (BMA) results: digitalization measures.
For each dependent variable (broadband, internet use, e-commerce and e-government), the first column of presents the posterior inclusion probability (PIP) for each of the potential determinants. The PIP is the sum of posterior model probabilities of specifications including that particular covariate and is routinely interpreted as a measure of the robustness of the variable as a predictor for explaining differences in changes of the corresponding index of digital technology adoption. By convention, a variable tends to be considered robust if the PIP exceeds the prior inclusion probability (which is 0.5 in our setting). The second and third columns of report the mean (using all models) and standard deviation of the posterior distribution of the (model-averaged) effect of each covariate.
Starting with the results for our broadband access variable, robust evidence for conditional convergence dynamics can be found, and our estimates highlight the role of several socioeconomic factors as determinants of differences in the dynamics of this digitalization variable. Concentrating on the results for covariates with a PIP > 0.5, we find that regions with high activity rates, tertiary education attainment or investment rates, as well as low old age dependency ratios, tend to systematically experience a relatively higher rate of change in broadband use. The same applies for regions with a relatively low share of the primary sector in their sectoral employment composition. To the extent that educational attainment correlates with the accumulation of e-skills, the robust effect of tertiary education in our sample can be interpreted as highlighting the role of human capital as a determinant of technological diversification (Castellacci et al., Citation2020).
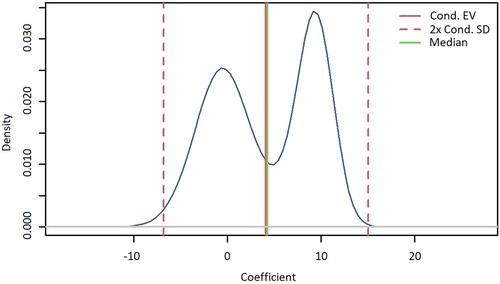
To highlight the importance of using a methodology that incorporates model uncertainty, shows the posterior distribution of the parameter associated to initial gross value added (GVA) per capita on changes in broadband access obtained using BMA. The resulting bimodality in the posterior distribution of the effect of GVA per capita on broadband penetration is driven by the dependence of the effect estimate of the regional income variable on the set of other covariates that are controlled for in different model specifications. Such a result showcases the importance of explicitly addressing model uncertainty when quantifying the effects of covariates on digitalization dynamics.
Figure 2. Posterior distribution of the effect of income on broadband access changes (marginal density plotted against coefficient).
For the case of the daily internet use variable, presented in , the set of robust determinants (with PIP > 0.5) is more limited, partly due to the fact that the role played by infrastructure developments appears to be adequately captured by the broadband variable. In addition to the positive effect of this covariate and negative effect of the initial level of internet use (indicating within-country convergence), only income per capita is found to be a robust determinant of the changes in internet use, with higher income per capita leading to increases in the change of internet use. A similar picture is obtained for the digitalization variable measuring interactions with the government, where income per capita is the only determinant achieving a PIP > 0.5, besides the variable capturing conditional convergence dynamics.
The results for our e-commerce variable reveal few robust correlations among the covariates considered. Surprisingly, initial values and access to broadband do not appear as robust determinant of e-commerce, a result that indicates that the barriers to the expansion of international e-commerce activities appear to be related to institutional and context-dependent country characteristics, captured by the country fixed effects in our specifications. The heterogeneity in tax regimes and other regulatory barriers related to consumer protection or vertical restrictions to selling online, which are exercised at the national level, have been deemed responsible for the digital divide in international e-commerce by several authors (Coad & Duch-Brown, Citation2017; Gomez-Herrera et al., Citation2014). The considerable variation captured in our specification by the country fixed effects and the initial value of the dependent variable make a direct comparison with the empirically comparative literature partly difficult, but our results support some of the existing evidence found in previous studies. In terms of the directional influences of explanatory variables, the results of the multilevel panel approach by Szeles (Citation2018) indicate that indicators related to education and economic growth are positively related to digitalization, as measured in population-based digital indicators at the regional level. Billon et al. (Citation2008) also arrives at comparable results using non-parametric techniques and internet use as a digitalization variable, in addition to finding a positive effect from service sector employment. In our results, the negative impact of agricultural employment appears related to the mechanisms working through population density, which have been highlighted in past studies such as Billon et al. (Citation2009a), although for firm-based digital developments.
BMA with uncertain spatial linkages
presents the results of the BMA exercise when SAR models are included in the model space and uncertainty about the nature of the spatial spillovers is incorporated into the setting.
Table 4. Spatially filtered Bayesian model averaging (BMA) results: digital indicators.
Comparing the spatially filtered results of the application of BMA methods on broadband access to the original statistics in , we find the same robust negative effects of initial broadband, employment in agriculture, and old age dependency ratio, along with the positive effect of tertiary education. Activity and investment rates no longer appear as robust determinants of differences in broadband penetration across regions within countries once uncertainty about spatial spillovers is integrated into the inference method. Some of the robust effects that are found in the standard BMA exercise without spatial spillovers are therefore now captured by the explicit modelling of spatially autoregressive structures within our class of specifications. For the broadband variable, the spatial weight matrix based on the 21-nearest neighbours receives the highest posterior support. As in the case of the standard BMA exercise, for the international e-commerce variable no individual covariate presents robust correlations in this set-up. The spatial weights matrix with highest posterior support is slightly more unusual: a third-order queen contiguity, not including lower orders (or alternatively a 550 km cut-off distance). This result is associated with a less locally consistent spatial pattern in the growth of the variable (e.g., Lutz, Citation2019). For the daily internet use variable, the explicit assessment of spatial spillovers in the model class leads to a loss in the robustness of all covariates as determinants, indicating that models based exclusively on autoregressive spatial spillovers tend to explain the variation in internet use across EU regions relatively well. Unlike for international e-commerce, the spatial filtering method makes the broadband variable particularly robust as a determinant of changes in e-government interactions.
THE DIGITAL DIVIDE AND CONVERGENCE TRENDS: A PROJECTION EXERCISE
In this section we present benchmark projections up to 2030 based on the model averaging framework for our four digital penetration variables. The exercise provides a business-as-usual scenario for future dynamics and highlights how the methodological framework presented in our study can be used to infer the effects of current socioeconomic trends and country-specific factors on the future adoption of digital technologies. Although, the illustrative scenario of this section follows a continuation of current trends for the explanatory factors behind digitalization dynamics, different assumptions can be used to explore the possible consequences of the particular regulatory and policy choices available.
Before deciding on the appropriate methodology for our out-of-sample predictive analysis, we conduct a validation exercise on three competing approaches. Using annual data until 2015 as a training sample and utilizing the period 2015–18 as an out-of-sample period, we compare the predictive ability of the following three methods: (1) the median model; (2) the highest posterior model; and (3) model-averaged predictions. The median model is a single specification made up of all the covariates identified as robust, according to the criterion based on PIP. The results of our validation exercise show the superiority of the median model in this context, in line with the results of Barbieri and Berger (Citation2004) and Barbieri et al. (Citation2021). In accordance, the main results for our benchmark projections rely on the conditional expectations of our digital penetration variables based on the specification given by the median model specification.Footnote4
The covariates included in the median model differ by digitalization variable and we extrapolate estimated linear trends for all potential determinants to create benchmark projections of broadband access, internet use, e-commerce and e-government penetration. We present the results of these benchmark projections in the form of expected convergence patterns using scatterplots in and . The expected change of the variable of interest over the period 2018–30 is depicted against the initial value in 2018 (light grey circles) for the NUTS regions in our sample. In order to improve the comparability with historical trends, we also show the data up to 2018 in the scatterplots (filled circles). The results of the projection exercises imply qualitatively different future dynamics for the different indicators studied. In the context of our estimated models, the projection of the observed socioeconomic trends in Europe to the future is expected to lead to a continuation of the convergence trends in broadband access (as a proxy for closing the gaps in the infrastructure required for other technologies) both across and within countries, as shown in the first panel in . Daily internet use (see the second panel in ) is similarly predicted to continue its convergence path, beginning with a slightly higher level of dispersion across regions.
Figure 3. Projected percentage point changes versus initial values (%), broadband access and daily internet variables for 2018–30 (light grey circles) versus 2008 or 2011–18 (filled circles).
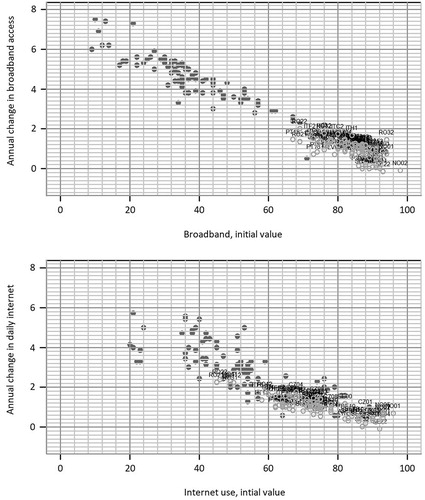
Figure 4. Projected percentage point changes versus initial values (%), e-government and international e-commerce variables for 2018–30 (light grey circles) versus 2011–18 (filled circles).
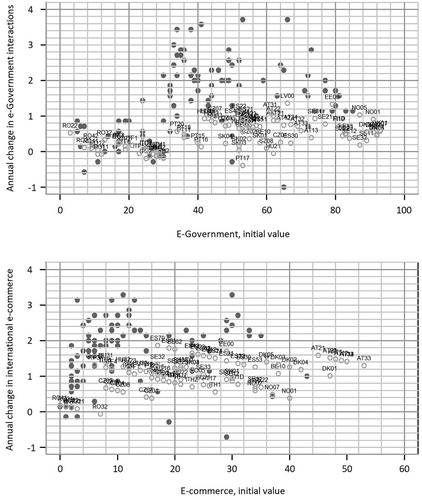
On the other hand, this benchmark scenario design leads to very different projected dynamics for the other two dependent variables, depicted in . For the e-government variable (see the first panel of ), there is little correlation between the initial value and its predicted growth, while there appears to be some degree of clustering among certain groups of countries. The projections are dominated by club convergence in international e-commerce, moving along several distinct lines from the initially dispersed cluster of values (see the second panel of ). In contrast to the e-government results, these predictions are not closely aligned with the North–South–East digital divide in Europe and suggest that more work is required to understand the determinants of international e-commerce penetration within the EU. Figures A1 and A2 in Appendix A in the supplemental data online provide projections based on weighted model averages instead of on the median model. Structurally, the results are very similar, while international e-commerce growth paths are slightly less distinct due to the impact of additional explanatory factors such as the active population. Interestingly, these results are more optimistic on e-government growth and less so on international e-commerce growth.
Overall, the projected trends exemplify how the gap in access to infrastructure and internet use, which allow for the adoption of further digital technologies, is expected to close over the coming decades given current developments in their determinants. However, this does not automatically imply that the existing divide in the use of other digital technologies will follow a similar trend. Our results further emphasize the role played by country specific cultural (e.g., see Gomez-Herrera et al., Citation2014, for evidence on the role played by language as a barrier to cross-border e-commerce), institutional and regulatory frameworks as factors that shape the potential for the closing of the digital divide, confirming the conclusions that have been drawn by other studies such as Cardona and Martens (Citation2014) and Coad and Duch-Brown (Citation2017). While the scenario design of our projections is arguably a simple benchmark, the method proposed in this study in principle allows for the creation of scenarios based on different developments of the socioeconomic covariates, which can help compare different policy paths aimed at achieving a fully integrated digital single market. For instance, an alternative scenario based on a hypothetical increase of the activity rate and tertiary educational attainment leads to significantly higher increases in the projected paths of internet use and international e-commerce, as shown in Figure A3 in Appendix A in the supplemental data online for the exemplary case of a ten percentage point increase in these two determinants of digitalization.
CONCLUSIONS AND POLICY DISCUSSION
This paper applies BMA techniques in order to unveil robust explanatory factors for the regional adoption of digital technologies in Europe, and provides a methodological framework to design scenarios to project their adoption paths until the year 2030. Our results indicate that the socioeconomic determinants of broadband access (for households), internet penetration, international e-commerce and e-government use (for individuals) differ markedly. The current gaps existing across regions in broadband access and daily internet use are expected to close over the coming decades, based on the continuation of the convergence trends that have been observed over the last years. On the other hand, our results show few robust determinants of the differences in international e-commerce use currently observed across European regions within countries and benchmark projections of this variable lead to club convergence over the coming decade. These results appear to be driven by regulatory, institutional and cultural heterogeneity at the country level. E-government use projections are more diverse, but there are indications of a greater alignment to the European North–South–East divide, present in cross-sections of many digital indicators, than in e-commerce.
The results of our benchmark projections have implications for policy in the context of the current discussions around further European integration in the direction of the creation of a digital single market and the new wave of digital technologies (Industry 4.0). At the European level, our results suggest that the spatial equalization of digital opportunity (understood as including the required infrastructure and possibilities needed to reap the benefits of the digital revolution) does not appear as a sufficient condition for the materializing of equalization of policy relevant digital outcomes. Initiatives to improve online interactions with public authorities, or the harmonization of taxes relate to digital phenomena could be important impulses to achieve such convergence. Our results show that, while infrastructure (broadband access) has been a driving factor of the overall use of digital platforms (internet use), it has not been a consistent determinant of the trends observed in the use of digital commerce across the EU and to some degree e-government. Our results confirm that the policy steps aimed at bridging the digital divide in Europe need to go beyond enhancing convergence in infrastructure connection. Otherwise, the potential of supranational policies in the EU to contribute to the convergence of digital outcomes related to economically beneficial uses of digital platforms may be significantly limited. Our estimation and projection results indicate that further homogenization of policies and institutional settings at the country level would be required for EU-level policy efforts towards a digital single market to lead to an actual equalization of digital outcomes. Integrating aspects related to the cross-border nature of international e-commerce into modelling exercises aimed at explaining differences in its use appears as a topic that deserves more careful investigation in future research. Szeles (Citation2018) finds similarities in the nature of the explanatory variables of two digital indicators (albeit using alternative definitions to those in our study), again highlighting the underlying complexity.
To the extent that access to broadband affects the establishment of knowledge-intensive business services (Tranos & Mack, Citation2016) and the adoption on internet-related technologies can have sizeable long-term effects on productivity at the regional level (e.g., Tranos et al., Citation2020), our modelling setting and our projection results are of particular interest to different approaches to the literature that consider future income convergence and the growth of the digital economy in Europe. Even though we only consider tertiary educational attainment as a human capital variable, the results of our analysis complement those by Castellacci et al. (Citation2020) regarding the role of skills (and in particular e-skills) as a determinant of technological adoption in European regions. The efficacy of broadband projects financed by the European Structural and Investment Funds have been found to depend strongly on the quality of the institutional setting at the subnational level in Italy (Matteucci, Citation2020). This points towards an important role also for differences in subnational institutions, including for e-government initiatives and developments, while one should note that Italy has comparably large regional economic differences. The methodological setting presented in this study in principle provides a flexible tool that can be adapted to simulate the effect of policy measures related to broadband access on the adoption of other internet technologies and services.
Although, the lack of comparable data on the penetration of Industry 4.0 technologies does not allow us to directly generalize our results to the latest wave of digital technologies, the existing evidence for these technologies suggests that the insights gained in our analysis may be relevant for the policy discussion. Castelo-Branco et al. (Citation2019) report on the heterogeneity in terms of readiness for Industry 4.0 in Europe as measured by infrastructure and big data capabilities and show large disparities across countries. To the extent that the country-specific institutions that prevent the equalization of digital outcomes for international e-commerce and e-government also affect the adoption of more modern technologies, the steps taken to equalize access to infrastructure will not be sufficient to achieve convergence in the adoption of the latest technological innovations that conform the Industry 4.0 revolution. Increasing regional data availability on the speed of internet connections, in line with European policy objectives, could provide opportunities for future research to better consider the infrastructural basis that can be a prerequisite for specific technologies within this newest wave of digitalization. Balland and Boschma (Citation2021) identify high potential regions based on patents related to Industry 4.0 and these do not appear to be directly in line with the typical North–South pattern described in population-based indicators (this also appears to hold in Corradini et al. [Citation2021]). Potentially fruitful future paths of research also include the investigation of non-linear trends and structural breaks in our digital variables (such as those possibly caused by the COVID 19 pandemic), as well as the evaluation of the impact of the DSM on digital adoption trends, for which more data than currently available would be required.
Supplemental Material
Download PDF (749.7 KB)ACKNOWLEDGEMENTS
The authors thank Michael Pfarrhofer for data provision and helpful comments on earlier drafts of the paper. They also thank Wolfgang Fengler, Indermit Gill, three anonymous referees and the participants at the Europe 4.0 Workshop at the World Bank offices in Vienna for very helpful comments and discussion.
DISCLOSURE STATEMENT
No potential conflict of interest was reported by the authors.
Notes
1. The number of observations is reduced to 93 for the analysis using SAR models due to the removal of spatially isolated regions.
2. The assessment of a relatively large set of potential explanatory variables and the necessity of using a balanced dataset across variables explains the lower number of NUTS-2 regions used in the modelling exercise compared with the convergence graphs of the previous section (see Table A1 in Appendix A in the supplemental data online). Country-specific intercepts can be calculated for the following countries: Austria, Belgium, Czech Republic, Denmark, Estonia, Finland, Hungary, Italy, Latvia, Norway (a European Economic Area member), Portugal, Romania, Sweden and Slovakia.
3. Hyperpriors on g can also be applied in this setting (Feldkircher & Zeugner, Citation2009; Ley & Steel, Citation2012; Liang et al., Citation2008).
4. More detailed quantitative results of the validation exercise are available from the authors upon request.
REFERENCES
- Balland, P.-A., & Boschma, R. (2021). Mapping the potentials of regions in Europe to contribute to new knowledge production in Industry 4.0 technologies. Regional Studies. https://doi.org/https://doi.org/10.1080/00343404.2021.1900557.
- Barbieri, M. M., & Berger, J. O. (2004). Optimal predictive model selection. The Annals of Statistics, 32(3), 870–897. https://doi.org/https://doi.org/10.1214/009053604000000238
- Barbieri, M. M., Berger, J. O., George, E. I., & Ročková, V. (2021). The median probability model and correlated variables. Bayesian Analysis. https://doi.org/https://doi.org/10.1214/20-BA1249
- Barro, R. J., & Sala-i-Martin, X. (1992). Convergence. Journal of Political Economy, 100(2), 223–251. https://doi.org/https://doi.org/10.1086/261816
- Benhabib, J., & Spiegel, M. (2005). Human capital and technology diffusion. Handbook of Economic Growth, 1, 935–966. https://doi.org/https://doi.org/10.1016/S1574-0684(05)01013-0
- Billon, M., Ezcurra, R., & Lera-Lopez, F. (2008). The spatial distribution of the internet in the European Union: Does geographical proximity matter? European Planning Studies, 16(1), 119–142. https://doi.org/https://doi.org/10.1080/09654310701748009
- Billon, M., Ezcurra, R., & Lera-Lopez, F. (2009a). Spatial effects in website adoption by firms in European regions. Growth and Change, 40(1), 54–84. https://doi.org/https://doi.org/10.1111/j.1468-2257.2008.00461.x
- Billon, M., Marco, R., & Lera-Lopez, F. (2009b). Disparities in ICT adoption: A multidimensional approach to study the cross-country digital divide. Telecommunications Policy, 33(10–11), 596–610. https://doi.org/https://doi.org/10.1016/j.telpol.2009.08.006
- Cambridge Econometrics. (2021). European regional database.
- Cardona, M., & Martens, B. (2014). Supply-side barriers to cross-border e-commerce in the EU digital single market. In Institute for prospective technological studies, digital economy working paper (pp. 1–25). http://hdl.handle.net/10419/202201
- Castellacci, F., Consoli, D., & Santoalha, A. (2020). The role of e-skills in technological diversification in European regions. Regional Studies, 54(8), 1123–1135. https://doi.org/https://doi.org/10.1080/00343404.2019.1681585
- Castelo-Branco, I., Cruz-Jesus, F., & Oliveira, T. (2019). Assessing Industry 4.0 readiness in manufacturing: Evidence for the European Union. Computers in Industry, 107(May), 22–32. https://doi.org/https://doi.org/10.1016/j.compind.2019.01.007
- Coad, A., & Duch-Brown, N. (2017). Barriers to European cross-border e-commerce (JRC Working Papers on Digital Economy 2017-03). Joint Research Centre (Seville). http://hdl.handle.net/10419/202225
- Corradini, C., Santini, E., & Vecciolini, C. (2021). The geography of Industry 4.0 technologies across European regions. Regional Studies. https://doi.org/https://doi.org/10.1080/00343404.2021.1884216.
- Crespo-Cuaresma, J., Doppelhofer, G., & Feldkircher, M. (2014). The determinants of economic growth in European regions. Regional Studies, 48(1), 44–67. https://doi.org/https://doi.org/10.1080/00343404.2012.678824
- Crespo-Cuaresma, J., & Feldkircher, M. (2013). Spatial filtering, model uncertainty and the speed of income convergence in Europe. Journal of Applied Econometrics, 28(4), 720–741. https://doi.org/https://doi.org/10.1002/jae.2277
- Cruz-Jesus, F., Oliveira, T., & Bacao, F. (2012). Digital divide across the European Union. Information & Management, 49(6), 278–291. https://doi.org/https://doi.org/10.1016/j.im.2012.09.003
- Czernich, N., Falck, O., Kretschmer, T., & Woessmann, L. (2011). Broadband infrastructure and economic growth. The Economic Journal, 121(552), 505–532. https://doi.org/https://doi.org/10.1111/j.1468-0297.2011.02420.x
- European Commission. (2015). A Digital Single Market strategy for Europe – Analysis and evidence (Commission Staff Working Document No. 192).
- Eurostat. (2021). Regional statistics: Demographic, education, labour market, digital economy and society.
- Feldkircher, M., & Zeugner, S. (2009). Benchmark priors revisited: On adaptive shrinkage and the supermodel effect in Bayesian model averaging (IMF Working Papers).
- Fernandez, C., Ley, E., & Steel, M. F. J. (2001a). Benchmark priors for Bayesian model averaging. Journal of Econometrics, 100(2), 381–427. https://doi.org/https://doi.org/10.1016/S0304-4076(00)00076-2
- Fernandez, C., Ley, E., & Steel, M. F. J. (2001b). Model uncertainty in cross-country growth regressions. Journal of Applied Econometrics, 16(5), 563–576. https://doi.org/https://doi.org/10.1002/jae.623
- Getis, A., & Griffith, D. A. (2002). Comparative spatial filtering in regression analysis. Geographical Analysis, 34(2), 130–140. https://doi.org/https://doi.org/10.1111/j.1538-4632.2002.tb01080.x
- Gomez-Herrera, E., Martens, B., & Turlea, G. (2014). The drivers and impediments for cross-border e-commerce in the EU. Information Economics and Policy, 28, 83–96. https://doi.org/https://doi.org/10.1016/j.infoecopol.2014.05.002
- Kathuria, V., & Oh, K. Y. (2018). ICT access: Testing for convergence across countries. The Information Society, 34(3), 166–182. https://doi.org/https://doi.org/10.1080/01972243.2018.1438549
- Leamer, E. E. (1978). Specification searches: Ad hoc inference with nonexperimental data. Wiley. https://doi.org/https://doi.org/10.1080/00401706.1981.10486248.
- Lesage, J. P., & Fischer, M. M. (2008). Spatial growth regressions: Model specification, estimation and interpretation. Spatial Economic Analysis, 3(3), 275–304. https://doi.org/https://doi.org/10.1080/17421770802353758
- Lesage, J., & Pace, R. K. (2009). Introduction to spatial econometrics. Chapman & Hall/CRC. https://doi.org/10.1201/9781420064254
- Lesage, J. P., & Parent, O. (2007). Bayesian model averaging for spatial econometric models. Geographical Analysis, 39(3), 241–267. https://doi.org/https://doi.org/10.1111/j.1538-4632.2007.00703.x
- Ley, E., & Steel, M. F. J. (2012). Mixtures of g-priors for Bayesian model averaging with economic applications. Journal of Econometrics, 171(2), 251–266. https://doi.org/https://doi.org/10.1016/j.jeconom.2012.06.009
- Liang, F., Paulo, R., Molina, G., Clyde, M. A., & Berger, J. O. (2008). Mixtures of g priors for Bayesian variable selection. Journal of the American Statistical Association, 103(481), 410–423. https://doi.org/https://doi.org/10.1198/016214507000001337
- Lucendo-Monedero, A. L., Ruiz-Rodríguez, F., & González-Relaño, R. (2019). Measuring the digital divide at regional level. A spatial analysis of the inequalities in digital development of households and individuals in Europe. Telematics and Informatics, 41, 197–217. https://doi.org/https://doi.org/10.1016/j.tele.2019.05.002
- Lutz, S. U. (2019). The European Digital Single Market strategy: Local indicators of spatial association 2011–2016. Telecommunications Policy, 43(5), 393–410. https://doi.org/https://doi.org/10.1016/j.telpol.2018.10.003
- Madigan, D., & York, J. (1995). Bayesian graphical models for discrete data. International Statistical Review/Revue Internationale de Statistique, 63(2), 215–232. https://doi.org/https://doi.org/10.2307/1403615
- Matteucci, N. (2020). Digital agendas, regional policy and institutional quality: Assessing the Italian broadband plan. Regional Studies, 54(9), 1304–1316. https://doi.org/https://doi.org/10.1080/00343404.2020.1782876
- Pick, J. B., & Nishida, T. (2015). Digital divides in the world and its regions: A spatial and multivariate analysis of technological utilization. Technological Forecasting and Social Change, 91, 1–17. https://doi.org/https://doi.org/10.1016/j.techfore.2013.12.026
- Ruiz-Rodríguez, F., Lucendo-Monedero, A. L., & González-Relaño, R. (2018). Measurement and characterisation of the digital divide of Spanish regions at enterprise level. A comparative analysis with the European context. Telecommunications Policy, 42(3), 187–211. https://doi.org/https://doi.org/10.1016/j.telpol.2017.11.007
- Szeles, M. R. (2018). New insights from a multilevel approach to the regional digital divide in the European Union. Telecommunications Policy, 42(6), 452–463. https://doi.org/https://doi.org/10.1016/j.telpol.2018.03.007
- Tiefelsdorf, M., & Griffith, D. A. (2007). Semiparametric filtering of spatial autocorrelation: The eigenvector approach. Environment and Planning A: Economy and Space, 39(5), 1193–1221. https://doi.org/https://doi.org/10.1068/a37378
- Tranos, E., Kitsos, T., & Ortega-Argilés, R. (2020). Digital economy in the UK: Regional productivity effects of early adoption. Regional Studies. https://doi.org/https://doi.org/10.1080/00343404.2020.1826420.
- Tranos, E., & Mack, E. A. (2016). Broadband provision and knowledge-intensive firms: A causal relationship? Regional Studies, 50(7), 1113–1126. https://doi.org/https://doi.org/10.1080/00343404.2014.965136
- Vicente, M. R., & López, A. J. (2011). Assessing the regional digital divide across the European Union-27. Telecommunications Policy, 35(3), 220–237. https://doi.org/https://doi.org/10.1016/j.telpol.2010.12.013
- Zellner, A. (1986). On assessing prior distributions and Bayesian regression analysis with g–prior distributions. In Goel, P., & Zellner, A. (Eds.), Bayesian inference and decision techniques essays in honor of Bruno de Finetti 6 (pp. 233–243). Elsevier. NAID: 10010481040