
 ?Mathematical formulae have been encoded as MathML and are displayed in this HTML version using MathJax in order to improve their display. Uncheck the box to turn MathJax off. This feature requires Javascript. Click on a formula to zoom.
ABSTRACT
From the 1 January 2021 the new Protocol on Northern Ireland (NI) regulates NI’s trade with the European Union (EU) and Great Britain (GB). These rules imply divergence between trade arrangements in NI and GB creating an unprecedented situation where trade frictions arise between two regions of the same country. In this paper we use a multi-sector economic model to capture the impact that potential non-tariff barriers and tariffs will have on trade in NI. Simulation results demonstrate that a weaker relation between GB and the EU will have a greater negative impact on the NI economy. However, this may be reduced by the ability of NI firms to substitute intermediate inputs from GB for EU imports.
INTRODUCTION
The new Protocol on Ireland and Northern Ireland (NP hereafter) initially agreed at the end of 2019, and subsequently amended in January 2020, with the intention of preventing a hard border between Ireland and Northern Ireland (NI) became effective in January 2021. The NP serves the main purposes of safeguarding the so-called Good Friday Agreement and preserving economic stability in both islands as well as the European Union (EU) single market. It allows NI to be part of the UK custom territory whilst maintaining alignment of the region with some EU rules, to ensure that goods can freely circulate between the two sides of the island.
Since the NP became effective, trade frictions between GB and NI have gradually arisen causing some GB businesses to reduce or entirely stop exporting to NI. Increased paperwork costs, EU product requirement checks on goods such as animal and dairy products, delivery delays due to insufficient border control infrastructure, and political tensions have been associated with the introduction of the NP. Despite these issues appearing to be of fundamental relevance, there is limited economic literature focused on the NP specifically. Many studies have tried to estimate the macroeconomic and trade impacts of Brexit on the UK and the EU. However, to the authors’ knowledge, only three papers to date focus on estimating the impact of Brexit in NI directly (Department for the Economy Northern Ireland (DfE), Citation2020; Fraser of Allander Institute (FAI), Citation2019; Lawless, Citation2020). These papers were all published before the UK–EU Trade and Cooperation Agreement (TCA) was finalized, therefore they do not fully reflect the implications of current trading relationships between NI, GB and the EU. In fact, although the new rules are expected to cause significant trade frictions for NI trade with both GB and the EU when compared with a no-Brexit scenario, they reduce significantly the possibility that tariff barriers (TBs) are imposed, provided that the goods traded meet rules of origin.
Accordingly, in this paper we aim to fill the gap and contribute to the policy and academic debate about the economic implications of Brexit specifically in the NI region of the UK by providing a new and updated analysis in the light of the NP and the TCA. We focus specifically on trade of goods and services, that is, we do not consider any impacts of the new trading relations on worker migration, labour productivity or foreign direct investment. In addition, we study NI in isolation. That is, we simulate a set of NP and Brexit scenarios on NI only without considering any spillover from GB. This is for two reasons: first, in this way we are able to isolate the impact of NI only and to disentangle NI idiosyncratic effects; and second, the data that would allow us to carry out a multi-region analysis of such spilloverFootnote1 are not publicly available at the moment.
While it is not possible to precisely predict the exact impact that such a policy would have on trade and the economy of NI, we are able to analyse a set of scenarios that compare the state of the economy with and without Brexit and the NP and observe the direction and magnitude of each of the new trading options. We focus on two central channels of trade frictions caused by the NP and the CTA, namely, tariffs and non-tariff barriers (NTBs). ‘Tariffs are taxes levied on goods imported … as they cross a geographical border’ (Scitovsky, Citation2018, p. 13420). ‘Non-tariff barriers (NTBs) refer to the wide range of policy interventions other than border tariffs that affect trade of goods, services and factors of production’ (Beghin, Citation2018, p. 9650). These include ‘administrative costs, customs formalities, and checks of product of origin’ (Mathieu, Citation2020, p. 10).
Against that background, this paper estimates the macroeconomic and trade implications of the NTBs and potential TBs introduced due to the NP and TCA on NI. To estimate these, we develop and use a computable general equilibrium (NICGE) model for NI.Footnote2 Given that NI is expected to follow EU rules for goods, we assume that a greater divergence between the UK and the EU will be reflected in a greater divergence between NI and GB. On this basis, we develop our central case scenario where NTBs in trade of goods from GB to NI are introduced. Goods between NI and the EU can circulate freely, but NTBs are present in the trade of services. We call this scenario FTA. Second, we develop a scenario where the impact of TBs is explored in addition to the impact of the same NTBs from the first scenario. According to the TCA, zero-tariff and zero-quotas trade between the UK and the EU apply only to goods that respect rules of origin. This means that TBs are not entirely ruled out. For instance, TBs may still apply to goods that cross the North Sea and are at risk of being exported to the EU and do not comply with rules of origin. This scenario, called MFN, provides an indication of the additional impact that the imposition of tariffs on import of goods would have on the NI economy.
Using NICGE, three central conclusions are drawn. First, trading under the new TCA would be less detrimental to NI’s economy than a no-deal scenario. The new trading terms would lead to long-run NI gross domestic product (GDP) being 2.6% below a no-Brexit scenario. Second, due to larger trade barriers for goods imports from GB, NI firms will substitute intermediate demand for GB inputs with inputs from the rest of the world (ROW) (including the EU) in both scenarios. Thus, the ability of substituting GB intermediate inputs and goods for the ROW/EU is crucial for the ability of NI to take advantage of the special trading arrangement. However, under no reasonable circumstances do we find that this could lead to a full compensation of the loss of GDP caused by the introduction of trade restrictions. Hence, there appears to be no evidence that the NP allows NI to enjoy ‘the best of both worlds’.Footnote3 Third, even in the worst-case scenarios where tariffs are applied to the majority of intermediate goods traded across the North Sea, we expect that NTBs between GB and NI are still responsible for around 80% of the impact on key macroeconomic variables such as GDP, consumption and employment.
CONTEXT
The NP and the UK–EU Trade and Cooperation Agreement (TCA)
Three fundamental legislations regulate trade between GB, NI and the EU from January 2021. First, the UK–EU TCA, which establishes, among other things, the conditions under which the trade of goods between the UK (including NI) and the EU can happen with no tariff and no quotas. Second, the NP, which describes trade rules that apply in NI from 1 January 2021. It sets out rules to maintain the common travel area between GB, NI and the Republic of Ireland (ROI), include NI in all future UK trade agreements and avoid a hard border between NI and the ROI (Institute for Government (IFG), Citation2020a). Finally, the United Kingdom Internal Market Act 2020, which allows NI firms to have unfettered access to the GB market (DfE, Citation2020).
According to the NP, in order to avoid a hard border in Ireland, NI’s trade policy will no longer align with GB’s. NI will continue to follow many of the EU’s customs rules and remain part of the EU’s single market for goods, whereas GB will no longer have access to it (Department for Exiting the European Union, Citation2019a; IFG, Citation2020a). Customs checks and rules of origin checks are being introduced gradually for goods entering NI from GB, whereas NI exports of goods to GB remain unaffected (IFG, Citation2020a, Citation2020b).Footnote4 Thus, there will be NTBs for imports of GB goods to NI, but not for export of NI goods to GB. As NI will continue to apply the EU’s customs rules for goods, trade in goods between NI and the EU, as well as countries outside the EU, should remain unaffected.
For services, NI’s rules and regulations will continue to align with GB’s (Cabinet Office, Citation2020, p. 22). Hence, no new barriers to service trade should exist between NI and GB from 1 January 2021.
As post-Brexit EU and UK service rules and regulations may diverge, NI service imports from and exports to the EU may become more costly. Hence, NTBs will emerge between NI and the EU for service trade. Tariffs and NTBs may also change for service trade with countries outside the EU. These are not discussed in detail given the complexity and uncertainty surrounding the current and future potential trade deals between the UK and third countries outside the EU.Footnote5
Tariffs
The NP states that no tariffs will be due for NI’s imports of GB goods unless these are at risk of being moved to the EU directly or ‘forming part of another good following processing’ (Department for Exiting the European Union, Citation2019b, p. 4). However, the TCA allows free-of-tariffs and quotas goods trade on the condition that firms can prove that the goods traded satisfy rules of origin and that no ‘rebalancing’ measures are introduced (Ayele et al., Citation2021). Thus, it is assumed that NI will pay most favoured nation (MFN) tariffs on good imports from GB transformed in NI and sold in the EUFootnote6 only in the case where firms are unable to satisfy rules of origin or in situations where ‘rebalancing’ measures are in place.
Importance of trade to NI
Given the emergence of tariffs and NTBs in both FTA and MFN scenarios, it is important to consider the composition of trade in NI in order to gauge how exposed NI’s economy is. This is described in . In terms of goods purchases, 29.5% of NI’s total purchases came from GB in 2018 (Northern Ireland Statistics and Research Agency (NISRA), Citation2020a), and are now exposed to new NTBs. For service trade, there were 6.8% of total sales to and 5.7% of total purchases from the EU in 2018, and these are exposed to NTBs from 1 January 2021. As 76.9% of total purchases in NI are goods, changes in NTBs with GB will likely have a much stronger impact on NI’s economy (NISRA, Citation2020a).
Table 1. Percentage of Northern Ireland sales and purchases of goods and services by destination, 2018.
LITERATURE REVIEW
There is an extensive literature on the impact of Brexit on the UK economy produced both by academics and institutions. On the academic side, for instance, Ciuriak et al. (Citation2017), Dhingra et al. (Citation2017) and Latorre et al. (Citation2019) estimate the impact of various Brexit scenarios on the UK using computable general equilibrium (CGE) models. On the institutional side, HM Treasury (Citation2016), Kierzenkowski et al. (Citation2016) and the Office for Budget Responsibility (OBR) (Citation2018) also estimate the impact of Brexit scenarios on the UK. The latter two provide in-depth analysis of various impact channels and modelling methods. All these papers expect that trading under World Trade Organization (WTO) terms would be more detrimental to the UK economy than less restrictive trade deals such as a free-trade area and European Economic Area (EEA) membership, but both would have a negative impact compared with a no-Brexit scenario.
However, only a small number of studies focus on the case of NI, despite the crucial position that the region faces. A study by the Fraser of Allander Institute (FAI) (Citation2019) estimates the impact of Brexit scenarios on NI in isolation. As the FAI based its scenarios on the now defunct NI backstop, the results are no longer directly relevant for the current debate. Lawless (Citation2020) looks at the potential impacts of Brexit on the ROI and NI by combining data on TBs and NTBs with trade data and current findings in the literature. The author concludes that given the high exposure of NI to trade with GB and the ROI, a close alignment of the UK to EU rules would minimize the negative impact from the trade shock on both sides of Ireland. Finally, the Department for the Economy of Northern Ireland (DfE) (Citation2020) assesses the direct implications of the NP in isolation using a CGE model. In this analysis, they find that NI GDP could contract between 3.5% and 1.7% depending on the future trading agreement between the UK and the EU. This analysis constitutes a good starting point, but it has at least two main limitations. First, it considers NI–GB trade frictions only, which means that potential NTBs in trade of services between NI and the EU are not considered. Second, this being a government report, the methodology and underlining data are not discussed in great detail. However, we believe that methodological considerations are fundamental in building the foundations for future analysis on post-Brexit trade. In addition, all three papers mentioned were published before the UK and EU TCA was published at the end of December 2020, therefore they rely on a series of scenarios based on hypothetical types of post-Brexit agreements rather than on the actual TCA.
With this paper we make three main contributions. First, we contribute to the literature on the regional impacts of Brexit by focusing on the case of NI, which is still relatively unexplored to date. Second, we contribute to the NI-specific literature by assessing the impact of the NP on trade in NI in the context of the new EU and UK TCA. Third, we provide an extensive discussion of key methodological decisions for our analysis, including the parametrization of our model, which could constitute a starting point for future studies looking at the regional impacts of Brexit in general and at the case of NI in particular.
Given the length limits of this paper, and the limited availability of NI-specific data, the analysis here is limited to the potential impact of Brexit on trade channels, namely, tariffs and NTBs. However, future studies should aim to capture the other effect channels discussed in the literature, such as foreign direct investment, discussed for the UK by Ortiz Valverde and Latorre (Citation2020), HM Treasury (Citation2016) and Kierzenkowski et al. (Citation2016), migration and productivity (OBR, Citation2018), exchange rate, fiscal and deregulation effects (Mathieu, Citation2020), which, to the authors’ knowledge, have not been examined for NI in isolation.
METHODOLOGY
This paper investigates the economic impact of changes to NTBs and potential tariffs on NI’s economy created due to the NP and the UK and EU TCA. To do this, four methodological decisions were made. The first was to choose a general modelling framework. The second was to choose the model specification within this framework. The third was to choose how to calibrate key parameters. The fourth was to define appropriate NTBs and potential TBs for the two main scenarios.
Framework
Overview
The results were computed by developing a computable general equilibrium model for Northern Ireland (NICGE). This is a dynamic discrete-time model. It is calibrated using NI input–output (IO) accounts published by NISRA (Citation2020b). These are aggregated in the model to identify three domestic transactor groups (NI households, firms and government), two external transactor groups (GB and the ROW (excluding GB)), and 18 sectors listed in . The equations applied in NICGEFootnote7 are reported in Appendix A in the supplemental data online.
Table 2. Sectors included in the computable general equilibrium (NICGE) model for Northern Ireland.
Why CGE?
CGE is a modelling framework in which the behaviour of all economic agents (e.g., households, firms and government) and links between these agents are modelled simultaneously (Burfischer, Citation2011; Cardenete et al., Citation2017). This differs from partial equilibrium models where markets are modelled in isolation, as changes in one part of the economy spill over to other parts due to the highly interconnected nature of CGE models (Cardenete et al., Citation2017).
The key advantage of using a CGE framework, as opposed to a partial equilibrium framework, to evaluate trade policy, is that spillover effects between different sectors can be modelled (Latorre et al., Citation2019). This feature is not captured in other popular macroeconomic models such as dynamic stochastic general equilibrium (DSGE) models which tend to target the analysis of short-term business cycle fluctuations at an economy level (Scottish Government, Citation2016). Thus, whereas partial equilibrium and DSGE models only capture direct intra-temporal impacts, CGE models capture both direct and indirect intra-temporal impacts. For instance, in CGE models, a supply shock in one sector not only impacts transactor groups directly, as estimated in partial equilibrium models, but also propagates itself through intermediate supply channels. If prices in one sector increase, perhaps due to a tariff or NTBs, this will lead to increases in other sectors’ intermediate input costs, thereby increasing production costs. As reliance on intermediate supply from other sectors varies across sectors, the increasing production costs will be heterogenous across sectors. Overall, increased production costs will lead to reduced production and increasing prices in other sectors. The increasing prices will impact both domestic and foreign final demand. The initial shock amplifies itself over time and propagates itself through intermediate supply channels. Thus, using a CGE model, both direct and indirect impacts of a shock on transactor groups are captured.
Modelling sectors separately also allows CGE models to identify heterogeneity in policy impacts across sectors. For instance, if different sectors are subject to tariffs and NTBs of varying magnitudes, CGE models would capture this.
Model specification
Due to the large number of equations used in CGE models, these will not all be described here.Footnote8 Instead, the key specification decisions are documented. The key specification decisions for NICGE are the choice of the general form of the production function, the choice of the household’s utility function and the labour market.Footnote9
Production
Production activities in NI’s economy are modelled by defining representative firms in each of the 18 sectors. These firms are assumed to produce a single output, used as a proxy for the range of outputs produced in their sector. In the baseline this corresponds to the output identified in the IO accounts. To model optimal production in each sector, a multilevel constant elasticity of substitution (CES) structure is defined as displayed in .
Figure 1. Constant elasticity of substitution (CES) production function structure.
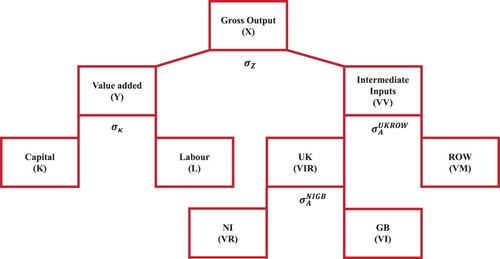
At the two lower levels, the inputs of production are labour, capital and intermediate inputs of different regions (Lecca et al., Citation2013). At the top level of the production structure, gross output is defined as a function of value added and intermediate inputs.Footnote10 The optimal combination of value added and intermediate inputs is the solution of the first order condition of profit maximization (see equation A2 in the supplemental data online). Value added is defined using a CES function where the inputs are capital and labour.
The demand for capital and labour is the result of the first order condition of profit maximization (see equations A3–A5 in the supplemental data online). The ease with which capital and labour may be substituted following a change in relative prices is determined by sector-specific elasticities of substitution as discussed in the section entitled ‘Elasticities’. Similarly, intermediate inputs are aggregated by region (NI, GB, ROW) using a CES Armington structure.Footnote11 Under the Armington assumption, local intermediate inputs and foreign inputs are imperfect substitutes (Armington, Citation1969). The demand for intermediate inputs at both levels of the CES Armington structure is the solution of a cost minimization problem (see equations A9–A12 online).
The main distinction between production processes in each sector is defined through three sets of CES parameters: the elasticity of substitution between capital and labour (); the elasticity of substitution between intermediate inputs and value added (
); and the Armington elasticity of substitution between NI and GB inputs (
) and that between UK and ROW inputs (
). The term
defines the level of substitutability between the factors of production;
defines the level of substitutability between intermediate inputs and value added; and
and
define the level of substitutability between NI and GB inputs and UK and ROW inputs, respectively.
Households
In NICGE, a representative forward-looking household is defined. The household consumes final outputs from the 18 sectors domestically, from GB and the ROW. The household maximizes its utility of consumption both inter- and intra-temporally subject to its budget constraint. The optimal intertemporal consumption path is defined by the Euler equation (see equation A51 in the supplemental data online).
The intra-temporal decisions are summarized in .
Figure 2. Constant elasticity of substitution (CES) utility function structure.
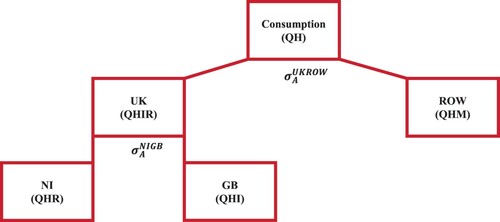
Intra-temporally, the household consumes a constant share in each sector. This simplifying assumption is made, as the focus is on the trade-off between domestic and foreign consumption. Domestic and foreign consumption are imperfect substitutes (Armington assumption). Hence, the household intra-temporally optimizes by maximizing the utility of consumption at each level of the CES utility function, subject to the level of substitutability between domestic and foreign consumption (
). The intra-temporal optimality conditions are presented in equations A52–A56 in the supplemental data online.
The labour market
In the labour market, the real wage is determined using a conventional wage curve where the real take home wage is inversely related to the unemployment rate (see equation A74 in the supplemental data online). This reflects a situation where workers’ bargaining power is stronger when the rate of unemployment is low and it is supported by empirical estimations (Blanchflower & Oswald, Citation2005). The working population is fixed with an initial pool of unemployed workers corresponding to the unemployment rate in NI for the calibration year (see equation A81 online).Footnote12
Calibration
Social accounting matrix (SAM)
The structural parametersFootnote13 in the model are defined by the SAM. The SAM for 2016 is based on the 2016 IO tables for NI (NISRA, Citation2020b). It defines all monetary flows in NI, between sectors, households, government and external transactors, GB and the ROW. The base year represents a benchmark against which counterfactual simulations are compared.
Elasticities
To define production activities, four sets of elasticities are used: and
. It must be noted that, to the authors’ knowledge, no data are accessible for NI-specific elasticities. Thus, where available, UK specific estimates are used.Footnote14
The elasticity of substitution between capital and labour, , is critical in defining production processes across sectors; however, there is little agreement in the literature on precise values of the parameter across different countries let alone sectors (Knoblach & Stöckl, Citation2020). To obtain
by sector, two sources are used. Smith (Citation2008) provides an estimate of aggregate
in the UK using the Bank of England’s Industrial data set (1969–2000). Young (Citation2013) estimates 35 sector-specific
’s for the United States using a non-normalized generalized method of moments (GMM) method (1960–2005, KLEM Database). Hence, Young’s sector-specific
’s are mapped onto the 18 sectors of NICGE and normalized such that their weighted average (weighted by sector size) is 0.4, Smith’s (Citation2008) aggregated UK-specific estimate.Footnote15 The mapped elasticity parameters are defined in .Footnote16
Table 3. Elasticities by sector.
The set of Armington elasticities of substitution () between NI and GB and UK and ROW intermediate inputs are initially set to the same values. This implies that the substitutability between the three inputs is the same.Footnote17 To obtain sector-specific
’s two sources are used. First, Aspalter’s (Citation2016) UK-specific
’s estimated using a two-step GMM method for 1995–2012 Eurostat COMEXT data are mapped onto six NICGE sectors. Global Trade Analysis Project (GTAP) model estimates of
are mapped onto the remaining sectors (Hertel & van der Mensbrugghe, Citation2019). The elasticity of substitution between intermediate inputs and value added (
) is set to 0.3 for all sectors (Harris, Citation1989).
Scenarios
According to the current regulations, it is expected that NTBs will be introduced between the UK and the EU, for:
goods imports from GB;
service imports from the EU; and
service exports to the EU.
However, as discussed in the context section, if the two following conditions coexist, TBs will be imposed on goods imported from GB to NI: (1) firms cannot prove that the goods traded satisfy rules of origin and/or no ‘rebalancing’ measures are introduced; and (2) goods imported from GB to NI are at risk of being moved to the EU directly or following processing.
To reflect this, we consider two scenarios. Scenario 1 (FTA) analyses the impact that the introduction of the aforementioned NTBs will have on the economy of NI. Given the uncertainty around the size of NTBs, sensitivity is conducted around a central value to consider the implication of higher or lower NTBs. Scenario 2 (MFN) analyses the impact of TBs in goods imported from GB to NI in addition to the same NTBs as in scenario 1. Given that we have no indication of the degree with which firms will be able to comply with rules of origin or of the likelihood of the introduction of rebalancing measures, we analyse a worst-case scenario where all goods at risk of being moved to the EU are subject to tariffs.
To estimate NTBs and tariff rates in both scenarios, equations (1–3) are used:
(1)
(1)
(2)
(2)
(3)
(3) where
is the sector;
is the MFN or FTA scenario;
is the imports or exports;
is the percentage equivalent NTB for imports from GB in sector j and scenario s;
is the percentage equivalent NTB for imports of GB goods in sector j and scenario s;
is the percentage equivalent NTB for ROW x in sector j and scenario s;
is the percentage equivalent NTB for x of services to/from the EU in sector j and scenario s;
is the percentage equivalent tariff rate for intermediate inputs from GB in sector j and scenario s;
is the percentage equivalent tariff rate for GB exports to the EU in sector j and scenario s;
is the probability that an import from GB is a good in sector j and scenario s;
is the probability that x to/from the ROW are services in sector j and scenario s;
is the probability that service x to/from the ROW are from the EU in sector j and scenario s; and
is the probability of exporting a good to the EU given exporting to the ROW in sector j and scenario s.
Equation (1) estimates the NTB for imports from GB in each scenario. Equation (2) estimates the ROW NTB for imports and exports; note that these do not necessarily correspond to the same value. These are the NTB for imports from the ROW and that for exports to the ROW. Equation (3) measures the tariffs for GB intermediate goods used in the final production of goods exported to the EU in the MFN scenario.
The tariff and NTB rates used in equations (1–3) to calibrate the scenarios are defined in , and the probabilities are defined in . Tariff rates are defined using OBR (Citation2018). NTBs are defined using HM Government (Citation2018). Two different sources were used as the OBR provided a detailed sectoral disaggregation for tariffs not presented in HM Government (Citation2018). HM Government’s (Citation2018) NTB rates were used as these were specific to goods and services, thus could be mapped onto the NI sectors more accurately. These values were also used by the DfE (Citation2020). However, it should be noted that there is uncertainty about the size of NTBs.Footnote18 Since the proportion of imports and exports of goods and services in each sector differs between NI and the UK, this allows the data to be better adapted to NI than by using a UK sector-specific estimate. No NI specific data were available to estimate the probability of an import or export being a good/service. Hence, total sales data for 2016 published by the NISRA (Citation2018) were used to approximate the proportion of goods and services in imports and exports by trade region. Office for National Statistics (ONS) data for 2017 were used to define and
(ONS, Citation2019, Citation2020). As some sector estimates of these proportions in NI were not publicly available, an expected value method was used to estimate the missing values.Footnote19 Finally,
was estimated using HMRC (Citation2020) data. Tables C4–C8 in Appendix C in the supplemental data online present the raw data used and the mapping completed.
Table 4. Percentage tariff and non-tariff barrier (NTB) rates by sector and scenario.
Table 5. Probabilities associated with equations (1–3).
RESULTS
NTBs and MFN tariffs
In the FTA and MFN scenarios, the shift in trade policy enters the NI economy through NTBs for imports of GB goods, imports of EU services and exports of EU services. In the MFN simulation, an additional TB exists for intermediate goods imports from GB which are used in final production of EU goods exports. Thus, in NICGE, the price of imports from GB and the ROW and cost of exports to the ROW increase in both scenarios, as displayed in .
Table 6. Percentage tariff and non-tariff barrier (NTB) rates for rest of the world imports and exports and Great Britain imports, by scenario.
Macroeconomic impact in the FTA scenario
presents long-run impacts on key macroeconomic indicators in the FTA scenario. The increased costsFootnote20 of imports from GB and the ROW and costs of exports to the ROW reduce NI households’ purchasing power for GB and ROW imports and increase production and sales costs for NI firms, resulting in a reduction in output.
Table 7. Long-term economic impact on key macroeconomic indicators in the FTA scenario.
With lower output, NI firms need to hire fewer workers. Thus, employment falls by 1.2% and the real wages falls by 3.9% due to the reduction in workers’ bargaining power. Reduced employment and wages decrease NI households’ budget. NI households’ income is further reduced by decreases in dividend income and reduced purchasing power due to increasing prices in most sectors. Dividend income decreases due to the reduction in NI firms’ output and increase in production and sales costs in addition to a reduction in investment of 3.3%. NI households respond to the decrease in their income by reducing their consumption by 2.5%.
Increased output prices in most sectors decrease competitiveness of NI firms in international markets. It should be noted that the fall in nominal wage driven by the reduced labour demand partly dampens the increase in output prices caused by the higher trade costs. However, the rise in trade costs dominates the reduced labour cost so that overall output prices increase and competitiveness is still negatively impacted. This leads to a reduction in exports of 7.4%, which is partly due to the frictions in trade of services between NI and the EU and partly induced by the increased output prices. Overall, NI GDP falls by 2.6%. Note that the fall in investment reduces capital stocks so that the price of capital increases, relative to the nominal wage. Thus, firms substitute labour for capital and this is reflected in a fall in employment that is smaller than that in GDP.
Exports to GB decrease by 6.1% due to the increased output prices in NI. ROW exports decrease by a greater proportion (−8.6%) reflecting both the increase in output prices and the additional costs (NTBs) in the trade of services with the EU. As the price of GB imports increases by more than that of ROW imports, both firms and households respond by substituting a proportion of GB imports with ROW imports. For firms, this is displayed in , where intermediate import demand of GB inputs decreases by 5.9%, whereas that for ROW intermediate imports increases by 0.5%.
Macroeconomic impacts in the MFN scenario
Recall that the MFN scenario differs from the FTA scenario only for the presence of tariffs on goods imported from GB to NI that are at risk of being exported to the EU. A greater negative impact can be observed in all the indicators reported in due to the introduction of additional frictions in trade. However, the marginal impact of tariffs is relatively small. This is because tariffs are relatively low when compared with NTBs, as can be seen in , and only apply to goods that are at risk of being moved to the EU. It is worth reiterating that this should be seen as a worst-case scenario where tariffs are applied to all goods at risk of being exported to the EU, therefore the impact of tariffs is likely to be even smaller in reality.
Table 8. Long-term economic impact on key macroeconomic indicators in the MFN scenario.
Identifying the source of the impact in the FTA scenario
presents the results of simulations where NTBs were only applied for trade to and from GB or to and from the ROW for the FTA scenario. These are used to determine what proportion of the economic impacts can be attributed to trade barriers for GB trade and ROW trade, respectively.Footnote21 In the FTA scenario, approximately 82% of the economic impact on key macroeconomic variables can be attributed to NTBs on imports from GB.
Table 9. Source of impact in the FTA scenario.
The expectation that larger trade barriers in UK–EU trade are associated with larger reductions in GDP for the NI economy is consistent with the results of the FAI (Citation2019) and DfE (Citation2020) that use a similar modelling approach. However, the impacts may appear smaller than those found in other CGE studies of the trade barrier impacts of Brexit scenarios on the UK (Ciuriak et al., Citation2017; Dhingra et al., Citation2017; Latorre et al., Citation2019; Ortiz Valverde & Latorre, Citation2020). This is because in this paper we consider NI in isolation, therefore eventual negative spillovers from GB are not considered.
DISCUSSION
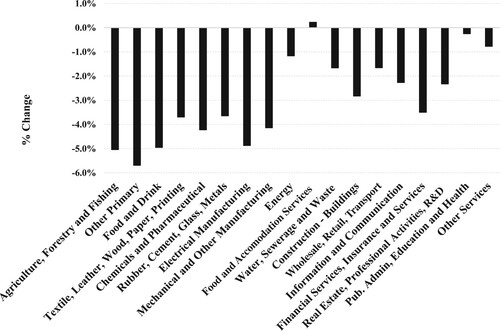
Sectoral results
The macroeconomic results can be decomposed at the sectoral level to see what industries are expected to be more impacted. reports percentage changes in gross value added (GVA) for 18 aggregated industries. The most impacted sectors are agriculture, forestry and fishing, other primary and food and drink, followed by electrical and other manufacturing. These are export-intensive sectors, or sectors that rely on import of intermediate inputs from GB. Sectors with limited exposure to international trade, such as public administration, health and defence, are only marginally impacted. Interestingly, food and accommodation services expand marginally due to the reduction in the cost of domestic inputs including labour.Footnote22
Figure 3. Percentage change in long run value added in the FTA scenario.
Substitution effect between GB and ROW intermediate imports
The large NTBs for intermediate goods entering NI from GB are found to cause a substitution effect in NI firms’ intermediate import sourcing decisions in both scenarios. As goods imported from GB become relatively more expensive than those from the ROW (including the EU), NI firms respond by reducing their demand for GB goods and increasing their demand for ROW goods. At the same time, the price of service imports from the EU increases relative to that for GB service imports which are not directly affected by the NP. This leads to a substitution effect in favour of GB services. However, since over 80% of imports in NI are goods, the substitution effect for goods has a bigger impact than the substitution effect for services (NISRA, Citation2020a). This means that the overall demand for intermediate inputs from GB by NI firms decreases, whereas that from the ROW increases,Footnote23 which suggests that the NP is likely to alter supply chains. Over time, this may reduce the dependence of NI firms on intermediate imports of goods from GB and increase integration into the EU goods market and goods markets from the ROW.
To test whether greater substitutability between GB and ROW (including EU) intermediate inputs could help to mitigate the negative impact of NTBs in the FTA scenario,Footnote24 a set of simulations was run where was increased taking additive increments of 1, from +1 to +9, whilst
remained unchanged.
The results from this sensitivity exercise are presented in . As expected, greater substitutability between GB and ROW intermediate inputs reduces the negative impacts of NI GDP as GB intermediates are substituted with less costly ROW intermediate. However, it appears that the marginal positive impact on GDP gradually reduces as elasticity values become larger. In addition, simulations demonstrate that the negative economic impact does not disappear under any reasonable elasticity value. This is because NTBs in trade of services between NI and the EU are still present and cause a reduction in export compared with the pre-Brexit period. This result contradicts the view that current arrangements in NI allow the region to enjoy the ‘best of both worlds’. However, the increased substitutability does mitigate the negative impact substantially, with GDP being up to 1.1 percentage points higher when the elasticity is increased by 9 points.
Table 10. Sensitivity of key results to the Armington elasticity in the FTA scenario.
NTBs for GB imports driving the results
shows that over 80% of the impacts on key macroeconomic variables in NI are due to NTBs on GB imports in both scenarios. This suggests that the costs of the NP will be mainly driven by trade frictions with GB. However, there is clearly uncertainty about the magnitude of NTBs. The UK government will have an incentive to do everything in its power to reduce the extent to which disruptive checks are performed on the Irish Sea, for example, via the adoption of new technologies. On the other hand, a greater divergence of regulations between the EU and the UK may lead to even larger NTBs.
To account for this, we consider optimistic and pessimistic FTA scenarios where the NTBs for goods and services are set to 5% and 3% and 11% and 14%, respectively, following the upper and lower estimates in HMG (Citation2018). As expected, in the optimistic scenario GDP falls by 1.5%, whereas in the pessimistic scenario the reduction in GDP is 3.5%.Footnote25
CONCLUSIONS
The aim of this paper was to investigate the implications on NI’s economy of the NTBs and potential tariffs introduced due to the NP, especially in the light of the new UK and EU TCA which is not considered in previous studies. To do this, a bespoke NICGE model was developed and used to estimate the impact of the tariffs and NTBs between NI, GB and the ROW which would be introduced.
Four central policy conclusions were drawn. First, GDP is expected to fall by 2.6% under the FTA scenario. This would increase up to 3% if tariffs are imposed on all goods at risk of being moved in the EU. Note that these refer to the impacts on NI in isolation and do not account for potential spillover from GB. Sectors that have a greater exposure to international trade or that rely on intermediate inputs produced in GB, such as agriculture and food, primary and manufacturing, are expected to contract by a greater proportion than services or industries with a largely domestic supply chain. Second, NTBs in GB to NI trade drive around 80% of the negative impact on the NI economy, indicating that efforts to reduce GB to NI frictions are likely to be crucial to limit the negative impact of Brexit in NI. The results from this paper suggest that these efforts could be targeted to those sectors that are likely to experience the greatest economic contraction. In this framework, policymakers could seek to negotiate sector-specific bilateral agreements with the aim to reduce the need for checks. In addition, they could devise policy instruments that increase the provision of technical support especially to small and medium-sized firms and/or that stimulate the development and adoption of technologies that facilitate paperwork and reduce the costs for firms. Third, firms substitute GB for ROW (including EU) import of intermediates. When the substitutability between GB and ROW import is increased, the negative impact on GDP is significantly reduced. This indicates that a greater integration of NI with EU markets can be beneficial for the NI economy. Moreover, this demonstrates how NI could take advantage of the special arrangements in the NP and open goods markets to EU partners in order to minimize costs of production and therefore reduce the negative impacts arising from the imposition of trade barriers. Fourth, under no scenario do we find that the NI economy improves compared with a no-Brexit scenario.
This study can be extended in future to consider spillover effects from GB using an interregional model of NI and GB should the data for it become available. Furthermore, future studies should focus on the implications of the NP and TCA on other propagation channels such as foreign direct investment, labour productivity and migration.
Supplemental Material
Download PDF (1 MB)ACKNOWLEDGEMENTS
The authors thank two anonymous referees and the associate editor for the useful feedback on previous versions of the manuscript. In addition, we thank Samuel Connolly from the Northern Ireland Statistics and Research Agency for his feedback on the modelling strategy and data; Peter McGregor, Kim Swales, University of Strathclyde; and Graeme Roy, University of Glasgow, for their comments on the initial results for the paper. The views expressed in the paper are those of the authors alone.
DISCLOSURE STATEMENT
No potential conflict of interest was reported by the authors.
Additional information
Funding
Notes
1. For a complete interregional analysis, we would need a two-regions NI and rest of the UK input–output table that reports full trade links between industries in the two regions such as that used by Figus et al. (Citation2018) for the case of Scotland.
2. This is comparably similar to that used by the FAI (Citation2019).
3. The expression ‘the best of both worlds’ was initially introduced by HM Government (Citation2016). In the forefront of this policy paper, former Prime Minister David Cameron explained how the special status of the UK in the EU ‘gives [the country] the best of both worlds’ (p. 5). Subsequently, the expression was used by Cabinet Office Minister Michael Gove in reference to the Northern Ireland Protocol during an interview for ITV (Citation2020).
4. This is currently the UK government’s policy stance; it is unknown whether this will be the case in practice in the future.
5. See Appendix B1 in the supplemental data online for further discussion.
6. This may not be the case in practice as tracing the source of intermediate inputs will be very costly and due to inefficiencies in identifying at-risk goods.
7. The NICGE is solved using a system of non-linear equations using the software package GAMS.
8. See Lecca et al. (Citation2013, Citation2014) for a more methodological discussion.
9. For other specification decisions, see Appendix B2 in the supplemental data online.
10. See Appendix A in the supplemental data online for the full mathematical presentation of the model.
11. This structure has two levels: one between NI and GB and the other between the UK and the ROW.
12. Other labour market closures are available as options for the model and are used as sensitivity checks, as indicated, for instance, in note 22 below.
13. Parameters not discussed in the main text are defined in Appendix B4 in the supplemental data online.
14. A sensitivity analysis was completed to test the consistency of the results using different elasticities.
15. This choice had little impact on the result; see Appendix B3 in the supplemental data online.
16. All data used for elasticity mapping are available in Tables C1–C3 in the supplemental data online; Table C8 online defines how categories are mapped.
17. As this is a strong assumption, sensitivity checks are completed later.
18. See the section ‘NTBs for GB imports driving the results’.
19. See Appendix D in the supplemental data online.
20. When words such as ‘fall’ and ‘reduction’ are used, this is relative to the baseline of no Brexit.
21. The difference between the combined impact of tariffs and NTBs and the sum of the isolated impacts is very small and thus not presented.
22. Appendix E2 in the supplemental data online tests the sensitivity of this result to the assumed labour market closure and finds that if wages do not adjust downward this small expansion disappears.
23. Sensitivity checks are completed to determine how sensitive this result is to the relative size of the Armington elasticities of substitution between NI–GB and UK–ROW, respectively. Sensitivity checks were also performed on the elasticity of substitution between capital and labour (see Appendix E1 in the supplemental data online).
24. Results for the MFN are comparatively similar and therefore not reported here for the sake of brevity.
25. A full set of results is reported in Appendix E3 in the supplemental data online. The results are qualitatively similar to the FTA scenario, but different in magnitude.
REFERENCES
- Armington, P. S. (1969). A theory of demand for products distinguished by place of production. Staff Papers (International Monetary Fund), 16(1), 159–178. https://doi.org/https://doi.org/10.2307/3866403
- Aspalter, L. (2016). Estimating industry-level Armington elasticities For EMU countries (Department of Economics Working Paper Series No. 217). WU Vienna University of Economics and Business.
- Ayele, Y., Gasiorek, M., Holmes, P., Jerzewska, A., & Walmsley, S. (2021). Taking stock of the UK–EU trade and cooperation agreement: trade in goods (UK Trade Policy Observatory, January. Volume Briefing Paper No. 02). University of Sussex.
- Beghin, J. (2018). Non-tariff barriers. In The new Palgrave dictionary of economics. Palgrave Macmillan. https://doi.org/https://doi.org/10.1057/978-1-349-95189-5_2188
- Blanchflower, D., & Oswald, A. (2005). The wage curve reloaded (Working Paper Series No. 11338). National Bureau of Economic Research (NBER).
- Burfischer, M. (2011). Introduction to computable general equilibrium models. Cambridge University Press.
- Cabinet Office. (2020). The UK’s Approach to the Northern Ireland Protocol (point 58). https://assets.publishing.service.gov.uk/government/uploads/system/uploads/attachment_data/file/887532/The_UK_s_Approach_to_NI_Protocol_Web_Accessible.pdf
- Cardenete, M., Guerra, A., & Sancho, F. (2017). Applied general equilibrium – An introduction (2nd ed). Springer.
- Ciuriak, D., Dadkhah, A., & Xiao, J. (2017). Brexit trade impacts: Alternative scenarios. https://doi.org/http://doi.org/10.2139/ssrn.2981314
- Department for Exiting the European Union. (2019a). Agreement on the withdrawal of the United Kingdom of Great Britain and Northern Ireland from the European Union and the European Atomic Energy Community. https://www.gov.uk/government/publications/new-withdrawal-agreement-and-political-declaration
- Department for Exiting the European Union. (2019b). Policy paper: New Protocol on Ireland/Northern Ireland and Political Declaration – Revised Protocol to the Withdrawal Agreement. https://www.gov.uk/government/publications/new-protocol-on-irelandnorthern-ireland-and-political-declaration
- Department for the Economy of Northern Ireland (DfE). (2020). Direct economic impact of the Northern Ireland Protocol on the NI Economy. https://www.economy-ni.gov.uk/publications/direct-economic-impact-northern-ireland-ni-protocol-ni-economy
- Dhingra, S., Huang, H., Ottaviano, G., Paulo Pessoa, J., Sampson, T., & Van Reenen, J. (2017). The costs and benefits of leaving the EU: Trade effects. Economic Policy, 32(92), 651–705. https://doi.org/https://doi.org/10.1093/epolic/eix015
- Figus, G., Lisenkova, K., McGregor, P., Roy, G., & Swales, K. (2018). The long-term economic implications of Brexit for Scotland: An interregional analysis. Papers in Regional Science, 97, 91–115. https://doi.org/https://doi.org/10.1111/pirs.12349
- Fraser of Allander Institute (FAI). (2019). The direct long-term trade impacts of EU exit scenarios on Northern Ireland. FAI.
- Harris, R. (1989). The growth and structure of the UK regional economy 1963–85. Avebury.
- Hertel, T. W., & Van der Mensbrugghe, D. (2019). Behavioural parameters. In GTAP 10 Data Base Documentation, ch. 14, in Aguiar, A., Chepeliev, M., Corong, E., McDougall, R., & van der Mensbrugghe, D., The GTAP Data Base: Version 10. Journal of Global Economic Analysis, 4(1), 1–27. https://doi.org/https://doi.org/10.21642/JGEA.040101AF
- HM Government. (2016). The best of both worlds: The United Kingdom’s special status in a reformed European Union.
- HM Government. (2018). EU exit: Long-term economic analysis. Technical reference paper.
- HM Treasury. (2016). The long-term economic impact of EU membership and the alternatives. HM Treasury Analysis.
- HMRC. (2020). National statistics – UK regional trade in goods statistics quarter 4 2019. https://www.gov.uk/government/statistics/uk-regional-trade-in-goods-statistics-fourth-quarter-2019
- Institute for Government (IFG). (2020a). Brexit deal: The Northern Ireland protocol. https://www.instituteforgovernment.org.uk/explainers/brexit-deal-northern-ireland-protocol
- Institute for Government (IFG). (2020b). Irish backstop. https://www.instituteforgovernment.org.uk/explainers/irish-backstop
- ITV. (2020). Brexit: Gove says Northern Ireland businesses get ‘best of both worlds’ with access to both EU and UK markets. https://www.itv.com/news/2020-12-08/brexit-gove-says-northern-ireland-businesses-get-best-of-both-worlds-with-access-to-both-eu-and-uk-markets-
- Kierzenkowski, R., Pain, N., Rusticelli, E., & Zwart, S. (2016). The economic consequences of Brexit: A taxing decision. OECD Economic Policy Paper, 16(1–37).
- Knoblach, M.., & Stöckl F. (2020). What determines the elasticity of substitution between capital and labor? A literature review. Journal of Economic Surveys, 34(4), 847–875. https://doi.org/https://doi.org/10.1111/joes.12366
- Latorre, M., Olekseyuk, Z., Yonezawa, H., & Robinson, S. (2019). Brexit: Everyone loses, but Britain loses the most. Peterson Institute for International Economics – Working Paper, 1–21.
- Lawless, M. (2020). Brexit and trade on the island of Ireland. Revue de l’OFCE, 167(3), 95–120. https://doi.org/https://doi.org/10.3917/reof.167.0095
- Lecca, P., McGregor, P. G., Swales, J. K., & Yin, Y. (2014). Balanced budget multipliers for small open regions within a federal system: Evidence from the Scottish variable rate of income tax. Journal of Regional Science, 54(3), 402–421. https://doi.org/https://doi.org/10.1111/jors.12113
- Lecca, P., McGregor, P., & Swales, K. (2013). Forward-looking and myopic computable general equilibrium models: How significant is the distinction? Economic Modelling, 31, 160–176. https://doi.org/https://doi.org/10.1016/j.econmod.2012.11.010
- Mathieu, C. (2020). Brexit: What economic impacts does the literature anticipate. Revue de l’OFCE, 167(3), 1–40. https://doi.org/https://doi.org/10.3917/reof.167.0043
- Northern Ireland Statistics and Research Agency (NISRA). (2018). Northern Ireland broad economy sales and exports statistics: Goods and services results 2016. https://www.nisra.gov.uk/sites/nisra.gov.uk/files/publications/BESES-Goods-Services-Publication-2016.PDF
- Northern Ireland Statistics and Research Agency (NISRA). (2020a). Overview of Northern Ireland trade, 15th June 2020. https://www.nisra.gov.uk/sites/nisra.gov.uk/files/publications/Overview-of-NI-Trade-June-2020.pdf
- Northern Ireland Statistics and Research Agency (NISRA). (2020b). Northern Ireland Statistics and Research Agency – NI Economic Accounts Project – 2015 and 2016 Experimental results. https://www.nisra.gov.uk/publications/ni-economic-accounts-project-2015-and-2016-experimental-results
- Office for Budget Responsibility (OBR). (2018). Brexit and the OBR’s forecasts (Discussion Paper No.3).
- Office for National Statistics (ONS). (2019). International exports of services from subnational areas of the UK. https://www.ons.gov.uk/businessindustryandtrade/internationaltrade/datasets/internationalexportsofservicesfromsubnationalareasoftheuk
- Office for National Statistics (ONS). (2020). LFS: ILO unemployment rate: Northern Ireland: All: %: SA. https://www.ons.gov.uk/employmentandlabourmarket/peoplenotinwork/unemployment/timeseries/zsfb/lms
- Ortiz Valverde, G., & Latorre, M. C. (2020). A computable general equilibrium analysis of Brexit: Barriers to trade and immigration restrictions. The World Economy, 43(3), 705–728. doi:https://doi.org/10.1111/twec.12881
- Scitovsky, T. (2018). Tariffs. In The new Palgrave dictionary of economics. Palgrave Macmillan. https://doi.org/https://doi.org/10.1057/978-1-349-95189-5_1844
- Scottish Government. (2016). Computable general equilibrium modelling: Introduction. https://www.gov.scot/publications/cge-modelling-introduction/
- Smith, J. (2008). That elusive elasticity and the ubiquitous bias: Is panel data a panacea? Bank of England: Working Paper 342, 1–30.
- Young, A. (2013). U.S. elasticities of substitution and factor augmentation at the industry level. Macroeconomic Dynamics, 17(4), 861–897. https://doi.org/https://doi.org/10.1017/S1365100511000733