
 ?Mathematical formulae have been encoded as MathML and are displayed in this HTML version using MathJax in order to improve their display. Uncheck the box to turn MathJax off. This feature requires Javascript. Click on a formula to zoom.
ABSTRACT
The UK government has committed to ‘levelling up’ regional economic performance. Through deriving geographically disaggregated estimates of total factor productivity from plant-level data, we show that the productivity advantage of London is far greater than differences between other regions. Evidence is then provided on the extent to which differences in multinational ownership, trade involvement, enterprise structure, plant age, research and development, subsidization, size, and industrial structure explain the London productivity advantage. Less than half can be explained by these characteristics, which suggests that they should not be the main focus of policy to reduce spatial productivity differentials.
INTRODUCTION
In the last 20 years, except for a period in 2010–14 when ‘austerity’ dominated the policy landscape, improving productivity has been a central objective of the UK’s industrial policy (Cook et al., Citation2020). Whilst the exact policy practice has varied across different governments, the importance of productivity has been recognized and emphasized throughout. In the context of continued growth in regional disparities (e.g., McCann, Citation2016; Zymek & Jones, Citation2020), there has recently been greater focus on the need for spatial ‘rebalancing’ (cf. Martin et al., Citation2016; UK2070 Commission, Citation2019). Indeed, since coming to power in 2019, the current Conservative government has made ‘levelling-up’ a policy priority (HM Treasury, Citation2020, Citation2021a). The recent policy paper Build Back Better: Our Plan For Growth goes so far as to describe changing the pattern of previous decades, in which London and the South East of England have enjoyed larger increases in prosperity than the rest of the country, as the government’s ‘primary objective’ (HM Treasury, Citation2021a).
Formulation of policy to achieve this objective require information on appropriate measures of productivity at a regionally disaggregated level. Such information does not currently exist for the UK, and this has hampered policymakers in the recent past. In particular, the 2017 industrial strategy, which has been superseded by the framework set out in the Build Back Better document, required the creation of ‘local industrial strategies’ (Department for Business, Energy and Industrial Strategy (BEIS), Citation2017). Developed by local enterprise partnerships (LEPs),Footnote1 they were to set out ‘clearly defined priorities for how cities, towns and rural areas will maximize their contribution to UK productivity’ (BEIS, Citation2018).Footnote2 However, a major issue for the LEPs was (and continues to be) the lack of information on spatial variations in productivity. As a result, the published local industrial strategies tended to rely on labour productivity data from the Office for National Statistics (ONS),Footnote3 which is aggregated to a small number of broad sectors at local level. However, it is generally recognized that a superior measure is total factor productivity (TFP), which measures the productivity of all factors of production (i.e., labour, capital and intermediate inputs). Labour productivity will – de facto – be higher in firms that are capital- or intermediate-input intensive. Increasing labour productivity can thus be achieved by substituting capital or intermediate inputs for labour (Harris & Moffat, Citation2017b, sect. IV) without any improvement in the efficiency of, or technology employed by, the firm.
While an important by-product of this paper is to provide estimates of TFP at different spatial levels (here we focus on administrative regions, LEPs and major cities), its main contribution is to investigate the source of London’s TFP advantage using a Blinder–Oaxaca decomposition (Blinder, Citation1973; Oaxaca, Citation1973). This shows whether it can be explained by differences in a range of plant characteristics such as multinational ownership, trade involvement, enterprise structure, plant age, engagement in research and development (R&D), subsidization, size and industrial structure. Such information will also be useful for various tiers of government in allowing them to identify the extent to which policy should focus on improving plant characteristics, through the ‘mix’ of plants in any localisty, or whether policy should focus on underlying drivers of spatial differences in productivity such as infrastructure and agglomeration economies.
The rest of the paper is structured as follows. The next section briefly overviews the potential sources of spatial productivity differences. This is followed by a discussion of the methodology used to construct plant-level estimates of TFP and to decompose London’s TFP advantage. The results are then discussed. The final section concludes.
DETERMINANTS OF REGIONAL PRODUCTIVITY DIFFERENCES
There have been few attempts at quantifying the contribution of particular plant characteristics to regional productivity differentials. For the UK, Harris and Moffat (Citation2017a) disaggregate the Scotland–rest of the UK productivity gap using a simplified version of the methodology employed below and find that Scotland’s productivity disadvantage in the largest industries was mostly explained by plant characteristics, specifically Scotland’s relatively old plants and its higher proportion of plants that do not belong to larger enterprises. Other studies have tended to focus on industry composition and do not consider the many other determinants of TFP (e.g., Zymek & Jones, Citation2020). The determinants of TFP have been reviewed extensively elsewhere (cf. Harris & Moffat, Citation2015b, p. 2017b; Tsvetkova et al., Citation2020), so here we only provide a brief discussion with the emphasis on those determinants that are observed in the dataset used below.
Spatial variables such as those identified by Tsvetkova et al. (Citation2020) – governance, infrastructure, physical geography and agglomeration economies – lie at the root of spatial differences in productivity. Agglomeration economies, in particular, have received particular attention in the literature. These are benefits that arise from being located in the vicinity of large concentrations of other plants and may be an intra-industry phenomenon, arising from the localization of particular industries (Marshall, Citation1890), or an inter-industry phenomenon, resulting from diversity in the industrial structure of the local economy (Jacobs, Citation1970). Empirical analyses of the effects of agglomeration economies on productivity have produced mixed results (Melo et al., Citation2009; de Groot et al., Citation2016). The accessibility of different types of infrastructure can also increase productivity (Akerman et al., Citation2015; Ahlfeldt & Feddersen, Citation2018; DeStefano et al., Citation2018). Higher quality governance may also improve productivity. For example, a recent paper by Fadic et al. (Citation2019) found that the efficiency of public administration boosts firm-level productivity growth in Italy. One potential way of achieving an improvement in the quality of governance is through the decentralization of powers, although the empirical evidence on the effects of decentralization is mixed (Blöchliger & Égert, Citation2013). All the aforementioned variables impact productivity directly, and also indirectly via their effect on plant characteristics. We will now discuss those plant characteristics that are used in the analysis below.
Multinational ownership, which refers here both to ownership by UK-owned firms that operate plants abroad and to ownership by foreign-owned firms, has been shown to be positively related to productivity (ONS, Citation2017). With respect to UK-owned firms engaged in outward foreign direct investment (FDI), this association implies that firms must be more productive in order to overcome the barriers to overseas investment. In relation to foreign-owned plants, the positive association has been attributed to ‘cherry-picking’, whereby foreign-owned firms acquire plants that are more productive. However, the association could reflect a causal relationship if belonging to a multinational firm provides access to superior overseas technology. For the UK, Bloom et al. (Citation2012) find a positive effect of US ownership on productivity, but Criscuolo and Martin (Citation2009) and Harris and Robinson (Citation2002) find that the higher productivity of foreign-owned plants is more the result of cherry-picking.
The literature has also found that exporting and importing has a positive association with productivity (Wagner, Citation2007; Harris & Moffat, Citation2015a). Similar to multinational ownership, it is unclear whether the relationship between exporting and productivity is causal because firms that are more productive may self-select into exporting. Learning-by-exporting could arise if firms benefit from knowledge flows from international customers or because the more competitive nature of international markets requires them to improve their productivity. Importing could also increase productivity by opening channels through which knowledge may be diffused.
The effect of age on productivity is theoretically ambiguous because plants may ‘learn-by-doing’ (Arrow, Citation1962; Thompson, Citation2012), but may also suffer technical obsolescence as they age (Aghion & Howitt, Citation1992). Productivity growth decompositions have tended to show that new plants have higher TFP than existing plants and therefore contribute positively to productivity growth (Disney et al., Citation2003; Harris & Moffat, Citation2017a). While this is consistent with a negative effect of age on productivity, such decompositions do not show that age causes lower productivity.
Receipt of a subsidy may increase TFP if it increases the rate of learning-by-doing. On the other hand, subsidies can shelter firms from the disciplining effects of the market incentives faced by firms and create a culture of ‘rent-seeking’ (Porter, Citation1990). In such circumstances, the management of firms may focus less of their efforts on innovation and improving efficiency (Leibenstein, Citation1966). For the UK, Harris and Moffat (Citation2020) find a positive but small effect of subsidization on TFP in some manufacturing industries.
The size of the plant and the structure of the enterprise to which it belongs may have effects on productivity. Most obviously, larger plants and plants belonging to larger firms may benefit from economies of scale. Conversely, the greater complexity of managing a large organization, especially one that is split across multiple sites, may provide smaller firms with a productivity advantage (Williamson, Citation1967). Recent empirical evidence from Berlingieri et al. (Citation2018) confirms the positive relationship between firm size and productivity observed in previous studies but finds that it is stronger in manufacturing than services.
R&D is likely to have a direct effect on TFP if it leads to process innovations that improve plant efficiency, or the creation of new products that are produced using superior technology than that used in older product lines. R&D may also have an indirect effect by increasing the ability of the firm to internalize external knowledge, that is, its absorptive capacity (Cohen & Levinthal, Citation1989, Citation1990). In line with theory, the empirical literature has consistently found positive effects of R&D on productivity although there is substantial variation in the size of the effects obtained (Hall et al., Citation2010). While relatively few studies have used UK data, these have also obtained positive effects (Griffith et al., Citation2006; Rogers, Citation2010).
Industry composition has the potential to play a large role in explaining regional differences in productivity since industries operate with very different technologies. The reallocation of resources from low to high productivity sectors has long been recognized as an important part of the development process (see Krüger, Citation2008, for a review of the literature). Consequently, the share of output or employment accounted by different industries is assumed to explain a large proportion of cross-country variation in productivity. Chanda and Dalgaard (Citation2008) find evidence in support of this view but Caselli (Citation2005) finds that cross-country differences in TFP are largely explained by within-industry differences rather than sectoral composition. Similarly, previous analyses have found that industry composition plays a minor role in explaining regional productivity differences in the UK (Martin et al., Citation2018, Citation2019; Zymek & Jones, Citation2020). An interesting exception is Webber et al. (Citation2009) who find that controlling for industry mix substantially reduces but does not eliminate the size of regional productivity differentials in output per employee.
DATA AND METHODOLOGY
The analysis involves two stages. First, estimates of TFP are obtained from plant-level panel data covering the period 1997–2018 from the ONS’s Annual Business Survey (ABS) using a modified version of the approach used by Harris and Moffat (Citation2015b). The supplemental data online provides details of the data and methodology used as well as the parameter estimates used to generate TFP values. However, some deficiencies of the data are worth mentioning. First, the measure of employment is simply a count of those employed in the plant and, as such, is not adjusted for human capital or hours worked. Second, capital is derived from information on investment in plant and machinery and hence does not capture intangible capital. Regional variations in human capital, hours worked or intangible capital will therefore be reflected in the measure of TFP and, to the extent that they vary across areas, lead to geographical differences in TFP. Weighted meansFootnote4 of the natural logarithm of the TFP estimates for the period 2011–18Footnote5 are compared for the 11 administrative regions of Great Britain, 12 leading cities, 39 English LEPsFootnote6 (supplemented with ‘invented’ LEPs for the Glasgow, Edinburgh, Aberdeen, Cardiff and Swansea city-regions, and the rest of Scotland and Wales to ensure complete coverage of Great Britain) and 380 local authority districts.
In the second part of the analysis, the difference in the weighted mean of the natural logarithm of estimated TFP across different regions is decomposed using the Blinder–Oaxaca approach. This method, and variants thereof, have been used frequently in labour economics to decompose wage differentials across gender and ethnic groups (Altonji & Blank, Citation1999), but have rarely been applied to regional productivity differentials. One example is Görzig et al. (Citation2010), who provide a decomposition of the East–West productivity gap in Germany, but their analysis is weakened by their consideration of only sector and size as plant characteristics.
For the two areas being compared (labelled here as for London and
for the rest of Great Britain),
is assumed to be a linear function of plant characteristics ():
(1)
(1) where
is a vector of variables measuring plant characteristics and a constant; and
is the associated vector of slope coefficients and an intercept term. The difference in the mean of
across the two areas can be written as:
(2)
(2) Rearranging equation (2) gives:
(3)
(3)
Table 1. Definitions and weighted means of variables used in Blinder–Oaxaca decompositions.a
The first term (after the equals sign) shows that part of the difference in between London and the rest of Great Britain that is predicted by differences in observed plant characteristics. This is referred to as the ‘endowments’ or ‘explained’ component. The second term measures that part of the difference in
that is attributable to differences in coefficients. This is the ‘coefficients’ or ‘unexplained’ component which shows the hypothetical difference in
if plants in London had the same characteristics as those in the rest of Great Britain.Footnote7 The third component in equation (3) is an interaction term that allows for the effect of differences in both plant characteristics and coefficients across the two areas.Footnote8 In the results presented below, this third term was usually small. Estimates of
are usually obtained by ordinary least squares estimation of equation (1) using a sample of plants in region
and
is estimated by the sample mean of the regressors in area,
.
The decomposition shown in equation (3) is formulated from the viewpoint of the rest of Great Britain, in the sense that is used to calculate the endowments effect and
is used to calculate the coefficients effect. The difference in means (equation 2) can also be expressed from London’s perspective:
(4)
(4)
In the results section below, the outcomes from using equations (3) and (4) are presented initially when comparing London versus the rest of Great Britain, but thereafter only the results from equation (3) are reported (for the full set of results, see Table A3 in the supplemental data online) since the results from the two approaches are broadly similar.
The ‘endowments’, ‘coefficients’ and ‘interaction’ term can be decomposed to show the contribution from individual regressors. Below, we aggregate the regressors into the following groups: multinational ownership (including variables measuring US owned, EU owned; other foreign owned, UK owned engaged in outward FDI, and UK owned not engaged in outward FDI); trade (exporting, importing, exporting and importing, and no involvement in trade); enterprise structure (single-plant enterprise, multi-plant/single-region enterprise and multi-regional enterprise); plant age; R&D;Footnote9 subsidy; plant size (five dummy variables indicating the size of the plant); industry (dummy variables indicating the two-digit Standard Industrial Classification (SIC), industry to which the plant belongs) and time. Although the time variable does not measure a plant characteristic, its inclusion is important because panel data are used in the decomposition, and if regions differ in their rates of plant opening or closure and mean TFP levels change over time, this could undermine regional comparisons. In practice, this variable explains very little of regional productivity differences.
When a group of mutually exclusive binary variables are included in the model, the choice of the ‘baseline’ group (or omitted category) in equation (1) will generally affect the results obtained from the decompositions in equations (3) or (4). To avoid this, we use the approach of Yun (Citation2005). This entails, first, the calculation of the mean of the estimated coefficients of the binary variables in a group. This is then added to the intercept and subtracted from the estimated coefficients for each variable in the group. This transformation avoids the effect of belonging to the baseline group being subsumed into the intercept term as in equation (1).
The interpretation of the ‘endowments’ and ‘coefficients’ components requires some discussion. Given that the two groups are defined by geography and the ‘endowments’ refer to plant characteristics, it may be tempting to describe the ‘endowments’ component as measuring the contribution of ‘non-spatial’ factors and the ‘coefficients’ component as capturing the contribution of ‘spatial’ factors. However, such terminology is misleading since the geographical distribution of plant characteristics is very likely to be a function of ‘spatial’ factors. For example, foreign-owned enterprises may choose to locate in London because of its superior infrastructure. It is therefore not possible to classify variables as ‘spatial’ or ‘non-spatial’. Instead, because the observed plant characteristics are functions of their location, the ‘endowment’ effects may be interpreted as the indirect effect of location that operates via the observed plant characteristics. The ‘coefficients’ component captures the direct effects of spatial variables on TFP and the effects that operate via unobserved plant characteristics (Huber, Citation2015).Footnote10
RESULTS
Productivity levels
The top panel of shows the mean and 90th percentile of ln TFP for plants operating in the 11 administrative regions of Great Britain during the period 2011–18. Regions are ranked from highest (London) to lowest (Wales), based on the mean for all sectors (column 1). The correlation between the means for manufacturing and services is 0.90 indicating that high productivity regions tend to perform well in both sectors. The gap between the regions with the highest and lowest productivity for all sectors (column 1) is 0.34, and this increases to 0.69 at the 90th percentile (column 2). The last row in the top panel of shows the gap between London and the next highest region: the South East in services and Scotland in manufacturing. This shows (with respect to highs and lows in columns 3 and 5) that some 52–54% of the top-to-bottom gap is accounted for by the gap between London and the next highest region. Productivity differences between London and other regions are therefore far greater than differences between other regions. also shows that, aside from Scotland, productivity levels generally fall when moving towards the north and periphery of Great Britain (cf. McCann, Citation2016).
Table 2. Weighted means and 90th percentiles of ln TFP, 2011–18 by region/city and broad sector.
The lower panel of presents equivalent information for plants operating in 11 major urban areas. Across all sectors, other cities have substantially lower productivity than London. The gap between the highest and lowest ranked city for all sectors (column 1) is not as large as for regions, but increases from 0.25 to 0.59 at the 90th percentile (column 2). The productivity differential between London and the lowest ranked city is similar in manufacturing (column 3) and services (column 5). However, the last row in shows that the gap between London and the next highest ranked city (Edinburgh for services and Cardiff for manufacturing) is relatively small in manufacturing but far larger in services.
Data for the LEPs and local authorities are presented in a and b, respectively. a shows significantly higher TFP for the Pan London LEP and LEPs to the north-west and south-west of the Pan London LEP (namely, Thames Valley, Enterprise M3, Hertfordshire and Coast-to-Capital). Nine of the 12 LEPs with the highest productivity (ranging from 0.111 to 0.332) are within 100 miles of Central London (the other three being Greater Aberdeen, which is ranked first, Edinburgh and Glasgow). The gap between the highest and lowest ranked LEP (Cornwall and the Isles of Scilly) was 0.453. As with larger administrative regions (), aside from Scotland, shows declining productivity levels towards the more peripheral areas of Great Britain. b, which presents results at the local authority level, confirms the higher productivity of areas surrounding London (25 London Boroughs out of 33 are in the highest tier).
Figure 1. Weighted mean ln TFP, 2011–18: (a) local enterprise partnerships; and (b) local authorities.

Source of the London–rest of Great Britain productivity gap
The results presented in the previous section show that there exist substantial differences in productivity across areas, especially between London and other regions. However, the right-hand-side of shows that the difference in means of the variables measuring plant characteristics tend to be small. For example, the proportion of plants that belong to multinationals is 0.225 (= 1 − 0.775) in London and 0.220 in the rest of Great Britain. Moreover, the relative mean of some variables would be expected to lead to a productivity disadvantage for London. For instance, 2.6% of plants in the rest of Great Britain have positive R&D stocks, compared with only 1.7% in London. This suggests that differences in observed plant characteristics are unlikely to play the dominant role in explaining the London productivity advantage. The purpose of the Blinder–Oaxaca decomposition is to confirm whether this is the case.
Columns 1 and 2 of presents results from estimation of equation (1) for all sectors. These show some large differences in the estimated coefficients. For example, the estimated effect of the different forms of multinational ownership and R&D are higher in London. Exporting, when done with or without importing, also has a stronger effect on TFP in London than in the rest of Great Britain. There is a more clear-cut positive relationship between size and TFP in the rest of Great Britain than London and belonging to a multi-regional enterprise has a much larger negative association with TFP in London. Large differences in coefficients are also found in manufacturing (columns 3 and 4). The regression results therefore point towards an important role for the ‘coefficients’ component in the Blinder–Oaxaca decomposition.
Table 3. Weighted ordinary least squares (OLS) regression of plant-level ln TFP on plant characteristics, 2011–18.
This is confirmed in . For all sectors, differences in plant characteristics (‘endowments’) contribute only 0.072 of the 0.250 gap between London and the rest of Great Britain (column 1). The unexplained component of the gap, which reflects differences in the estimated coefficients across London and the rest of Great Britain, is more than twice as large as the explained component. The interaction effect (0.029) explains less than 12% of the total differential. These results therefore imply that the direct effect of spatial drivers of productivity such as infrastructure and agglomeration economies and/or the indirect effect via unobserved plant characteristics far exceed the direct effect that occurs via observed plant characteristics.
Table 4. Weighted Blinder–Oaxaca decomposition of plant-level ln TFP, 2011–18: London versus the rest of Great Britain.
Column 2 in shows the results obtained from the decomposition using equation (4) in which estimates of are used to calculate the endowments effect and estimates of
are used to calculate the coefficients effect. This has the effect of inflating the ‘endowments’ component but it still accounts for only 40% of the total differential. As the results obtained from using equations (3) and (4) are similar, we will focus on those obtained from equation (3).
As discussed above, the regressors are aggregated into groups labelled multinational ownership, trade, age, enterprise structure, R&D, subsidy, size, industry and time. For the disaggregated results, see Table A3 in the supplemental data online. The breakdown of ‘endowments’ in column 1 of show that the two most important sources of the London productivity advantage are its industrial structure and its relatively young plants. Of the unexplained or ‘coefficients’ component, differences in the value of the constant account for 0.268 of the 0.250 difference between London and the rest of Great Britain.Footnote11 Smaller contributions come from the superior productivity performance (as measured by coefficient differences) of smaller plants and single-plant enterprises in London. Offsetting the London productivity advantage is the larger negative impact on TFP in London of belonging to UK-owned enterprises not engaged in outward FDI, plant age and belonging to multi-regional enterprises (for these detailed results, see Table A3, column 1, in the supplemental data online).
The results for manufacturing are also presented in (columns 3 and 4);Footnote12 the (weighted) mean difference in productivity between London and the rest of Great Britain was 0.159 in manufacturing, and this is again dominated by the ‘coefficients’ component, which accounts for 64% or 89% of the London advantage when equation (3) and (4) are used, respectively. In manufacturing, the interaction effect (which is due to differences in both endowments and coefficients between the two areas) is larger, accounting for 25% of the London productivity advantage when equation (3) is used. As with the results for all sectors, London benefits from having a larger ‘endowment’ of younger plants but, unlike for all sectors, its industry mix reduces its productivity advantage.
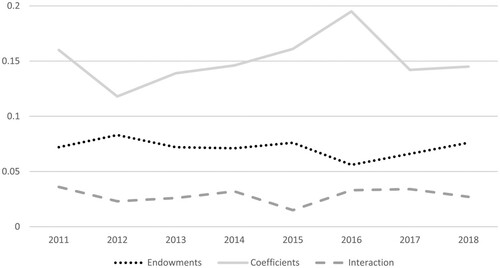
The result that differences in plant characteristics explain only a small part of London’s productivity advantage is also obtained when London is compared with different administrative regions. shows that the coefficients accounted for between 51.8% (versus the North East) and 62.8% (versus the East) of the London advantage. The largest endowment effect again comes from London’s relatively young plants and its industry mix. presents the results when London is compared with the rest of Great Britain for each year. This shows that the size of the different components is stable across time.
Figure 2. Weighted Blinder–Oaxaca decomposition of plant-level ln TFP, 2011–18: London versus each region (all sectors).
Source: Table A4 in the supplemental data online.
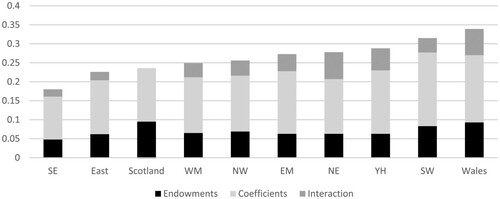
Figure 3. Weighted Blinder–Oaxaca decomposition of plant-level ln TFP, 2011–18: London versus the rest of Great Britain (all sectors) by year.
Source: Table A5 in the supplemental data online.
Columns 1 and 3 of compare London with the other main cities that feature in . When all sectors are considered (column 1), the productivity advantage of 0.197 is again dominated by the coefficients, which account for 58% of the differential. This suggests that while London’s advantage over other cities is slightly smaller (under 80%) than its advantage over the rest of Great Britain, it is nevertheless also driven by the effect of spatial factors such as its better infrastructure and higher levels of agglomeration rather than observed plant characteristics. London’s younger plants and industrial structure are the largest contributors to the endowment effect. When considering London versus other cities for manufacturing (column 3), a similar interpretation can be applied to that for all sectors although the coefficients account for a larger share (72%) of the London advantage.
Table 5. Weighted Blinder–Oaxaca decomposition of plant-level ln TFP, 2011–18: other groups.
(column 2) compares the productivity of the main cities (excluding London) with the rest of Great Britain. The productivity advantage of the main cities is more evenly divided between endowments and coefficients effects than the productivity advantage of London. The principal source of the endowments effect is the younger plants in cities. By contrast, there is no significant contribution from industrial structure. In manufacturing, the relatively small advantage of the other main cities over the rest of Great Britain (0.03) is dominated by a coefficients effect (column 4).
The results presented in omit any variables measuring agglomeration economies. The rationale for this approach is that agglomeration economies are likely to be an underlying source of London’s productivity advantage and, as such, will have both direct effects and indirect effects via plant characteristics on productivity. We therefore prefer not to treat measures of agglomeration in the same way as plant characteristics. Nevertheless, it is instructive to see whether adding proxies for agglomeration decreases the unexplained component as would be expected if agglomeration economies are indeed an important source of London’s productivity advantage. (column 1) shows that inclusion of a proxy for Marshallian localization (see for a definition) does indeed boost the contribution of endowments from 0.072 (, column 3) to 0.158 (, column 1). This is the result of the higher value of the proxy for localization economies in London ( shows that the mean of ln Localization is −0.329 in London and −1.377 in the rest of GB) and because it is positively associated with TFP in both regions. The size of the unexplained component falls from 0.149–0.076. (column 2) shows that the introduction of a measure of diversification, in addition to the measure of localization, has little effect on the results. Although the mean of the measure of diversification is higher in London than in the rest of Great Britain (−0.713 versus −0.677), its estimated coefficient is negative in both regions,Footnote13 but more so in London. According to equation (3), London’s greater diversification therefore reduces the endowments component and the difference in coefficients leads to a larger unexplained component. However, the effect is small.
Table 6. Weighted Blinder–Oaxaca decomposition of plant-level ln TFP, 2011–18: London versus the rest of Great Britain (sensitivity analysis).
Finally, exploiting the longitudinal nature of the dataset, presents results using fixed effects and random effects estimators.Footnote14 When equation (1) is estimated by fixed effects, the contribution of coefficients increases to 0.213 (compared with 0.149). The use of random effects to estimate equation (1) gives results that are very similar to those from obtained from OLS. The finding that plant characteristics play a relatively small role in explaining London’s productivity advantage is therefore robust to the use of different estimators.
CONCLUSIONS
There is an urgent need for estimates of TFP at a disaggregated spatial level to inform the development of the policies needed to ‘level up’ the UK economy. This paper has therefore provided information for the period 2011–18 on the level of TFP in different geographical areas and the extent to which differences between London and other regions can be accounted for by plant characteristics. The gap between London and the next most productive region accounted for 52–54% of the gap between London and the least productive region. Productivity differences between London and other regions therefore far exceed differences between other regions. London also has higher productivity than other major cities but, in manufacturing, the difference is smaller than when comparison is made across administrative regions. The magnitude of these differences is consistent with Eurostat and Organisation for Economic Co-operation and Development (OECD) data on labour productivity showing that interregional differences are larger and that laggard regions tend to perform worse in the UK than in most other advanced economies (Eurostat, Citation2020; OECD, Citation2020; ONS, Citation2018d). This is an important reason for the UK’s poor aggregate productivity performance and suggests that policy should explicitly acknowledge the regional dimension of the UK’s productivity problem.
The results from the decomposition show that most of London’s productivity advantage is not explained by observed plants characteristics (multinational ownership, trade involvement, enterprise structure, plant age, subsidization, size or industrial structure). This finding is robust to changes to the area with which London is compared and to changes in the model on which the decomposition is based. This suggests that policies to reduce interregional differences in plant characteristics (e.g., by increasing rates of exporting in laggard regions) will have only a small effect on the productivity gap. Moreover, since differences in observed plants characteristics will themselves be a function of underlying spatial drivers of productivity (such as governance, infrastructure, physical geography and agglomeration economies), the cost of counterbalancing these factors may be prohibitively large.
Instead, policy to reduce interregional disparities, and hence to improve the UK’s aggregate productivity, should target the underlying sources of lower productivity outside of London. One obvious way of doing this would be to improve infrastructure in the rest of Great Britain. Recently, the distribution of government investment in transport infrastructure has favoured London: average annual investment was 2.8 times higher in London than in the rest of the UK (Davenport & Zaranko, Citation2020) between 2014–15 and 2018–19. The government’s recently launched National Infrastructure Strategy commits to redressing this imbalance (UK Government, Citation2020).Footnote15 Since the UK is one of the most centralized developed countries in the world, there is considerable scope for greater devolution of spending and decision-making powers. Such a policy has been recommended by the Industrial Strategy Council’s recent report on governance structures in the UK (Regan et al., Citation2021) on the grounds that it will improve the quality of governance and hence productivity levels in laggard regions. However, it should be emphasized that there are many sources of London’s productivity advantage and the data used in this paper does not allow us to disentangle their influence and hence to offer specific recommendations on which policy option would be most effective. However, the use of geo-coded plant-level data and information on inter-plant linkages (both input–output and knowledge linkages) offers a promising route towards achieving this aim.
DATA STATEMENT
The data used are confidential and available from the UK Data Service Secure Data Lab.
Supplemental Material
Download PDF (775.7 KB)ACKNOWLEDGEMENTS
This work contains statistical data from Office for National Statistics (ONS) which is Crown copyright and reproduced with the permission of the controller of HMSO and the Queen’s Printer for Scotland. The use of the ONS statistical data in this work does not imply the endorsement of the ONS in relation to the interpretation or analysis of the statistical data. This work uses research datasets which may not exactly reproduce National Statistics aggregates.
DISCLOSURE STATEMENT
No potential conflict of interest was reported by the authors.
Additional information
Funding
Notes
1. LEPs are partnerships between businesses and local authorities that are tasked with developing local growth agendas.
2. The current status of local industrial strategies is unclear. The prospectus for the new Levelling Up Fund (HM Treasury, Citation2021b) states that bids should be ‘fully aligned and support any relevant local strategies (such as Local Plans, Local Industrial Strategies or Local Transport Plans)’, but they are not mentioned in the Build Back Better document (HM Treasury, Citation2021a).
3. For example, the evidence underpinning the Greater Manchester Combined Authority’s (GMCA) local industrial strategy reported the following: ‘The work also aimed to trial work on Total Factor Productivity (TFP), however due to data limitations, the advice from external reviewers and ONS was to focus on Labour Productivity. Revisiting TFP will be an important step beyond the Review, and will require additional work on data availability at lower spatial levels, including information on capital stock, and measuring intangible assets at the firm level’ (GMCA, Citation2019).
4. These are weighted to ensure that the ABS data are representative of the population of plants in operation in Great Britain.
5. Information on importing and exporting is not available in the ABS until 2011.
6. The 38 existing English LEPs are shown in Figure A1 in the supplemental data online. In 2017, the Northamptonshire LEP merged into the South East Midlands LEP, but in the analysis below we present separate information for these LEPs.
7. Equivalently, it shows the expected change in productivity that would arise if a plant outside London were to relocate to London (assuming that this move did not lead to a change in any observed characteristics).
8. Harris and Moffat (Citation2017a) base their decomposition upon a pooled version of equation (1), augmented by an area dummy, but this will give rise to omitted variables bias if the coefficients differ across areas, which will affect the size of the ‘endowments’ and ‘coefficients’ components in equations (3) and (4).
9. Because the capital stock does not take incorporate intangible capital, a binary variable indicating whether the plant has a positive R&D stock is included as a determinant of TFP. Differences in TFP between London and the rest of Great Britain arising from differences in intangibles will therefore be partly captured by the ‘endowments’ component. Other differences arising from mismeasurement of the factor inputs (due to variations in hours worked or human capital) will be captured by the ‘coefficients’ component.
10. The assumptions required for this interpretation are strong (Huber, Citation2015). Specifically, they require that the unobserved plant characteristics are uncorrelated both with the grouping variable (London) and with the observed plant characteristics.
11. As discussed in the data and methodology section, the value of the intercept is adjusted by the method of Yun (Citation2005), so is not simply the difference in the intercepts in columns 1 and 2 of .
12. Results for services are not shown because they are very similar to those for all the sectors covered. This is unsurprising as manufacturing accounts for fewer than 8% of all plants.
13. Negative effects of diversification on productivity and innovation have also been found in other studies that use UK data (Beaudry & Breschi, Citation2003; Harris & Moffat, Citation2012).
14. The mean of productivity (and hence, the difference across areas) is slightly different when compared with because time-invariant weights had to be used to estimate the panel models.
15. The foreword of the National Infrastructure Strategy states the following: ‘In recent years, we have spent heavily on the rail and road networks of London and the southeast, whose prosperity benefits us all. … But in the period covered by this strategy, we will significantly shift spending to the regions and nations of the UK’ (UK Government, Citation2020).
REFERENCES
- Aghion, P., & Howitt, P. (1992). A model of growth through creative destruction. Econometrica, 60(2), 323–351. https://doi.org/10.2307/2951599
- Ahlfeldt, G., & Feddersen, A. (2018). From periphery to core: Measuring agglomeration effects using high-speed rail. Journal of Economic Geography, 18(2), 355–390. https://doi.org/10.1093/jeg/lbx005
- Akerman, A., Gaarder, I., & Mogstad, M. (2015). The skill complementarity of broadband internet. The Quarterly Journal of Economics, 130(4), 1781–1824. https://doi.org/10.1093/qje/qjv028
- Altonji, J., & Blank, R. (1999). Race and gender in the labor market. In O. Ashenfelter, & D. Card (Eds.), Handbook of labor economics (pp. 3143–3259). North-Holland.
- Arrow, K. (1962). The economic implications of learning by doing. The Review of Economic Studies, 29(3), 155–173. https://doi.org/10.2307/2295952
- Beaudry, C., & Breschi, S. (2003). Are firms in clusters really more innovative. Economics of Innovation and New Technology, 12(4), 325–342. https://doi.org/10.1080/10438590290020197
- Berlingieri, G., Calligaris, S., & Criscuolo, C. (2018). The productivity–wage premium: Does size still matter in a service economy? AEA Papers and Proceedings, 108, 328–333).
- Blinder, A. (1973). Wage discrimination: Reduced form and structural estimates. The Journal of Human Resources, 8(4), 436–455. https://doi.org/10.2307/144855
- Bloom, N., Sadun, R., & Van Reenen, J. (2012). Americans do it better: US Multinationals and the productivity miracle. American Economic Review, 102(1), 167–201. https://doi.org/10.1257/aer.102.1.167
- Blöchliger, H., & Égert, B. (2013). Decentralisation and economic growth – Part 2: The impact on economic activity, productivity and investment. OECD Working Papers on Fiscal Federalism No. 15.
- Caselli, F. (2005). Accounting for cross-country income differences. In P. Aghion, & S. N. Durlauf (Eds.), Handbook of economic growth (pp. 679–741). North-Holland.
- Chanda, A., & Dalgaard, C.-J. (2008). Dual economies and international total factor productivity differences: Channelling the impact from institutions, trade, and geography. Economica, 75(300), 629–661. https://doi.org/10.1111/j.1468-0335.2007.00673.x
- Cohen, W., & Levinthal, D. (1989). Innovation and learning: The two faces of R&D. Economic Journal, 99(397), 569–596. https://doi.org/10.2307/2233763
- Cohen, W., & Levinthal, D. (1990). Absorptive capacity: A new perspective on learning and innovation. Administrative Science Quarterly, 35(1), 128–152. https://doi.org/10.2307/2393553
- Cook, J., Hardy, D., & Sprackling, I. (2020). Productivity policy review. In P. McCann, & T. Vorley (Eds.), Productivity perspectives (pp. 293–323). Edward Elgar.
- Criscuolo, C., & Martin, R. (2009). Multinationals and U.S. Productivity leadership: Evidence from great Britain. Review of Economics and Statistics, 91(2), 263–281. https://doi.org/10.1162/rest.91.2.263
- Davenport, A., & Zaranko, B. (2020). Levelling Up: Where and How? In P. Bourquin, A. Davenport, C. Emmerson, C. Farquharson, P. Johnson, D. Miles, B. Nabarro, C. Schulz, I. Stockton, T. Waters, & B. Zaranko (Eds.), IFS green budget 2020 (pp. 315–371). Institute for Fiscal Studies.
- de Groot, H., Poot, J., & Smit, M. (2016). Which agglomeration externalities matter most and why? Journal of Economic Surveys, 30(4), 756–782. https://doi.org/10.1111/joes.12112
- Department for Business, Energy and Industrial Strategy (BEIS). (2017). Industrial strategy: Building a Britain fit for the future. https://www.gov.uk/government/publications/industrial-strategy-building-a-britain-fit-for-the-future
- Department for Business, Energy and Industrial Strategy (BEIS). (2018). Local industrial strategies: Policy prospectus. https://www.gov.uk/government/publications/local-industrial-strategies-policy-prospectus
- DeStefano, T., Kneller, R., & Timmis, J. (2018). Broadband infrastructure, ICT use and firm performance: Evidence for UK firms. Journal of Economic Behavior & Organization, 155, 110–139. https://doi.org/10.1016/j.jebo.2018.08.020
- Disney, R., Haskel, J., & Heden, Y. (2003). Restructuring and productivity growth in UK manufacturing. Economic Journal, 113(489), 666–694. https://doi.org/10.1111/1468-0297.t01-1-00145
- Eurostat. (2020). European regional yearbook. Publications Office of the European Union.
- Fadic, M., Garda, P., & Pisu, M. (2019). The effect of public sector efficiency on firm-level productivity growth: The Italian case. OECD Economics Department Working Papers No. 1573.
- Görzig, B., Gornig, M., Voshage, R., & Werwatz, A. (2010). Eastern Germany on the brink of closing the productivity gap? Firm level evidence from manufacturing. Post-Communist Economies, 22(4), 499–511. https://doi.org/10.1080/14631377.2010.518459
- Greater Manchester Combined Authority (GMCA). (2019). Greater Manchester independent productivity review: Audit of productivity. https://www.greatermanchester-ca.gov.uk/media/1911/gmipr_tr_auditofproductivity.pdf
- Griffith, R., Harrison, R., & Van Reenen, J. (2006). How special Is the special relationship? Using the impact of U.S. R&D spillovers on U.K. Firms as a test of technology sourcing. American Economic Review, 96(5), 1859–1875. https://doi.org/10.1257/aer.96.5.1859
- Hall, B., Mairesse, J., & Mohnen, P. (2010). Measuring the returns to R&D. In B. Hall, & N. Rosenberg (Eds.), Handbook of the economics of innovation (pp. 1033–1082). North-Holland.
- Harris, R., & Moffat, J. (2012). Is productivity higher in British cities? Journal of Regional Science, 52(5), 762–786. https://doi.org/10.1111/j.1467-9787.2012.00778.x
- Harris, R., & Moffat, J. (2015a). The impact of exporting and importing goods and services on productivity in the UK. The World Economy, 38(11), 1781–1794. https://doi.org/10.1111/twec.12292
- Harris, R., & Moffat, J. (2015b). Total factor productivity growth in local enterprise partnership regions in Britain, 1997–2008. Regional Studies, 49(6), 1019–1041. https://doi.org/10.1080/00343404.2013.799770
- Harris, R., & Moffat, J. (2017a). The sources of the Scotland–rest of the UK productivity gap: Implications for policy. Regional Studies, 51(9), 1297–1311. https://doi.org/10.1080/00343404.2016.1160044
- Harris, R., & Moffat, J. (2017b). The UK productivity puzzle, 2008–2012: Evidence using plant level estimates of total factor productivity. Oxford Economic Papers, 69(3), 529–549. https://doi.org/10.1093/oep/gpw057
- Harris, R., & Moffat, J. (2020). The impact of product subsidies on plant-level total factor productivity in Britain, 1997–2014. Scottish Journal of Political Economy, 67(4), 387–403. https://doi.org/10.1111/sjpe.12240
- Harris, R., & Robinson, C. (2002). The effect of foreign acquisitions on total factor productivity: Plant-level evidence from U.K. Manufacturing, 1987–1992. The Review of Economics and Statistics, 84(3), 562–568. https://doi.org/10.1162/003465302320259556
- HM Treasury. (2020). Spending review 2020. https://www.gov.uk/government/publications/spending-review-2020-documents/spending-review-2020
- HM Treasury. (2021a). Build back better: Our plan for growth. https://www.gov.uk/government/publications/build-back-better-our-plan-for-growth
- HM Treasury. (2021b). Levelling up fund: Prospectus. https://www.gov.uk/government/publications/levelling-up-fund-prospectus
- Huber, M. (2015). Causal pitfalls in the decomposition of wage gaps. Journal of Business & Economic Statistics, 33(2), 179–191. https://doi.org/10.1080/07350015.2014.937437
- Jacobs, J. (1970). The Economy of cities. Jonathan Cape.
- Krüger, J. (2008). Productivity and structural change: A review of the literature. Journal of Economic Surveys, 22(2), 330–363. https://doi.org/10.1111/j.1467-6419.2007.00539.x
- Leibenstein, H. (1966). Allocative efficiency vs. ‘X-efficiency’. The American Economic Review, 56, 392–415.
- Marshall, A. (1890). Principles of economics. Macmillan.
- Martin, R., Bailey, D., Evenhuis, E., Gardiner, B., Pike, A., Sunley, P., & Tyler, P. (2019). The economic performance of Britain’s cities: Patterns, processes and policy implications. https://www.cityevolutions.org.uk/wp-content/uploads/The-Evolving-Economic-Performance-of-Britain%E2%80%99s-Cities-Patterns-Processes-and-Policy-Implications.pdf
- Martin, R., Pike, A., Tyler, P., & Gardiner, B. (2016). Spatially rebalancing the UK economy: Towards a new policy model? Regional Studies, 50(2), 342–357. https://doi.org/10.1080/00343404.2015.1118450
- Martin, R., Sunley, P., Gardiner, B., Evenhuis, E., & Tyler, P. (2018). The city dimension of the productivity growth puzzle: The relative role of structural change and within-sector slowdown. Journal of Economic Geography, 18(3), 539–570. https://doi.org/10.1093/jeg/lby008
- McCann, P. (2016). The UK regional–national Economic problem: Geography, globalisation and governance. Routledge.
- Melo, P., Graham, D., & Noland, R. (2009). A meta-analysis of estimates of urban agglomeration economies. Regional Science and Urban Economics, 39(3), 332–342. https://doi.org/10.1016/j.regsciurbeco.2008.12.002
- Oaxaca, R. (1973). Male–female wage differentials in urban labor markets. International Economic Review, 14(3), 693–709. https://doi.org/10.2307/2525981
- Office for National Statistics (ONS). (2017). Foreign direct investment and labour productivity, a microdata perspective: 2012 to 2015. https://www.ons.gov.uk/economy/economicoutputandproductivity/productivitymeasures/articles/firmlevellabourproductivitymeasuresfromtheannualbusinesssurveygreatbritain/2017
- Office for National Statistics (ONS). (2018a). Annual business survey, 2008–2016: Secure access. http://doi.org/10.5255/UKDA-SN-7451-9
- Office for National Statistics (ONS). (2018b). Annual inquiry into foreign direct investment, 1996–2016: Secure access. http://doi.org/10.5255/UKDA-SN-6664-6
- Office for National Statistics (ONS). (2018c). Business expenditure on research and development, 1994–2016: Secure access. http://doi.org/10.5255/UKDA-SN-6690-6
- Office for National Statistics (ONS). (2018d). Regional and subregional productivity comparisons, UK and selected EU countries: 2014. https://www.ons.gov.uk/economy/nationalaccounts/uksectoraccounts/compendium/economicreview/april2018/regionalandsubregionalproductivitycomparisonsukandselect edeucountries2014.
- Organisation for Economic Co-operation and Development (OECD). (2020). OECD regions and cities at a glance 2020. OECD Publ.
- Porter, M. (1990). The competitive advantage of nations. Macmillan.
- Regan, A., Quinn, M., Romaniuk, A., Sampson, S., Stratton, T., Brittain, B., & Taylor, A. (2021). Devolution and Governance Structures in the UK. https://industrialstrategycouncil.org/devolution-and-governance-structures-uk-lessons-evidence
- Rogers, M. (2010). R&D and productivity: Using UK firm-level data to inform policy. Empirica, 37(3), 329–359. https://doi.org/10.1007/s10663-009-9111-x
- Thompson, P. (2012). The relationship between unit cost and cumulative quantity and the evidence for organizational learning-by-doing. Journal of Economic Perspectives, 26(3), 203–224. https://doi.org/10.1257/jep.26.3.203
- Tsvetkova, A., Ahrend, R., Oliveira Martins, J., Lembcke, A., Knutsson, P., Jong, D., & Terzidis, N. (2020). The spatial dimension of productivity: Connecting the dots across industries, firms and spaces. OECD Regional Development Working Papers No. 2020/01.
- UK Government. (2020). National infrastructure strategy. https://www.gov.uk/government/publications/national-infrastructure-strategy
- UK2070 Commission. (2019). Fairer and stronger: Rebalancing the UK economy. http://uk2070.org.uk/2019/05/30/first-report-of-the-uk2070-commission-to-be-published-on-thursday-30th-may-2019/
- Wagner, J. (2007). Exports and productivity: A survey of the evidence from firm-level data. World Economy, 30(1), 60–82. https://doi.org/10.1111/j.1467-9701.2007.00872.x
- Webber, D., Hudson, J., Boddy, M., & Plumridge, A. (2009). Regional productivity differentials in England: Explaining the gap. Papers in Regional Science, 88(3), 609–621. https://doi.org/10.1111/j.1435-5957.2008.00209.x
- Williamson, O. (1967). The economics of defense contracting: Incentives and performance. In R. McKean (Ed.), Issues in defense economics (pp. 217–278). Columbia University Press.
- Yun, M.-S. (2005). A simple solution to the identification problem in detailed wage decompositions. Economic Inquiry, 43(4), 766–772. https://doi.org/10.1093/ei/cbi053
- Zymek, R., & Jones, B. (2020). UK regional productivity differences: An evidence review. https://industrialstrategycouncil.org/uk-regional-productivity-differences-evidence-review