
 ?Mathematical formulae have been encoded as MathML and are displayed in this HTML version using MathJax in order to improve their display. Uncheck the box to turn MathJax off. This feature requires Javascript. Click on a formula to zoom.
ABSTRACT
After a long period of deindustrialization, Europe faces ‘the need to reverse the declining role of industry’, as the European Union officially claims, to relaunch productivity. Despite this strong political claim, scientifically sound analyses on whether a reindustrialization process takes place, and if it is accompanied by a relaunch of productivity, are still missing. Drawing on the path-dependence theoretical framework, different reindustrialization patterns are conceptually identified and operationally associated with European NUTS-2 regions thanks to an original database of value added at (sub-manufacturing) sectoral regional level in different time spans. Results suggest that the patterns are associated with different degrees of industry productivity growth. Ad-hoc policies accompanying different reindustrialization modes are suggested. They can help to achieve a critical mass of reindustrialization that could potentially stimulate a still missing effect on aggregate productivity increase.
INTRODUCTION
In the last two decades, Europe has substantially changed the industrial structure of its gross value added (GVA), with the deindustrialization phenomenon clearly emerging. The process of deindustrialization was interpreted as a natural trend of modern advanced economies (Nickell et al., Citation2008; Rodrik, Citation2016; Rowthorn & Ramaswamy, Citation1997; Škuflić & Družić, Citation2016), and justified under different respects. Initially, according to the stages of development theory (Fisher, Citation1933; Hoover, Citation1948), that is, depicting regional development as a natural sequence of phases (from agriculture to manufacturing to services). Later, through studies on the way restructuring and relaunching of local competitiveness can be accompanied by a decreasing importance of the manufacturing sector (Camagni, Citation1991a; Rodwin, Citation1991).
Overall, the trend was interpreted as a mere and almost physiological consequence of different phenomena, namely: technological innovation, international trade, delocalization of production in countries often characterized by lower labour costs or changes in consumers’ expenditures when income increases (rising living standards leading to a shift in demand). The deindustrialization process was accompanied by a decline in productivity growth (productivity paradox/productivity gap) (e.g., Acemoglu et al., Citation2014; Brynjolfsson, Citation1993; Solow, Citation1987). Other drawbacks involved private research and innovation and included a loss of local know-how (Pisano & Shih, Citation2009, Citation2012) and specialized labour force (Gibson, Citation2014), and a tertiarization trend in favour of low value-added (VA) services.
Therefore, the initially positive interpretation of the deindustrialization process began to be criticized, especially after the economic crisis that started in 2008. In fact, the low GVA growth, the productivity gap of Europe and the drawbacks mentioned above pushed policymakers towards the idea that Europe needs to reverse the declining role of industry within its boundaries, avoiding competing on low-price and low-quality products, but strengthening instead an industrial competitiveness based on a high technological level to enable the transition to a low-carbon and resource-efficient economy (Alessandrini et al., Citation2017; European Commission, Citation2010, Citation2012, Citation2014).
Moreover, the idea that the industrial sector is by its nature accompanied by higher productivity growth as opposed to the service sector was used to interpret deindustrialization as one of the causes for the productivity gap analysed by many scholars and institutions (e.g., Acemoglu et al., Citation2014; Brynjolfsson, Citation1993; Cette et al., Citation2016; European Central Bank (ECB), Citation2017; Ortega-Argilés, Citation2012; Solow, Citation1987; Van Ark et al., Citation2013).
Since higher labour productivity growth is a key factor in raising living standards in advanced economies, within the political realm some clear messages came forward. ‘Europe needs to reverse the declining role of industry’, or ‘New investment … to bring innovation and new technologies back onto factory floors’ (European Commission, Citation2012; emphases added), or:
Europe urgently needs to strengthen the basis for post-crisis sustainable growth and modernization. To that end, it must send a clear signal of its commitment to reindustrialization, the modernization of Europe’s industrial base and the promotion of a competitive framework for EU industry.
(European Commission, Citation2014; emphasis added)
The reaction of the academic and scientific arena to these political messages has been very limited with exceptionally few academic works specifically investigating the issue (Christopherson et al., Citation2014), and our work seems to be one of the first attempts trying to highlight whether a reindustrialization process is underway in Europe and, if so, where it is taking place and how, according to a regional approach to this issue.
Our main idea is that a relaunch of productivity is not simply a matter of reindustrialization, but of the type of reindustrialization that takes place. Reindustrialization can in fact assume different forms. It can be the result of a backshoring of activities that already existed in the area, brought back in their original location, or of the creation of new industrial activities, which find new attractive locations in the European regions. These different forms of reindustrialization are all plausible and are differently related to the local productivity dynamics: they can be associated just to the productivity growth of the specific reindustrializing manufacturing sectors at the regional level, but also – through a propagation mechanism – to the productivity trend of the whole industry and, even more broadly, of the entire aggregate regional productivity dynamic. Of course, we may think that whether they are able to provide propagation to the whole economy strongly depends not only on their intensity but on whether the reindustrializing activities reach a sufficient critical mass to expand to the whole economy.
This paper is one of the first attempts to tackle the issue of the reindustrialization process in Europe, measuring it, and linking it to a relaunch of productivity in Europe. It does so by (1) finding out if a reindustrialization process did in fact take place in Europe and where at the regional (NUTS-2) level; (2) if so, identifying the particular reindustrialization patterns followed and where, and (3) highlighting the association of reindustrialization, and the different patterns that characterize such a process, with the growth of productivity at the regional level.
The article is based on an original database on regional and manufacturing sub-sectoral VA that has been built through a tough and meticulous effort in data collection (and purchase) from national statistical offices, which was accompanied by a systematization and some estimation work when needed.
The remainder of the paper is structured as follows. We start by discussing reindustrialization and its possible different modes (next section) and move forward by introducing our own definition of reindustrialization, operationalizing our interpretation of the different possible reindustrialization patterns, and introducing the database. Subsequently, regional reindustrialization is analytically identified and presented, together with its different typologies, and the relationship with regional productivity dynamic is empirically explored. Finally, we conclude and put forward some ideas on possible future steps for the research work.
PATH-DEPENDENCE AND REINDUSTRIALIZATION PATTERNS
Initially brought out in the technological development field by David (Citation1985, Citation1986) and Arthur (Citation1988, Citation1989), the path-dependence concept has been applied to interpret complex dynamic processes of regional economic renewal, transformation and decline (Henning et al., Citation2013). Therefore, it offers a sound conceptual framework also for the study of a structural transformation process such as reindustrialization.
In this framework, local history and self-reinforcing development processes are interpreted through the idea that the sectoral and structural paths followed by cities and regions do determine their long-term development trajectories (Hassink & Shin, Citation2005; Simmie et al., Citation2008; Stam & Garnsey, Citation2009). Considering this interpretation, reindustrialization occurs through the reinforcement of the pre-existing specialized industrial structure through an upgrading strategy, when firms adjust to the new conditions based on their established practices (). The risk of a lock-in – when it becomes difficult and expensive to deviate from a specific trajectory and an industry fails to adapt in response to an external shock – is overcome by the relaunch and modernization of still existing know-how. The renewal of local knowledge regenerates previously existing development paths, stimulating external increasing returns and agglomeration economies (Martin, Citation2010; Martin & Sunley, Citation2006; Simmie, Citation2012), suitable entrepreneurial climate resulting from pre-existing conditions (Carlsson, Citation2007), and reduced transaction costs (Maskell & Malmberg, Citation2007).
Table 1. Regional reindustrialization patterns.
Upgrading is just one of the strategies that can be pursued. In fact, other reindustrialization strategies can exist, when one detaches from the seminal contributions and embraces a new view on the potentially favourable importance of history in the regional economic evolution (see also Capello & Lenzi, Citation2018; Grillitsch et al., Citation2018). New path creation is possible and actually occurs (Boschma & Frenken, Citation2011) and can be achieved through exogenous shocks (and in fact the economic crisis could be easily considered as such) and Schumpeterian creative destruction, but also through layering (a gradual process of changing the industrial structure), conversion (learning and reorientation, through the entry of new firms that employ newer techniques), or recombination of resources and competences that can originate new paths.
When this is the case, a diversification strategy is put in place (). In this perspective, reindustrialization can make the local inherited knowledge and skill base of an industry evolve in favour of a diversification of the pre-existing specialized industrial structure, forming the basis for local renovation through related technological/product/skill development (Boschma, Citation2017; Frenken et al., Citation2007; Frenken & Boschma, Citation2007). Path-dependent processes are in this case consistent with cumulative and incremental change and the reindustrialization pattern is here interpreted as a trajectory along which new diversified paths based on related knowledge are developed (see also Henning et al., Citation2013). The specific know-how in a region, in fact, can be modified over time, but the fundamental capabilities are usually preserved (Maskell & Malmberg, Citation1999), in line with the idea that a revitalization of the long-time specialization may imply only a modest change in the knowledge infrastructure, since it could just involve the adaptation of existing structures (Trippl & Otto, Citation2009).
Path dependence may also dissolve (see Sydow et al.’s, Citation2005, idea of path dissolution) because of a deindustrialization trend or – more simply, and possibly more likely – there could be some path de-locking elements leading to a renewal, which would involve a significant change of the existing trajectory of development, possibly moving towards new and more dynamic sectors through major innovation (Chapman et al., Citation2004; Hassink, Citation2007). These aspects can be paired with regional reindustrialization patterns in which the reindustrializing manufacturing sectors are not those characterizing the initial specialization of the area. This could perhaps be more expected in regions without a very long manufacturing history and therefore identified by a younger/less deep path-dependence before the economic crisis. According to Simmie et al. (Citation2008, p. 4), for instance, ‘New ideas and new development pathways appear more often in areas without long industrial histories.’ These patterns, in fact, can be defined by the emergence of reindustrialization in new manufacturing sectors with respect to the pre-existing industrial specialization and, in this sense, may be related to path creation, either in terms of a reorientation or of a creation strategy (). Such patterns could even stem from creative recombination along unrelated sectors leading to the emergence of new industrial structures.
The distinction between a reorientation and a creation strategy refers to the propensity to focus or to widen the new know-how. A reorientation towards new manufacturing sectors that achieve a critical mass of knowledge can be labelled as a ‘Shrinkage of the pre-existing industrial fabric towards a new specialization,’ signalling an industrial conversion that can take place through the entry of new firms that employ newer techniques leading to a change in the organization, arrangements, aim and scope of the existing functions. Instead, a creation of new non-core manufacturing sectors further widens sub-manufacturing sectoral diversification without achieving a specialization, signalling the existence of a variety of knowledge niches that exploit variety for novelty, giving rise to an enlargement of the pre-existing diversified industrial fabric.
One can assume that each reindustrializing mode differs in terms of local productivity dynamics: those patterns able to reinforce local knowledge and to give rise to self-reinforcing collective learning processes are logically expected to be related with higher productivity gains. This belief is well rooted in the long-standing regional economic theory, from the traditional export-base models (Hoyt, Citation1954; Weimer & Hoyt, Citation1939) and industrial district perspective (Becattini, Citation1989; Marshall, Citation1920; Dei Ottati, Citation2003) to the more recent dynamic approaches associated with collective learning and localized knowledge (Aydalot, Citation1986; Aydalot & Keeble, Citation1988; Camagni, Citation1991b). In these theories, productive specialization (Kemeny & Storper, Citation2015) and local cumulated knowledge lead to static and dynamic positive externalities for local firms. This is true especially in the short run, when the advantages stemming from diversification (Hidalgo et al., Citation2007; Nefke et al., Citation2011) and higher knowledge complexity (Balland & Rigby, Citation2017; Hidalgo & Hausmann, Citation2009) may be not yet apparent due to the initial risk/cost implied by these strategies.
Accordingly, within the four regional reindustrialization patterns mentioned in , the reinforcement of the pre-existing specialized industrial fabric regional reindustrialization pattern is expected to be especially associated with productivity dynamics. Related to this, the empirical part of this work aims at highlighting if and where the different regional reindustrialization patterns take place in Europe and at associating a productivity dynamic to each of them.
METHODOLOGICAL ISSUES
Definition of reindustrialization
To approach reindustrialization, in its different forms and with its diverse implications on the dynamic of local productivity, the first step is of course to define the concept in a way that can be operationalized and therefore quantitatively analysed.
As any definitional and/or measurement process, it should reflect the focus of interest, both in terms of the spatial unit over which it is considered and of the indicator to be used (Cheshire, Citation1991). Our interest is particularly in the subnational (NUTS-2) level of the phenomenon, and we especially aim at capturing the process of recreating manufacturing sectors through previously existing or new manufacturing sectors.
As already mentioned, despite a wide political interest in the issue, the academic literature has not deepened the topic, so that (as per our knowledge) there is not much reference in this respect. What the existing research analysed quite thoroughly is instead deindustrialization. Therefore, one could think to use the same indicators, just interpreting them according to a reindustrialization perspective. This is, however, not that straightforward because of many limits concerning the measurement.
Most works on deindustrialization measured it through the trend (decrease) in manufacturing employment, in absolute or relative terms. Such choice was nevertheless disputable because it could be explained by many other trends that have nothing to do with a real reduction of the industrial VA: physiological processes, innovation and technological progress or wide restructuring, all affect employment dynamics but do not capture a reduction in the industrial VA. Similarly, in the case of reindustrialization, a positive trend in the employment in manufacturing could simply be the result of public assistance and sheltered development in specific manufacturing sectors and this situation could easily coexist with a decrease in VA.
This limit is of course solved by using the change in manufacturing VA, again either in absolute or relative terms. To avoid influences due to changes in prices, the increase in manufacturing VA could be analysed in constant terms. However, this measure tends to catch changes in quantity of output rather than changes in quality, which are mostly left aside (Aghion et al., Citation2019; Camagni et al., Citation2021). It would be again highly debatable to exclude from the measurement of a ‘reindustrialization’ process regions that are able to sell their products at increasing prices, acquiring market shares.
Taking all these considerations into account, the increase in the share of manufacturing VA at current prices is the way out of these impasses (Rowthorn & Ramaswamy, Citation1997; Sachs et al., Citation1994). The share, rather than the absolute value, guarantees that the price effects are controlled for, while the VA at current prices contains the quality effect. In addition, this is consistent with the perspective taken by the European Commission, which also set a reindustrialization goal in terms of share of industrial VA over total (Alessandrini et al., Citation2017).
In the present study, therefore, reindustrialization occurs when the change in the share of current manufacturing VA grows over time. In practical terms, here reindustrialization is identified when the change in the share of current manufacturing VA in a post-crisis period (2013–17) is higher – or relatively less negative – than the change in the share of current manufacturing VA in a pre-crisis period (2000–07).Footnote1
However, as the literature claims, the changes in the share of manufacturing VA are influenced by the changes in the price of services, since the last ones influence the change in the share of service VA at current prices.
To control for this possible interference, shows the trend in the relative prices of manufacturing in the two periods of our analysis. For the second period, the ratio is relatively stable and therefore they do not influence our share of manufacturing VA. In the first period, instead, the ratio decreases, witnessing that service prices increased more than manufacturing ones and influence the trend in the share of manufacturing VA. In relative terms, the quality in manufacturing increases less than the one in services, which is in fact a signal of loss of competitiveness, consistent with a deindustrialization process, which was actually taking place in the period. The trends in service prices only emphasize such a tendency.
Table 2. Trend in relative prices in the EU-28, 2000–17.
Operational identification of the different reindustrialization patterns
The aim of this section is to empirically distinguish the different regional reindustrialization patterns conceptually devised before. To do this, we go through two different steps. In the first step, within reindustrializing regions, reindustrializing manufacturing subsectors need to be identified. Within a reindustrializing region, a specific manufacturing sector is considered as reindustrializing if the change in its share of current VA over total manufacturing VA in the post-crisis period (2013–17) is higher than the change in its share of current VA in the pre-crisis period (2000–07), in line with the definition of reindustrialization presented above. Once identified, their VA is aggregated at the regional level and represents the VA of the regionally reindustrializing manufacturing sectors.
The second step aims at associating every region to a specific reindustrialization pattern. To this end, two indicators are built. The first represents the level of initial specialization of the regionally reindustrializing manufacturing sectors identified in the first step. This is computed in terms of location quotient (LQ) of regionally reindustrializing manufacturing sectors. The second indicator represents the dynamics in the specialization of such manufacturing sectors over time, and it is calculated as the absolute difference between the LQs in 2017 and 2000, respectively. When analysed together, the two indicators give rise to four possible situations ():
A specialization in reindustrializing manufacturing sectors in the initial period, and an increase of this specialization over time captures a local economic system of reinforcement of the pre-existing specialized industrial fabric.
A specialization in reindustrializing manufacturing sectors in the initial period, and an increasing diversification over time captures a diversification of the pre-existing specialized industrial fabric.
A diversification in reindustrializing manufacturing sectors in the initial period, and an increasing specialization over time measures a shrinkage of the pre-existing industrial fabric towards a new specialization.
A diversification in reindustrializing manufacturing sectors in the initial period, and an increasing diversification over time is a signal of an enlargement of the pre-existing diversified industrial fabric.
Table 3. Forms of reindustrialization: operational classification of the different regional patterns.
visually displays the operational procedure showing the initial level of specialization in regionally reindustrializing manufacturing sectors on the columns and the variation of specialization in regionally reindustrializing manufacturing sectors on the rows.
To operationalize the reasoning and empirically apply our logic to the European regions, a database is needed. The effort in this case is not associated with the creation of complex indicators. Instead, it is related to the collection of raw data on VA and employment at sub-manufacturing sectoral regional level in time series. Especially the disaggregation of the sectoral level in specific manufacturing sectors (at two-digit NACE code) is rather complicated.Footnote2
The manufacturing VA at current prices at regional (NUTS-2) level is available from Eurostat. Problems arise when a higher sectoral disaggregation of regional manufacturing VA data is needed, since such information is not publicly accessible from Eurostat. To overcome such limitations, an interaction with the individual European national statistical offices was developed to gather the data. For some countries such information was not available. In those cases, the necessary pieces of information were estimated. Thanks to the existence of a primary source on disaggregated manufacturing VA for some specific years, the specialization of regions in reindustrializing manufacturing sectors could be identified, and the kind of industrialization pattern of each region devised (see Appendix A in the supplemental data online).
The results of the application of the data to our conceptual framework are displayed in the next section.
REINDUSTRIALIZATION PATTERNS IN EUROPEAN REGIONS
Based on the operational definition provided above, Europe as a whole experienced a reindustrialization process, the only exceptions at the country level being Romania and Malta. provides a picture of the reindustrialization patterns, as defined above. As shown, not all regions reindustrialized. In this case, some regions industrialized (hatching in ), while others deindustrialized (black areas in ). In the first case fall those regions that kept on increasing their share of VA in manufacturing in the post-crisis period, although more slowly with respect to the pre-crisis period. As for this category, the case of Germany is quite emblematic: a traditionally manufacturing country, which in fact was not really experiencing a strong deindustrialization process during the pre-crisis period (as was instead the case for most European countries and regions) and which in some cases simply continued on its industrialization path, even if at a more moderate pace. In the second case (deindustrializing regions) are instead classified those regions experiencing a real deindustrialization process, i.e., a negative trend in the share of manufacturing VA, which is even more accentuated in the post-crisis period.
Figure 1. Regional reindustrialization patterns in Europe.
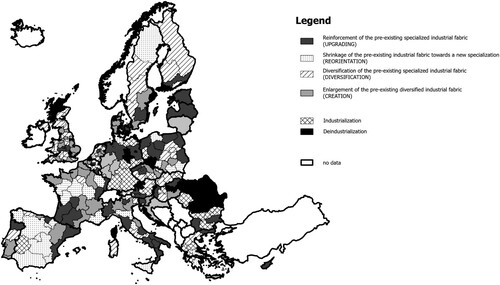
The different reindustrialization patterns in the European regions are however more interesting. As can be observed from , the situation is quite heterogeneous, with dark grey representing the regions that reindustrialized through the reinforcement of the pre-existing specialized industrial fabric (51 regions), dots filling the areas that reindustrialized through the shrinkage of the pre-existing industrial fabric towards a new specialization (39 regions), stripes representing the regions that showed a diversification of the pre-existing specialized industrial fabric (49 regions), and the light grey areas being instead those characterized by an enlargement of the pre-existing diversified industrial fabric (52 regions).
The category including those regions that reindustrialized through the shrinkage of the pre-existing industrial fabric towards a new specialization is in fact the least numerous. This is not surprising, since – as highlighted above – this is a difficult pattern to be put into practice. It implies in fact a more significant change with respect to the regeneration of mature clusters and it involves a shift in the regional development trajectory, relying less on incumbent firms and more on completely new enterprises (see also Alessandrini et al., Citation2017).
From a careful observation of the sub-manufacturing sectoral specialization in the different reindustrialization patterns of each country (see Table A1 in the supplemental data online), it emerges that no systematic association exists between sub-manufacturing sectoral specialization and regional reindustrialization pattern. This means that our regional reindustrialization patterns are not forged by a specific sub-manufacturing sectoral specialization. If this is the case, the explanation of how a manufacturing sector can indeed reindustrialize has to be looked for in the context conditions of the area. Localized externalities, traditions, skills and know-hows and proximity relationships of cultural elements and values, as well as of rules and practices (Camagni Citation2008) appear to be important sources of efficiency of production processes and innovative capacity. Within the local conditions, a particular importance is nowadays attributed to intangible assets, such as the embeddedness of local actors in place-specific production and innovation networks, competence and knowledge bases, and institutional environments (also including culture and shared trust) – which depend on the actions and interactions of actors (Boschma, Citation2004). Moreover, systems with very similar initial states can follow radically divergent paths over time (Baum & Silverman, Citation2001) and this is in line with recent contributions that show how – even starting from similar initial structural conditions – regions may end up in different development paths, due for instance to local innovative entrepreneurship, local institutional entrepreneurship, and place-based leadership (see Grillitsch & Sotarauta’s, Citation2020, ‘trinity of agency’). This question goes beyond regional industrial structure.
Finally, concerning the relationship between the different types of reindustrialization patterns and productivity gains, this calls for a specific analysis, reported in the next section.
REINDUSTRIALIZATION AND PRODUCTIVITY DYNAMICS
This section explores whether and how the different regional reindustrialization patterns are accompanied by the dynamic of productivity in the European regions. The objective of the analysis is not to explain productivity growth, but to carefully explore the relationship between the different reindustrialization patterns and the dynamic of productivity.
Although a causal association is not what we look for here, an econometric approach is chosen to better control for additional local elements that are likely to affect regional productivity growth. This is more convincing with respect to what could be interpreted from (even elaborated) descriptive statistics and analysis of variance (ANOVA) techniques.
Reindustrialization patterns can be related either to the aggregate local productivity dynamics or to industrial productivity growth since their association with productivity growth could propagate to the local industrial sector or to the local economy as a whole. Given the different types of regions categorized within the reindustrialization patterns that emerge from the descriptive analysis presented above, in fact, the outcome cannot be taken for granted.
The possible propagation effect associated to the different reindustrialization patterns that can be visible on the whole economy (regional aggregate productivity growth) was investigated by estimating the following general models:
(1)
(1)
(2)
(2)
(3)
(3) where the reference units are European NUTS-2 regions;Footnote3 prod growth2013–2018 is labour productivity growthFootnote4 between 2013 and 2018; ind is a dummy variable equal to 1 if the region is ‘industrializing’ (see the previous section); and reind is a dummy variable equal to 1 if the region is ‘re-industrializing’. X is a vector of control variables including local characteristics that are traditionally recognized as associated with the dynamic of productivity, that is, population density (pop density) to take agglomeration economies into account; the share of upper secondary and post-secondary non-tertiary educated over total employment (hc secondary) and the share of tertiary educated over total employment (hc tertiary), for the quality of the labour force. Although human capital is a renown and widely recognized determinant of regional growth (Lucas, Citation1988; Mathur, Citation1999; Romer, Citation1986), in fact, we here decided to consider these two different categories since it could well be the case that more ‘technical and practical’ skills, proxied by upper secondary and post-secondary level of education, could be more useful in enhancing industrial productivity growth, rather than ‘classical’ human capital in terms of tertiary education.
Moreover, the share of research and development (R&D) expenditure over gross domestic product (GDP) (R&D) is included as an input measure for innovation and GDP per capita (gdp pc) is entered in its logarithmic form (due to its high skewness) to control for the initial level of wealth in the region. Finally, two dummy variables (east and south) control for groups of countries traditionally characterized by similar economic structures. All the explanatory variables are measured at the beginning of the explained period (2013) and retrieved from Eurostat.
Specification (1) above is then slightly modified into specification (2) to better highlight the role of reindustrializing regions with respect to all non-reindustrializing regions. Subsequently, the sample is restricted to reindustrializing regions in specification (3), where a series of dummy variables is introduced to identify the different types of reindustrializing patterns to investigate the potentially different relationship of the regional reindustrialization patterns with productivity growth. Here reinforce is a dummy variable equal to one if the region is associated with the reinforcement reindustrialization pattern, diversification a dummy variable for the diversification reindustrialization pattern, and enlargement that for the enlargement pattern.
The results of the investigation on the potential propagation effects on the whole regional productivity growth are displayed in . The dependent variable is aggregate regional labour productivity growth. The outcome tells clearly that reindustrializing regions increase their productivity growth as much as all other regions (columns 1 and 2) and that there is no significant difference among the regional patterns of reindustrialization (column 3). Therefore, propagation effects in terms of productivity growth from regionally reindustrializing manufacturing sectors, if any, seem to be not strong enough to be visible on the whole regional economy. They seem to depend on the share of local sectors involved in reindustrialization processes, which may require a critical mass to generate propagation to the whole economy. Moreover, virtuous mechanisms including inter-industrial linkages require time to be transmitted to the whole economy, something that this type of analysis does not grasp.
Table 4. Regional reindustrialization patterns and aggregate productivity growth.
Such results led us to make a further step forward, deepening the analysis to consider if propagation from the reindustrializing manufacturing sectors is at least detectable on the dynamic of the industry as a whole. Thus, the specifications presented above are slightly changed to use labour productivity growth in industry (sectors B–E in the NACE rev. 2 classification) as a dependent variable. The results are reported in .
Table 5. Regional reindustrialization patterns and industry productivity growth.
It clearly emerges how reindustrializing regions perform significantly better than deindustrializing regions in terms of productivity growth in industry (column 1), and this is true even when the reference group becomes all non-reindustrializing regions (column 2). Within reindustrializing regions (column 3), those reinforcing the pre-existing specialized industrial fabric are the ones accompanied by higher industrial productivity gains with respect to the others. Thus, the propagation effects of reindustrializing manufacturing sectors – although not appreciable at the aggregate level – are distinguishable on the industry. We believe these results are related to the positive role of increased specialization in the reindustrializing manufacturing sectors, possibly associated with an improvement of the critical mass that could contribute to explain the outcome, mainly through collective learning processes involving the spontaneous exchange of knowledge at the local level.
Very interestingly, the share of tertiary educated employees (hc tertiary) is not significantly correlated with the dynamic of industrial productivity, while the share of secondary and post-secondary educated employees (hc secondary) shows a positive and significant relationship with the dependent variable. This could be due to the performance in industry being in fact more related to different and more technical/vocational specific skills, not necessarily linked to formal tertiary education.
An important consideration is to be made here. As highlighted in the previous section, in fact, the reinforcement regional reindustrialization pattern is not necessarily associated to more advanced regions. This further corroborates our finding that a reindustrialization strategy based on the rejuvenation of manufacturing sectors in which the region was traditionally specialized is significantly linked to a higher productivity growth in industry.
The analysis shows how regional reindustrialization patterns are differently associated to industrial productivity growth. Regionally reindustrializing manufacturing sectors are accompanied by industrial productivity growth, and this is especially true for regions characterized by a reinforcement of the pre-existing specialized industrial fabric. Although propagation effects are detectable on regional industrial productivity growth, they are instead not detectable at the regional aggregate level. Substantially, the effects on industrial productivity growth do not seem to be sufficient to spread to the whole economy. This can in fact be due to a limited share of local manufacturing sectors involved and to the need of time for virtuous mechanisms to be transmitted to the whole economy, possibly through some inter-industry virtuous connections (e.g., between manufacturing and business services). This is probably not (yet) the case.
CONCLUSIONS
Following a long period of diffused deindustrialization, after the 2008–09 economic crisis the European Commission has pushed for a process of reindustrialization, aiming to achieve a quality and innovation-based resurgence of the manufacturing sector and, through this, to favour overall growth and competitiveness.
Despite a wide political interest, however, the present work is – as per our knowledge – one of the first academic attempts to explore this issue, both conceptually and empirically. Our aim was to identify specific regional reindustrialization patterns – based on traditional sectoral specialization and its evolution over time, according to a path-dependence conceptual framework – and to investigate their relationship with the dynamic of regional productivity.
Conceptually speaking, different strategies can be put in place to reindustrialize, either by reinforcing the pre-existing industrial fabric or diversifying it, involving new and possibly more dynamic manufacturing sectors, starting from different degrees of specialization in reindustrializing manufacturing sectors. All this gave rise to four possible strategies of reindustrialization, expected to be differently associated to productivity gains.
Drawing on a purposely gathered regional-sectoral database, European NUTS-2 regions were here categorized in the different reindustrialization patterns identified and their association with regional productivity growth was studied. Our findings show that reindustrialization, and especially the reinforcement pattern, is positively associated to the dynamic of industrial productivity. Favourable effects seem in fact to propagate to the whole industry, although apparently they are not yet strong enough to be detectable at the aggregate level.
Our empirical results suggest that industrial policies should be directed towards the strengthening of local industrial reindustrialization specificities when they already exist. When this is not the case, it is the goal of policymakers to identify those reindustrialization manufacturing sectors on which their normative interventions should concentrate, since achieving a critical mass of industrial knowledge in the area seems to be important to make the most out of a reindustrialization process. The choice of the specific manufacturing sectors is a matter of prioritizing based on a clear vision about the future development of the area. In this sense, a smart specialization strategy can be of help both to prioritize and to choose a vision for the region (Capello & Kroll, Citation2016). If this has been in fact the case in the different reindustrialization processes we observed is a research objective still to be pursued, studying in particular the key local manufacturing sectors on which the industrial policy should be based at the regional level.
Future research may also focus on how much the trends highlighted in the present work are related to back-shoring or near-shoring phenomena.Footnote5 Moreover, a causal relationship between different reindustrialization patterns and productivity gains calls for additional in-depth analysis. Finally, further research may also elaborate on the idea of the European Union that reindustrialization should take place especially in advanced manufacturing sectors. Our feeling is that this is not necessarily the best way to proceed. What is instead important is that a modernization process accompanies reindustrialization, whatever manufacturing sector is involved. This is an extremely important topic that we aim to address in the near future.
Supplemental Material
Download PDF (212.4 KB)DISCLOSURE STATEMENT
No potential conflict of interest was reported by the authors.
Additional information
Funding
Notes
1. As for the choice of periods, they were selected based on the observation of the trends in the data and on data availability, and were confirmed by the European Central Bank (ECB) (Citation2017). In order to make the trends in the two periods perfectly comparable, the compound annual growth rate (CAGR) is used. This is computed as:
,
where t0 is the initial year; and tn is the final one.
2. For a more thorough description of the detailed aspects related to the construction of the database, see Appendix A in the supplemental data online.
3. NUTS-1 for Germany, due to data availability.
4. Compound annual growth rate (CAGR). The data source is Cambridge Econometrics, which was preferred with respect to Eurostat since it allowed us to cover all the countries (including the UK) at the NUTS-2 level up to 2018, at both the aggregate and industrial sector (B–E) levels.
5. Reshoring production activities to nearer places with respect to previous locations.
REFERENCES
- Acemoglu, D., Autor, D., Dorn, D., Hanson, G., & Price, B. (2014). Return of the Solow paradox? IT, productivity, and employment in US manufacturing. American Economic Review, 104(5), 394–399. https://doi.org/10.1257/aer.104.5.394
- Aghion, P., Bergeaud, A., Boppart, T., Klenow, P. J., & Li, H. (2019). Missing growth from creative destruction. American Economic Review, 109(8), 2795–2822. https://doi.org/10.1257/aer.20171745
- Alessandrini, M., Celotti, P., Gramillano, A., & Lilla, M. (2017). The future of industry in Europe. European Committee of the Regions.
- Arthur, W. B. (1988). Self-reinforcing mechanisms in economics. In P. Anderson, K. Arrow, & D. Pines (Eds.), The economy as an evolving, complex system (pp. 9–31). Addison-Wesley.
- Arthur, W. B. (1989). Competing technologies, increasing returns, and lock-in by historical events. The Economic Journal, 99(394), 116–131. https://doi.org/10.2307/2234208
- Aydalot, P. (Ed.). (1986). Milieux innovateurs en Europe [Innovative environments in Europe]. Groupe de Recherche Européen sur les Milieux Innovateurs (GREMI).
- Aydalot, P., & Keeble, D. (Eds.). (1988). High technology industry and innovative environment. Routledge.
- Balland, P. A., & Rigby, D. (2017). The geography of complex knowledge. Economic Geography, 93(1), 1–23. https://doi.org/10.1080/00130095.2016.1205947
- Baum, J. A. C., & Silverman, B. S. (2001). Complexity, attractors, and path dependence and creation in technological evolution. In R. Garud & P. Karnøe (Eds.), Path dependence and creation (pp. 169–209). Psychology Press.
- Becattini, G. (1989). Sectors and/or districts: Some remarks on the conceptual foundations of industrial economics. In E. Goodman & J. Bamford (Eds.), Small firms and industrial districts in Italy (pp. 123–135). Routledge.
- Boschma, R. (2004). Competitiveness of regions from an evolutionary perspective. Regional Studies, 38(9), 1001–1014.
- Boschma, R. (2017). Relatedness as driver of regional diversification: A research agenda. Regional Studies, 51(3), 351–364. https://doi.org/10.1080/00343404.2016.1254767
- Boschma, R., & Frenken, K. (2011). Technological relatedness, related variety and economic geography. In P. Cooke, B. Asheim, R. Boschma, R. Martin, D. Schwartz, & F. Tödtling (Eds.), Handbook of regional innovation and growth (pp. 187–197). Edward Elgar.
- Brynjolfsson, E. (1993). The productivity paradox of information technology. Communications of the ACM, 36(12), 66–77. https://doi.org/10.1145/163298.163309
- Cainelli, G., & Ganau, R. (2021). Knowledge spillovers, related variety and firm heterogeneity. Scienze Regionali – Italian Journal of Regional Science, 2, 167–180. 10.14650/100113
- Camagni, R. (1991a). Regional deindustrialization and revitalization processes in Italy. In L. Rodwin & H. Sazanami (Eds.), Industrial change and regional economic transformation – The experience of Western Europe (pp. 137–167). Harper Collins Academic.
- Camagni, R. (1991b). Local Milieu, uncertainty and innovation networks: Towards a new dynamic theory of economic space. In R. Camagni (Ed.), Innovation networks: Spatial perspectives (pp. 121–144). Belhaven-Pinter.
- Camagni, R. (2008). Towards a concept of territorial capital. In R. Capello, R. Camagni, B. Chizzolini, & U. Fratesi (Eds.), Modelling regional scenarios for the enlarged Europe (pp. 33–47). Springer.
- Camagni, R., Capello, R., & Perucca, G. (2021, May). Towards an interpretation of labour productivity growth: Patterns of regional competitiveness in European regions. Paper presented at the RSAI web conference, May 25–28.
- Capello, R., & Kroll, H. (2016). From theory to practice in smart specialization strategy: Emerging limits and possible future trajectories. European Planning Studies, 24(8), 1393–1406. https://doi.org/10.1080/09654313.2016.1156058
- Capello, R., & Lenzi, C. (2018). The dynamics of regional learning paradigms and trajectories. Journal of Evolutionary Economics, 28(4), 727–748. https://doi.org/10.1007/s00191-018-0565-5
- Carlsson, B. (2007). The role of public policy in emerging clusters. In P. Braunerhjelm & M. Feldman (Eds.), Clusters genesis: Technology based industrial development (pp. 264–278). Oxford University Press.
- Cette, G., Fernald, J., & Mojon, B. (2016). The re-great recession slowdown in productivity. European Economic Review, 88, 3–20. https://doi.org/10.1016/j.euroecorev.2016.03.012
- Chapman, K., MacKinnon, D., & Cumbers, A. (2004). Adjustment or renewal in regional clusters? A study of diversification amongst SMEs in the Aberdeen oil complex. Transactions of the Institute of British Geographers, 29(3), 382–396. https://doi.org/10.1111/j.0020-2754.2004.00250.x
- Cheshire, P. (1991). Problems of regional transformation and deindustrialization in the European community. In L. Rodwin & H. Sazanami (Eds.), Industrial change and regional economic transformation – The experience of Western Europe (pp. 237–267). Harper Collins Academic.
- Christopherson, S., Martin, R., Sunley, P., & Tyler, P. (2014). Reindustrialising regions: Rebuilding the manufacturing economy? Cambridge Journal of Regions, Economy and Society, 7(3), 351–358. https://doi.org/10.1093/cjres/rsu023
- David, P. A. (1985). Clio and the economics of QWERTY: The necessity of history. American Economic Review, 75, 332–337.
- David, P. A. (1986). Understanding the economics of QWERTY: The necessity of history. In W. N. Parker (Ed.), Economic history and the modern economics (pp. 30–49). Blackwell.
- Dei Ottati, G. (2003). The governance of transactions in the industrial district: The 'community market'. In G. Becattini, M. Bellandi, G. Dei Ottati, & F. Sforzi (Eds.), From industrial districts to local development (pp. 73–94). Edward Elgar.
- European Central Bank (ECB). (2017). The slowdown in Euro area productivity in a global context. Economic Bulletin, issue 3.
- European Commission. (2010). An integrated industrial policy for the globalisation era – Putting competitiveness and sustainability at centre stage (COM(2010) 614 final).
- European Commission. (2012). A stronger European industry for growth and economic recovery (COM(2012) 582 final).
- European Commission. (2014). For a European industrial renaissance (SWD(2014) 14 final).
- European Commission. (2019). A vision for the European industry until 2030, final report of the Industry 2030 high-level industrial roundtable. European Commission.
- Fisher, A. (1933). Capital and the growth of knowledge. The Economic Journal, 43(171), 379–389. https://doi.org/10.2307/2224281
- Frenken, K., & Boschma, R. A. (2007). A theoretical framework for evolutionary economic geography: Industrial dynamics and urban growth as a branching process. Journal of Economic Geography, 7(5), 635–649. https://doi.org/10.1093/jeg/lbm018
- Frenken, K., Van Oort, F., & Verburg, T. (2007). Related variety, unrelated variety and regional economic growth. Regional Studies, 41(5), 685–697. https://doi.org/10.1080/00343400601120296
- Gibson, M. (2014). Bringing manufacturing back – Is the tide of offshoring beginning to turn towards reshoring? CIVITAS. https://www.civitas.org.uk/content/files/BringingManufacturingBack.pdf
- Grillitsch, M., Asheim, B., & Trippl, M. (2018). Unrelated knowledge combinations: The unexplored potential for regional industrial path development. Cambridge Journal of Regions, Economy and Society, 11(2), 257–274. https://doi.org/10.1093/cjres/rsy012
- Grillitsch, M., & Sotarauta, M. (2020). Trinity of change agency, regional development paths and opportunity spaces. Progress in Human Geography, 44(4), 704–723.
- Hassink, R. (2007). The strength of weak lock-ins: The renewal of the Westmünsterland textile industry. Environment and Planning A: Economy and Space, 39(5), 1147–1165. https://doi.org/10.1068/a3848
- Hassink, R., & Shin, D. (2005). Guest editorial. Environment and Planning A: Economy and Space, 37(4), 571–580. https://doi.org/10.1068/a36273
- Henning, M., Stam, E., & Wenting, R. (2013). Path dependence research in regional economic development: Cacophony or knowledge accumulation? Regional Studies, 47(8), 1348–1362. 10.1080/00343404.2012.750422
- Hidalgo, C., & Hausmann, R. (2009). The building blocks of economic complexity. Proceedings of the National Academy of Sciences, 106(26), 10570–10575. https://doi.org/10.1073/pnas.0900943106
- Hidalgo, C., Klinger, B., Barabassi, A., & Hausmann, R. (2007). The product space conditions the development of nations. Science, 317(5837), 482–487. https://doi.org/10.1126/science.1144581
- Hoover, E. M. (1948). The location of economic activity. McGraw-Hill.
- Hoyt, H. (1954). Homer Hoyt on the development of economic base concept. Land Economics, 30(2), 182–187. https://doi.org/10.2307/3144940
- Kemeny, T., & Storper, M. (2015). Is specialization good for regional economic development? Regional Studies, 49(6), 1003–1018. https://doi.org/10.1080/00343404.2014.899691
- Lucas, R. E. (1988). On the mechanics of economic development. Journal of Monetary Economics, 22(1), 3–42. https://doi.org/10.1016/0304-3932(88)90168-7
- Marshall, A. (1920). Principles of economics (8th ed.). Macmillan.
- Martin, R. (2010). Roepke Lecture in Economic Geography: Rethinking regional path dependence: Beyond lock-in to evolution. Economic Geography, 86(1), 1–27. https://doi.org/10.1111/j.1944-8287.2009.01056.x
- Martin, R., & Sunley, P. (2006). Path dependence and regional economic evolution. Journal of Economic Geography, 6(4), 395–437. https://doi.org/10.1093/jeg/lbl012
- Maskell, P., & Malmberg, A. (1999). Localised learning and industrial competitiveness. Cambridge Journal of Economics, 23(2), 167–185. https://doi.org/10.1093/cje/23.2.167
- Maskell, P., & Malmberg, A. (2007). Myopia, knowledge development and cluster evolution. Journal of Economic Geography, 7(5), 603–618. https://doi.org/10.1093/jeg/lbm020
- Mathur, V. (1999). Human capital-based strategy for regional economic development. Economic Development Quarterly, 13(3), 203–216. https://doi.org/10.1177/089124249901300301
- Neffke, F., Henning, M., & Boschma, R. (2011). How do regions diversify over time? Industry relatedness and the development of new growth paths in regions. Economic Geography, 87(3), 237–265. https://doi.org/10.1111/j.1944-8287.2011.01121.x
- Nickell, S., Redding, S., & Swaffield, J. (2008). The uneven pace of deindustrialization in the OECD. World Economy, 31(9), 1154–1184. https://doi.org/10.1111/j.1467-9701.2008.01125.x
- Ortega-Argilés, R. (2012). The transatlantic productivity gap: A survey of the main causes. Journal of Economic Surveys, 26(3), 395–419. https://doi.org/10.1111/j.1467-6419.2012.00725.x
- Pisano, G., & Shih, W. C. (2009). Restoring American competitiveness. Harvard Business Review.
- Pisano, G., & Shih, W. C. (2012). Does America really need manufacturing? Harvard Business Review.
- Rodrik, D. (2016). Premature deindustrialization. Journal of Economic Growth, 21(1), 1–33. https://doi.org/10.1007/s10887-015-9122-3
- Rodwin, L. (1991). European industrial change and regional economic transformation: An overview of recent experience. In L. Rodwin & H. Sazanami (Eds.), Industrial change and regional economic transformation – The experience of Western Europe (pp. 137–167). Harper Collins Academic.
- Romer, P. (1986). Increasing returns and long-run growth. Journal of Political Economy, 94(5), 1002–1037. https://doi.org/10.1086/261420
- Rowthorn, R., & Ramaswamy, R. (1997). Deindustrialization: Causes and implications (Working Paper No. No. 97/42). International Monetary Fund (IMF).
- Sachs, J. D., Shatz, H. J., Deardorff, A., & Hall, R. E. (1994). Trade and jobs in U.S. Manufacturing. Brookings Papers on Economic Activity, 1994(1), 1–84. https://doi.org/10.2307/2534630
- Simmie, J. (2012). Path dependence and new technological path creation in the Danish wind power industry. European Planning Studies, 20(5), 753–772. https://doi.org/10.1080/09654313.2012.667924
- Simmie, J., Carpenter, J., Chadwick, A., & Martin, R. (2008). History matters – Path dependence and innovation in British city-regions. National Endowment for Science, Technology and the Arts (NESTA).
- Škuflić, L., & Družić, M. (2016). Deindustrialisation and productivity in the EU. Economic Research – Ekonomska Istraživanja, 29(1), 991–1002. https://doi.org/10.1080/1331677X.2016.1235505
- Solow, R. (1987, July 12). We’d better watch out. New York Times Book Review, 36.
- Stam, E., & Garnsey, E. (2009). Decline and renewal of high-tech clusters: The Cambridge case. Paper presented at the DRUID summer conference, Copenhagen Business School, June 17–19.
- Sydow, J., Schreyögg, G., & Koch, J. (2005, June 30–July 2). Organizational paths: Path dependency and beyond. 21st EGOS colloquium, Berlin, Germany.
- Trippl, M., & Otto, A. (2009). How to turn the fate of old industrial areas: A comparison of cluster-based renewal processes in Styria and the Saarland. Environment and Planning A: Economy and Space, 41(5), 1217–1233. https://doi.org/10.1068/a4129
- Van Ark, B., Chen, V., Colijn, B., Jäger, K., Overmeer, W., & Timmer, M. (2013). Recent changes in Europe’s competitive landscape and medium-term perspectives: How the sources of demand and supply are shaping up. European Economy, Economic Papers, 485. https://ec.europa.eu/economy_finance/publications/economic_paper/2013/pdf/ecp485_en.pdf
- Weimer, A., & Hoyt, H. (1939). Principles of urban real estate. Ronal.