
ABSTRACT
This paper proposes a multidimensional synthetic index for measuring the quality of employment using the Alkire–Foster method. The results generated by this index highlight important differences between Chile's regions, but also a process of convergence, which has been mostly driven by regulatory changes and public policy rather than economic growth. The paper shows how much a synthetic index can contribute to regional analysis and how it can inform policymakers by focusing attention on the most vulnerable workers in regional labour markets.
1. INTRODUCTION
In recent years, the combined effects of globalization and market liberalization have led to the increased flexibilization of employment conditions in both developed and developing countries. In developing countries, formal employment has become more precarious, while levels of ‘informal employment’ have not always diminished. The economic effects on labour markets of the Covid-19 pandemic could potentially exacerbate such processes and impact individual regions very differently. As Jones and Green (Citation2009, p. 2474) concluded in the case of the UK, ‘it is the quality of jobs as much as the quantity of jobs, which is important in terms of assessing the relative positions and progress of regional economies’.
Bustillo et al. (Citation2011) have discussed at length that the quality of employment (QoE) is a multidimensional phenomenon. A key motivation for measuring it is ethical: is it acceptable that some people around the world work under such appalling conditions that these affect their health and well-being? Employment is clearly an important space in which many inequalities become manifest. At least the proportion of deprived workers in the labour market should be identified.
A multidimensional measure, however, requires good data and a reliable methodology based on a coherent conceptual framework that provides justification for the normative decisions that inform it. One framework applied successfully in the measurement of multidimensional phenomena is the capability approach (Alkire et al., Citation2015). It first informed the human development index (HDI) (Anand & Sen, Citation1997) and then the multidimensional poverty index (MPI) (Kovacevic & Calderon, Citation2014). This work can be adapted to measuring QoE deprivation and facilitate the study of employment inequalities across regions. Although the regional studies literature has examined differences in specific employment conditions (Green & Livanos, Citation2015; DiCaro & Nicotra, Citation2015; McCollum, Citation2013; Quintana et al., Citation2020; Iglesias et al., Citation2011; Goos & Manning, Citation2007; Jones & Green, Citation2009), it has not analysed QoE deprivation as a whole. This leaves analysts and policymakers with a fragmented picture of regional labour markets, which may be characterized by significantly different trends in QoE deprivation, which may exacerbate or reduce regional inequalities.
From the regional perspective, the literature on the QoE suffers from three additional drawbacks: first, most indicators look at employment conditions from a macro-perspective and thus ignore regional heterogeneity (e.g., Leschke, Citation2014; Organisation for Economic Co-operation and Development (OECD), Citation2014). Second, this literature measures the QoE by means of dashboard indicators that cannot capture simultaneous deprivations (OECD, Citation2014; Green & Mostafa, Citation2012; Soffia, Citation2018). Furthermore, replicating dashboard indicators by region would produce results that are difficult to interpret as the contributions of component indicators to the overall QoE could not be calculated. Third, restrictions on sample sizes in surveys of employment conditions often mean that regional breakdowns are not statistically valid.Footnote1
In developing countries, data availability is even more restricted, but the need for a summary indicator that highlights regional disparities is greater. Given the need for a summary indicator of QoE deprivation that can serve policymakers, Sehnbruch et al. (Citation2020) propose a synthetic indicator for nine Latin American countries.Footnote2 Their study, however, is limited by its purpose as a cross-country overview that presents a new methodology. By contrast, the present paper investigates one country in depth (Chile) over time and across regions.
Chile is well known for its successful development, which has achieved both steady economic growth as well as significant improvements in its human development indicators despite persistently high levels of inequality (Parro & Reyes, Citation2017). A recent quality-of-life study of the OECD's regions shows that nine of Chile's 15 regions are among the 20 regions that have improved their multidimensional standard of living most between 2003 and 2012 (Veneri & Murtin, Citation2019). Yet, regional disparities and inequalities in Chile still remain significant (Aroca et al., Citation2018; OECD, Citation2018).
Chile is divided into 17 regions, with 41% of the national population in the Metropolitan Region of Santiago.Footnote3 Its regions have diverse natural resource endowments with copper mining in the north, mixed economic activities in the central regions (including manufacturing, services, agriculture and some mining), while southern regions are dominated by the forestry, aquaculture and agricultural sectors. In the sparsely populated extreme south, oil and gas extraction and public sector employment predominate. Research emphasizes that public policy efforts have failed to address significant regional inequalities (Aroca, Citation2009).
This paper answers two main research questions: How has employment deprivation developed over time and across Chile's regions? Which factors have contributed most to the development of QoE deprivation?
The hypotheses associated with these research questions are as follows: first, higher rates of gross domestic product (GDP) per capita growth tighten regional labour markets by reducing unemployment and therefore reduce QoE deprivation levels over time (Duranton & Puga, Citation2003). Second, regional characteristics such as GDP per capita, employment rates, educational levels, urbanization rates and the structure of local economies impact QoE deprivation (Jones & Green, Citation2009), as do the characteristics of individual workers.
To examine these hypotheses, this paper reviews the literature on the QoE and outlines a theoretical framework before describing the datasets and methodology used. It then presents the findings: first, QoE deprivation levels have improved and converged significantly over time; second, public policies have improved some aspects of QoE deprivation (income and hours worked), but have neglected others (occupational status, tenure and social security contributions); third, at the regional level unemployment rates and the proportion of workers employed in small firms significantly impact levels of QoE deprivation; and fourth, individual education levels are the most important determinant of whether or not a worker is deprived in the labour market. The final section concludes.
2. A THEORETICAL FRAMEWORK FOR THE QUALITY OF EMPLOYMENT (QoE)
2.1. An overview of the literature on the QoE
Ever since the International Labour Organization (ILO) launched its concept ‘decent work’ in 1999 and the European Union (EU) put forward the Laeken indicators in 2000, both academic and policy attention has focused on conceptualizing, defining and measuring the quality of jobs.Footnote4 This literature has achieved a consensus on the fact that the well-being of workers depends on the characteristics of their job. It builds on a growing body of literature that studies individual employment characteristics, such as non-standard employment contracts, which have increased significantly due to deregulation (Hipp et al., Citation2015). It further agrees that theories of compensating wage differentials do not hold in practice. Instead, low wages and poor working conditions are observed in the same jobs (Cazes & Verick, Citation2013). Moreover, several European studies illustrate that wages are not the job characteristic that workers most value (Bustillo et al., Citation2011). This research agrees that the QoE is multidimensional, and that it should be measured both over time and across countries (OECD, Citation2014).
However, this consensus does not extend to discussions about how the concept should be measured (Taylor, Citation2017). Analysts disagree about which variables should be included, and whether or how they should be aggregated. The literature also frequently mixes up variables related to job quality (such as types of contracts), with those of individuals (e.g., education level), regulatory and legal frameworks (e.g., union and collective bargaining rights) and even macroeconomic indicators (e.g., unemployment and participation rates).Footnote5
For example, the ILO defined decent work as ‘opportunities for women and men to obtain decent and productive work, in conditions of freedom, equity, security and human dignity’ (ILO, Citation1999, p. 3). This definition covers every aspect of work, employment and indeed labour markets. Operationalizing such a concept therefore proved difficult and produced a definition that considers a total of 71 variables, grouped into 11 dimensions.
Similarly, the European Commission proposed a framework for measuring job quality that consists of 55 indicators grouped into four dimensions. The unwieldy nature of such measures has limited their practical implementation, as well as their political and academic impact. Some studies of job quality have thus attempted to limit this plethora of indicators to a more manageable number.Footnote6 Several methodologies have been presented for measuring decent work, including by ILO experts (Anker et al., Citation2003; Ghai, Citation2003). Green and Mostafa (Citation2012) introduced a model based on seven indicators using data from the European Working Conditions Survey, while the OECD published a job quality indicator in its 2014 Employment Report that brought together six variables in three dimensions.Footnote7 In the UK, the Taylor Report (Taylor, Citation2017) presented a proposal for measuring good work using seven variables.
However, these reports still produce a dashboard of indicators: as Leschke et al. (Citation2014) and Bustillo et al. (Citation2011) conclude, the principal limitation of a dashboard methodology is that it does not provide a composite index that can be monitored over time. This limits its usefulness to policymakers, who need to be able to track job-quality developments and target scarce resources at the most deprived workers. Most importantly, dashboard indicators do not allow for the analysis of joint distributions over time. This means that policymakers cannot use them to identify the most vulnerable workers in the labour market or to pinpoint which job and individual characteristics contribute most to deprivation in the labour market. This also means that they cannot use existing indicators to direct public policy resources towards the most vulnerable workers, which is particularly necessary in developing countries where all social policies are specifically targeted at the most vulnerable.
Finally, in developing or transitional economies the data required for the dashboard methodologies reviewed above are generally not available nor are sample sizes large enough for disaggregation at the regional level.Footnote8 Analysts are forced to focus only on the most essential variables. For example, the Inter-American Development Bank (Citation2017) published a synthetic index of job quality in Latin America that only summaries unemployment and participation rates and the proportion of informal and workers not earning a living wage. It thus combines indicators of labour market opportunities (job quantity) with job quality, which precludes an analysis of their interrelationship, their joint distributions or any analysis at the level of the individual worker. The index does not include variables on job characteristics that are equally important, such as social security coverage, the occupational status of workers or job stability.
2.2. Framing the debate on the QoE: the capability approach and the Alkire–Foster (AF) method
In their review of the literature on job quality, Burchell et al. (Citation2014) and Bustillo et al. (Citation2011) highlight that this literature uses different conceptual approaches and justifications for the inclusion or exclusion of particular variables. They conclude that any effective measure of job quality must be based on a sound theoretical framework that adds value to existing measures, in terms of both justifying which variables should be included in the index and why, as well as by using a methodology that adds new insights to the subject.
Following Lugo (Citation2007) and Sehnbruch (Citation2006), this paper argues that the capability approach can provide such a theoretical framework, in particular because it has been successfully operationalized by Alkire and Foster (Citation2011) when they designed a methodology for measuring multidimensional poverty.Footnote9 As Sen (Citation1975) argues, employment is of both instrumental and intrinsic value: first, it allows individuals to generate resources through their own endowment (labour), which are of instrumental value and permit them to develop other capabilities. Second, jobs are intrinsically valuable to workers as they allow them to develop their individual functionings and capabilities that in turn give them self-worth, constitute an important component of their personal identity and thus make a significant intangible contribution to their well-being. Or, using Sen's words, employment is one of ‘the various attainments in human functioning that we may value’ so that a more comprehensive approach to the subject of employment in the context of the capability perspective requires departing ‘from concentrating on the means of living to the actual opportunities of living’ (Sen Citation2009, p. 233).
To get a better idea of a worker's employment-related capabilities, it is therefore not enough to ask whether or not they are employed (the quantity of employment that we traditionally measure), but also if they are employed in a good job. In fact, in lower income countries, this is often the main question as few workers can afford to be unemployed (Sehnbruch, Citation2006; Cazes & Verick, Citation2013). The AF method, which is now widely used to measure multidimensional poverty, can easily be adapted to measure deprivations in the labour market (Sehnbruch et al., Citation2020). However, there are distinct theoretical and conceptual differences between measuring poverty and the QoE: in poverty measurement, there is widespread policy agreement that more income, better health, more education and better living conditions all contribute to improving the quality of life of individuals and therefore also the functionings and capabilities that they can exercise.
In the case of employment and labour markets, there is, unfortunately, no such agreement as to what actually constitutes a good-quality job, Furthermore, the different interests of the social actors involved may often be contradictory. For instance, higher levels of wages are better for workers, but not for employers. Similarly, employers may require working conditions to be as flexible as possible, while workers and governments (for different reasons) may require higher levels of job stability. This prompts the question of whose interests and choices should be followed in the construction of a QoE index?
Answering this question requires normative value judgements, as does the measurement of multidimensional poverty put forward by Alkire and Foster (Citation2011). For example, in the context of poverty, a family may decide to take a child out of education in favour of participating in the labour market or taking on household chores. In the long run, such a decision will curtail this child's capabilities and freedoms. The approach to measuring multidimensional poverty therefore takes a normative decision to consider this child to be deprived in the dimension of education, regardless of the family's choice.
Similar choices may also characterize the decisions of individual participants in the labour market: a worker may choose not to be formally employed so as not to contribute to social security systems, while governments may apply a normative decision that requires contributions to be made so that the future capabilities and freedoms of a worker are not constrained by a lack of income (e.g., pension) or access to healthcare.
These judgements determine not only which variables are included in an index, but also their cut-off lines and weights. Alkire et al. (Citation2015) discuss such value judgments in detail and conclude that they should ‘be transparent and informed by public debate and reasoning’ (p. 8). Beyond individual choices it is also necessary to consider the ‘common good’ in the Aristotelian sense when constructing such indicators (Sen, Citation1999, Citation2009): both societies and individuals are more likely to flourish if education levels are high, they are healthy and income levels are protected over the life cycle. Hence, composite indicators measuring deprivation are significantly driven by public policy motivations. These include producing official measures of socio-economic phenomena that can be monitored over time and communicated effectively; identify overall patterns of deprivation; compare subnational groups (such as regions, urban or rural areas, or ethnic groups); analyse the composition of deprivation in different regions; evaluate the impact of policy programmes on these indicators; and target geographical regions or households with resources or policies (Alkire et al., Citation2015, p. 21).
The QoE deprivation index presented in this paper is therefore based on value judgements that consider which job characteristics are likely to ensure the best possible development of a worker's functionings and capabilities with limited consideration of individual preferences and a view to what makes labour markets function best so that they can serve as a foundation for future human development. It thus defines a clear objective, as opposed to being torn apart by the contradictory interests of individual stakeholders as has occurred with some institutional approaches to the subject (Piasna et al., Citation2019). This argument is discussed in more detail in section 4, where the cut-off lines of individual indicators are presented.
2.3. The QoE in the regional literature
An extensive analysis was undertaken in the economic geography literature on the relationship between economic growth and employment in the regions of different countries, noting the regional inequalities that are found.Footnote10 There is a consensus in this literature that variables such as (un)employment rates or wage differentials do not present a complete picture of how job characteristics differ across regions (Green & Livanos, Citation2015). Green and Livanos (Citation2015) conclude that since the Great Recession in UK regions, relatively low unemployment rates disguise a much greater impact on levels of involuntary non-standard employment. Similarly, Jones and Green (Citation2009) examine changes in the quantity and quality of jobs in UK regions over 10 years and conclude that the quality of jobs is at least as important as the quantity of jobs when it comes to assessing the relative positions and progress of regional economies. These conclusions are echoed by McCollum (Citation2013), who examines how workers in the UK switch between unemployment and low-quality jobs on a permanent basis, as well as by Goos and Manning (Citation2007), although the latter use wages as an indicator of overall job quality.
In some European countries, the issue of job quality has become especially important as short-term hiring mechanisms have been introduced to increase overall employment rates (Iglesias et al., Citation2011). Arranz et al. (Citation2019) examine non-wage job quality in Europe and find that in countries where the wage-bargaining system is more coordinated or centralized and where employment protection of regular workers is stricter, these institutions tend to favour the job quality of older workers. Moreover, models developed by Di Cataldo and Rodríguez-Pose (Citation2017) for analysing the drivers of employment in 18 European countries find that regional public institutions and human capital endowments are the two main factors for the generation of employment and reduction of labour exclusion in less developed regions.
What is problematic with this approach is that it leads to very fragmented conclusions as one paper, for example, focuses on wages and another on non-standard employment relationships, while employment opportunities across regions are examined in another. It is therefore challenging to obtain an overview of how and why particular regions are being affected more or less by precarious employment; how job quality interacts with the quantity of jobs; what drives these regional differences; and which public policies or institutions improve job quality at the regional level.
In developing countries, the regional literature on employment conditions is even more scarce and focuses more on disparities in employment opportunities across regions and territories, often linked to other factors relevant to development.Footnote11 In Latin America, Quintana et al. (Citation2020) examine the impact of precariousness on income inequalities in Brazil, Mexico and Ecuador and conclude that the disparity of inequality across regions has improved in Brazil, deteriorated in Mexico, while the Ecuadorean results are inconclusive. However, metropolitan areas can also be highly unequal: Fernández de Córdova et al. (Citation2016) show that employment opportunities are concentrated in the metropolitan cores but are scarce in peripherical areas. In general, the available literature for regional convergence and disparities on labour and well-being in different Latin American countries indicates the importance of social and productive infrastructure (Volpe Martincus et al., Citation2017) as well as geographical isolation and levels of education (Berdegué & Soloaga, Citation2018; Royuela & García, Citation2015).
Thus, while the literature in developed countries recognizes the importance of regional differences in terms of employment opportunities and conditions, in developing countries it has not focused on the quality of jobs to the same extent, however it may be defined. This paper thus contributes to this incipient literature as regions inevitably present different characteristics, especially in terms of their sector composition in the commoditized developing economies of Latin America. In Chile, for example, at least 20% of workers in the O’Higgins, Maule and Ñuble regions are employed in the agricultural sector, while Antofagasta in the north employs 26.4% of all workers in the mining industry. Even more challenging is the task of comparing regional indicators across Latin American countries, as data availability, quality and comparability vary significantly (Bourguignon, Citation2015).
3. DATA AND METHODOLOGY
3.1. Data
This paper draws on individual-level data from eight repeated cross-sections from Chile's National Household Survey (CASEN) between 1996 and 2017.Footnote12 The years 1998 and 2009 were excluded as crucial variables needed for the index presented were constructed differently in those years. The other years of the survey were selected because they allow for a long-term analysis of the QoE deprivation observed in Chile's regions, showing the country at different stages of its development process. The CASEN is one of the most extensive and long-standing household surveys in Latin America with a sample size of 70,948 households and 216,439 individuals, which amounts to 1% of the total Chilean population in each wave. It is conducted by Chile's Ministry for Social Development on a bi- or triennial basis. Each survey is representative at the national and regional levels.Footnote13 The CASEN collects information on various characteristics of a household, including labour market activity. Table A1 in Appendix A in the supplemental data online presents further details on the samples used in this paper.
3.2. The AF method (2011)
As stated in the introduction, the key difference between Sehnbruch et al. (Citation2020) and the present paper is that the former developed and presented a methodology for measuring QoE deprivation across countries, while this paper focuses on the application of this approach to a single case study and examines the heterogenous development of Chilean regions over time.Footnote14
The AF method is a well-known axiomatic strategy used to summarize multidimensional information using a counting approach with a double cut-off. Traditional composite indices or dashboard indicators compile relevant information but do not recognize that individuals can be deprived in several dimensions or indicators at the same time. The QoE deprivation index presented below is specifically designed to capture such simultaneous deprivations. As discussed in the following section, it summarizes three dimensions and five variables in a composite measure and – in line with the capability approach – uses a double cut-off strategy that allows the measure to focus on those workers, who have more overlapping deprivations (Alkire et al., Citation2015).
The first cut-off of the AF method dichotomizes each of the five indicators of achievement vectors into deprivations. The weighted sum of deprivations then provides a counting vector that captures the accumulated distribution of detrimental conditions. A second cut-off identifies deprived individuals (the headcount ratio, H), and the average of their weighted sum of deprivations is the intensity of the condition (intensity score, A). The QoE index (M0) is the product of the percentage of individuals identified as being QoE deprived and the average deprivation share (M0 = H × A). M0 is what this paper refers to as the QoE index.
A counting vector computes the sum of the weighted number of deprivations suffered by an individual, denoted as cI. Next, this vector is compared with a thresholds k, below which a person is identified as having a low QoE if cI < k. Hence, the H measurement is the sum of the individuals who are QoE deprived (i.e., having at least k deprived dimensions) compared with the total population of workers under consideration. The intensity (A) is the average number of deprived dimensions (cI) among those considered to have low QoE.
The M0 measure summarizes information about the occurrence and extent of the QoE deprivation by multiplying headcount (H) and intensity (A). In other words, it is the weighted sum of deprived dimensions among those who hold poor-quality jobs in relation to the total number of possible deprived dimensions for all individuals. This measure is designed to permit subgroup and dimensional decomposition which is crucial for the analysis of regional disparities in repeated cross-sectional surveys and permits the analysis of how QoE deprivation relates to other measures of socio-economic progress, such as economic growth, employment rates or levels of education.
Econometrically, this paper uses fixed and random effects to study the longitudinal association of the QoE and the headcount ratio with a set of aggregated independent variables at the regional level. Subsequently, following Green and Livanos (Citation2015), a probit model with Heckman selection was implemented to explore the probability of being in poor QoE in relation to individual characteristics.
For a precise formulation of the AF methodology, see Appendix B in the supplemental data online.
3.3. Dimensions, indicators, cut-offs and weights
To create a multidimensional QoE index, this paper selects dimensions and indicators that are considered, first, to be of both instrumental and intrinsic value by the capability approach so that workers can develop their employment related functionings (Sen, Citation1975, Citation1999); and second, are deemed essential by the job-quality literature, which has achieved a basic consensus on which variables most contribute to the well-being of workers (Green, Citation2021; OECD, Citation2014). The five dimensions included in the index are therefore: earnings, job stability, and employment conditions.
The variables selected reflect the principle of parsimony, which also characterizes the AF family of indices: only essential variables on which a consensus has been achieved are included in the index. The selection of variables included in the index is also limited by data availability. Although data on employment conditions have been gathered in Chile on an ad hoc basis, issues such as health and safety at work, production intensity or task autonomy are not regularly included in any Chilean employment or household survey.
Finally, and as discussed in section 2.2, the QoE index incorporates value judgements to determine the selection of variables and their respective cut-off lines, as discussed below. For example, some variables related to the QoE, such as unionization, collective bargaining or vocational training, have not been included in the index as there is no consensus on what would constitute an ‘ideal cut-off line’.
The QoE index presented in follows the methodology used by Sehnbruch et al. (Citation2020). The index is based on a consensus of three important dimensions distilled from the literature reviewed above (labour income, employment stability and employment conditions), which are equally weighted. Specifically, the QoE index summarizes information on earnings, occupational status of workers, tenure, social security contributions and working hours. The respective weights of these indicators, their cut-off lines for each variable and for the index overall are summarized in .
Table 1. Dimensions, indicators, cut-offs and weights of the quality of employment (QoE) index.
3.3.1. The income dimension
This dimension (income) considers the monthly earnings reported by each worker from his or her primary employment. Income is an important resource that allows individuals to realize functionings and capabilities (Sen, Citation1999) and there is widespread consensus in the job-quality literature that a measure of earnings should be included in any index (OECD, Citation2014). To establish the deprivation cut-offs, official data were used from the Chilean Ministry of Social Development, which compiles the value of Chile's basic food basket each year: Income equivalent to two food baskets per person is considered to be the official poverty line in Latin American countries. As Chilean workers have at least one dependant, generally a child, a worker must earn a minimum of four food baskets to live above the poverty line.Footnote15 However, living just above the poverty line still only constitutes a minimal level of income with which a worker would find it difficult to sustain basic functionings in the labour market (such as buying appropriate clothing or affording transport to work). The cut-off line for income from labour is therefore set at six food baskets per worker in recognition of the fact that more income is required for a worker to be able to develop and exercise basic capabilities for both him/herself and at least one dependant.Footnote16
3.3.2. The employment stability dimension
The second dimension of the QoE index relates to employment stability, which is crucial as the ability of a worker to realize basic functionings and develop capabilities depends not only on having a job, but also on the stability of this job (Sehnbruch Citation2006; Bustillo, Citation2011; Green & Mostafa, Citation2012; OECD, Citation2014). This dimension therefore considers the two key components, namely the occupational status of a worker as well as job tenure. The combination of these two variables is important as research shows that job rotation has become a significant problem in Latin America, where open-ended contracts no longer guarantee a stable employment relationship (Busso et al., Citation2017). The occupational status of a worker thus serves as an indicator of the legal rights associated with a job, while job tenure serves as an indicator of its stability.Footnote17
Specifically, the variable occupational status considers wage-earners without formal written contracts and the self-employed to be deprived. This is because neither is protected by employment legislation or collective organizations, they have no employment rights, and they would find it difficult to sustain any kind of legal recourse in relation to their economic activity. Note, however, that a self-employed worker is not necessarily classified as deprived overall by this index, provided s/he contributes to the pension system.
In the case of job tenure, workers are deprived if they have been employed for fewer than three years in their primary occupation. The cut-off line of three years was used because Chile's employment protection legislation entitles workers to one month's severance pay per year of tenure. A three-year cut-off therefore provides employees with three months of wages, which is enough to weather the average duration of unemployment in Chile (approximately three to five) months at a replacement rate of between 60% and 70%. In addition, potential benefits from the Chilean unemployment insurance system are also linked to this formula.Footnote18 The three-year cut-off is also relevant for self-employed workers: a business that has survived at least three years is significantly more likely to survive in the long term. It is further important to note that a tenure cut-off of three years is established even though workers may be moving into a better job. However, initial research suggests that this is rarely the case as most Chilean workers, and especially women, either move sideways, become stuck in poor-quality employment or frequently move in and out of the labour market, thus undermining both the consistency of earnings, contributions and taxes (Prieto & Sehnbruch, Citation2022).
The variables occupational status and tenure and their cut-off lines imply key value judgements. First, workers with stable jobs contribute more consistently to social security systems, making them less reliant on fiscal resources as they age. Second, it is impossible to improve the productivity levels of an economy if workers rotate too frequently preventing the on-the-job experience and skill accumulation that will make them more productive. Also, high job rotation makes it impossible to invest in the medium-term vocational training of workers (Busso, Citation2017). Therefore, both variables not only contribute to individual well-being but also to the common good of a society in which development progress relies on sustaining a functioning welfare state and productivity gains.
Both subdimensions ignore individual preferences: for example, a worker may prefer self-employment or an informal job to receive more cash in hand rather than contributing to a social security system or paying taxes. However, from a public policy perspective, paying contributions and taxes as well as avoiding excessive job rotation are essential to sustaining social security systems and productivity.
3.3.3. Employment conditions
The dimension employment conditions comprises the indicators pension system contributions and excessive working hours. This also follows the consensus of the international literature discussed above as well as recognizing their intrinsic and instrumental value to developing a worker's functionings and capabilities (Rofman, Citation2005). Like occupational status, pension contribution is also an indicator of employment formality. However, in this dimension it is included as a proxy for other benefits linked together in a single payment mechanism, such as health, accident or disability insurance or maternity rights. Individuals not contributing to a pension scheme are deprived in this indicator.
Excessive working hours have been included in this dimension as an indicator of work–life balance, following not only the international literature, which indicates that excessive working hours produce job strain, stress and generally negative consequences for a worker's health (OECD, Citation2015; Muñoz de Bustillo, Citation2011), but also reduce family–life balance (Gornick & Meyers, Citation2003). Any individual working more than 45 hours is considered deprived. This cut-off is based on current legislation in Chile, which introduced a maximum standard working time of 45 hours per week in 2005.
From a public policy perspective, excessive working hours are important because they have implications for other public services required to support workers (e.g., childcare facilities), and also because excessive working hours in the long run are likely to generate greater costs to national health insurance systems in terms of treatments for both physical and psychological ailments. Again, the effects of long and/or prohibitive working hours are not limited to individual workers and their capabilities, but also affect their families and society at large (Spurgeon & Cooper, Citation2000).
Following Atkinson (Citation2003), equal weights were considered due to the similar relative importance of each dimension in the context of job quality. The overall QoE index cut-off was selected following the structure of other multidimensional indices such as the global MPI (Alkire & Santos, Citation2014). Given a set of three dimensions, an individual is considered deprived overall if they are deprived in at least one dimension in the case of income or two indicators that can be part of any dimension. Associations and correlations were explored at the indicator level for each year (see Table A2 in Appendix A in the supplemental data online).
4. RESULTS AND FINDINGS
4.1. QoE index results: regional patterns and convergence
presents national and regional results for the QoE deprivation index (M0) for 1996, 2006 and 2017. In 1996, 66.7% of the labour force had poor QoE (headcount ratio), their average intensity of deprivation was 59.5%, and the overall QoE index was 0.40. Twenty-one years later, the deprivation and intensity levels had dropped to 41.3% and 53%, respectively, producing an overall index result of 0.22. Thus, between 1996 and 2017, the national QoE deprivation index decreased by 44.8%.
Table 2. Quality of employment (QoE) index estimates.
However, the QoE deprivation index improved at both the national and regional levels, although there is some heterogeneity between regions in terms of the extent of these improvements. While the region of O’Higgins improved the most (61.6%) and is the only one to have improved consistently (in terms of both its headcount and intensity ratios), Tarapacá and Arica/Parinacota only improved by 26.5%.
Chile's largest (by population) and most urbanized region, the Metropolitan Region of Santiago, improved much less, but from a much lower starting point. The results further seem to indicate that similar agricultural regions (El Maule, Bío Bío and Araucanía) with similar industrial structures also perform differently, suggesting that there may be regional characteristics that explain these differences. But despite these variations, a convergence of regional results towards the national average can be detected over the period analysed.
shows this evolution of regional convergence more clearly: in 1996, the QoE index had a range of 0.23, from the lowest to the highest value. By 2017, this dispersion had decreased to 0.11. The box plot in shows the weighted distribution of regions for each year, while the triangle within each bracket marks the national average, and a line marks the median index value. Bubbles are scaled to represent the number of deprived workers in each region.
Figure 1. Changes over time of the quality of employment (QoE) deprivation index, 1996–2017.
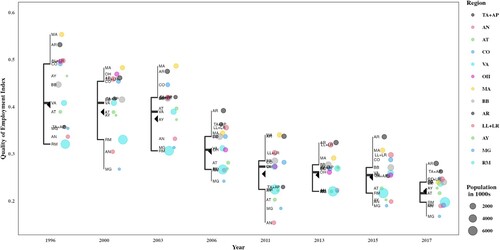
Every period shows an improvement – although not always a significant one – in terms of the national QoE index. On average, the index improved by 2.1% in each period, with a maximum improvement of 6.1% between 2003 and 2006. Overall, all regions in Chile improved their result during this entire period by more than 25%. Improvements in regional inequalities follow a similar pattern as national results except between 1996 and 2000 when the median increased marginally. As discussed above, these results, however, are heterogeneous. A total of 10 out of 13 regions have reduced their levels of poor QoE by 40–60% with five having at least halved their deprivation levels between 1996 and 2017.Footnote19
Convergence analysis following Barro and Sala-i-Martin (Citation1992) confirms these results (see Table A3 and Figure A1 in Appendix A in the supplemental data online). The negative betas show that those regions with the highest deprivation at the outset experienced the most improvements in their QoE index, particularly between 1996 and 2006. Similarly, sigma convergence also illustrates the significant reduction in the dispersion indicators in the first decade (1996–2006) and a less noticeable change between 2006 and 2017.
One reason why QoE deprivation in some regions may have improved more than in others is that they have experienced higher economic growth. To examine this hypothesis, plots the variation in Chile's regional annual GDP growth rates against the QoE deprivation change to illustrate how little they are related. Over the period studied (1996–2017), regional growth does not seem to explain changes in QoE deprivation. For example, in the Magallanes region, economic growth was only 1.9% while QoE deprivation decreased by 2.5%. By contrast, economic growth in the Tarapacá and Arica-Parinacota was almost double that rate (4.1%), but QoE deprivation improved by much less (1.2%). Comparing each subperiod, the results are not conclusive either. Between 1996 and 2006, there is a non-significant negative correlation (−0.44) between changes in regional GDP and the QoE index. However, between 2006 and 2017, there is a positive correlation (0.42), which is also not significant.
Figure 2. Regional growth elasticity and quality of employment (QoE) deprivation index.
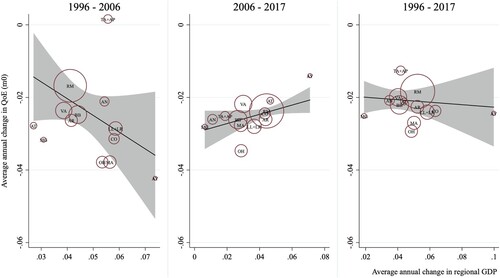
These results question the commonly held assumption that economic growth tightens labour markets by increasing the quantity of employment and in turn improves the QoE (Cazes & Verick, Citation2013). Instead, they confirm initial results on Latin America put forward by Sehnbruch et al. (Citation2020) and González et al. (Citation2021), which also suggest a limited relationship between economic development (GDP per capita levels), the quantity of employment (participation rates) and QoE deprivation levels. These results are mirrored by the more extensive literature on the QoE in European labour markets, which is ably summarized by Green (Citation2021). However, these findings also lead to the question of which regional factors influence the heterogeneous performance of Chile's regions in terms of their QoE deprivation rates. If the QoE index is not driven by economic growth rates, then which other factors are important determinants of these results? The following sections discuss this question, first, by means of a decomposition analysis; and second, by analysing which macroeconomic regional indicators (e.g., growth, sectoral and firm composition, urban and rural divisions) influence these outcomes.
The results above show that the rate of economic growth is not related to QoE deprivation levels. Exploiting the fact that we have regional longitudinal data and have generated a synthetic index, further macroeconomic relationships between other variables and the QoE can now be examined. The QoE index (adjusted headcount ratio: M0) and the percentage of QoE deprived individuals (headcount rate: H) are used as independent variables. Three methodological strategies were implemented: standard ordinary least squares (OLS), fixed and random effects, all using robust standard errors.
first shows that GDP per capita and the employment rate are not significant determinants in any model. The unemployment rate, however, does have an effect and is positively related to poor QoE, while the proportion of the population with higher education and a higher level of urbanization reduces QoE deprivation. Meanwhile, the percentage of workers in micro-firms increases QoE deprivation and is significant in all models. Unfortunately, it is not possible to undertake a systematic analysis of regional differences in terms of their economic sectors (e.g., mining or agriculture) due to sample size restrictions in some regions.
Table 3. Regional regressions and macro-indicators.
4.2. Decomposition analysis
The analysis of dimensional contributions is one of the key features that distinguishes the AF method from traditional methodologies used to measure job quality such as dashboard indicators. Calculating the dimensional contributions allows policymakers to focus workers, who are the most deprived in terms of their employment related capabilities. These contributions, also termed ‘censored headcount ratios’, report the proportion of individuals who are identified as being QoE deprived overall as well as being deprived in a specific indicator or dimension. For instance, in 2017, 20.1% of the national population worked excessive hours, but only 13.4% worked excessive hours and were QoE deprived as well. The weighted sum of these censored headcount ratios or contributions is thus equivalent to the QoE index (M0).
This type of analysis is particularly useful for policymakers as they can see which component variables of the index are particularly problematic, which also indicates that more policy attention and resources should focus on improving these results. But the findings presented below are also significant because they lead to the question of what is driving these results. To examine these issues, this section first decomposes the QoE index and then examines which public policies may have contributed to these results.
When a dimension or variable contributes more to the QoE result than its respective weighting in the formulation of the index, then this means that policy attention should focus on improving this variable. shows the significant improvement that Chile experienced between 1996 and 2017 at both the national and regional levels in terms of the contribution that income deprivation makes to the index result as it decreased significantly from 36% to 30% at the national level. In fact, income deprivation improved across almost all regions. By 2017, it remained a significant contributory factor to the overall index result only in the regions Bío Bío and Araucania.
Figure 3. Percentage contribution to the quality of employment (QoE) index (M0) by region, 1996 and 2017.
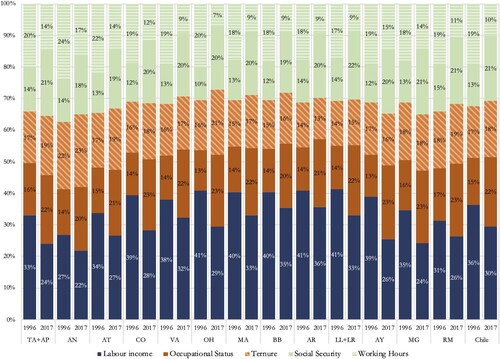
The other variable that over time has contributed less to the index at both the national and regional levels is excessive working hours (down from 19.2% to 10.6% nationally, and by more than 50% in at least six regions). Conversely, the other three variables included in the index have therefore increased in importance in terms of the contributions they make to QoE deprivation. In particular, the lack of social security contributions and the occupational status systematically contribute more than their expected weighting to the overall result of the index, indicating little improvement in these variables.
The discussion prompts the question why some variables included in the index (income and hours worked) have improved so much more than the other three (tenure, occupational status and social security contributions). To examine this question, shows how these variables are distributed. The first graph shows the cumulative distribution of the number of hours in 1996 and 2017. The introduction of regulation that restricted the working week to 45 hours in 2001 (Sehnbruch, Citation2013) reduced the mode of working hours: in 1996, around 40% of the population worked 45 hours or less. By 2017, that number had increased to 80%.Footnote20 The second graph shows the distribution of wages in 1996 and 2017.Footnote21 In both distributions, the minimum wage plays a crucial role in determining workers’ income since a large fraction of jobs in both years pays the minimum wage and many others are clustered around that level. Therefore, if the minimum wage increases by more than inflation, the real income of a significant proportion of workers increases. In 1996, the value of the minimum wage was below six food baskets, while by 2017 this relationship had reversed. Put differently, a worker earning the minimum wage in 1996 would have automatically been considered as deprived in the income dimension of this index. By 2017, a minimum wage earner is no longer deprived as the minimum wage was higher than the cut-off line.
Figure 4. Cumulative probability of working hours and hourly wages, 1996 and 2017.
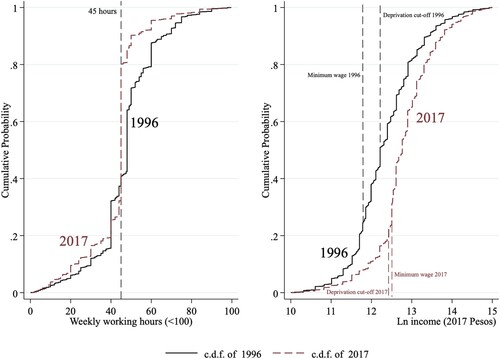
These results lead to the important conclusion that regulatory changes in the working week and the setting of minimum wage levels had a very significant impact on the level of QoE deprivation. This suggests that institutional arrangements governing the labour market may be more important than economic growth in improving working conditions.
4.3. QoE deprivation index and individual characteristics
The regional analysis () presented above provides several insights that improve the understanding of the evolution of the QoE in Chile, but also point to the question of whether there may be other factors aside from labour market policies, which may have contributed to the improvement of QoE across the board. The expansion of educational attainment merits particular attention as this has a direct impact on labour markets and the QoE. It is further important to consider all variables related to the QoE at the same time, to assess the true influence of each variable apart from the partial correlation that might exist between each individual variable and the QoE. In addition, this influence might vary over time.
Table 4. Heckman probit regression results, 1996 and 2017.
To complement these results, focuses on individual characteristics aside from macroeconomic indicators and labour market policies, which may have contributed to the improvement of QoE across the board. Following Green and Livanos (Citation2015), a Heckman probit regression is used to understand the probability of being in a poor-quality job for our pooled results which include all sample individuals from all available years between 1996 and 2017. The selection equation is a probit of labour market participation and the outcome equation is also a probit of low QoE. The selection equation independent variable is composed by individuals with children (Green & Livanos, Citation2015) within the household and education. The variables included in the outcome equation are regional categorical variables using the Metropolitan Region as the reference category, years of education and years squared. The other control variables included are sex, work experience, economic sector of employment, firm size, civil status and being head of household (to differentiate if the individual may be considered as a main or secondary provider).
The variables included in the model are regional categorical variables using the Metropolitan Region as the reference category as well as years of education. The other control variables included are sex, work experience, economic sector of employment, firm size and civil status. At the national level, the results are in line with the analysis presented in the previous section. By 2017, workers are around 20% less likely to be employed in a poor-quality job than in 1996. Figure A4 in Appendix A in the supplemental data online shows the predictive margins for these results over time. In 1996, the evolution of the national marginal effects of 2000, 2003, 2006, 2011, 2013, 2015 and 2017 is significant (p < 0.01).
The results further suggest that women have a higher chance of having poor QoE. Individuals who report having a partner are less likely to be QoE deprived, although women with partners are more likely to have a poor-quality job. Poor QoE is mainly concentrated in small and micro-sized firms and in the primary sector. The likelihood of QoE deprivation in micro-enterprises seems to increase substantially from 1996 to 2017.
A crucial variable in this context is education. At the national level, average years of schooling of workers increased from 10.4 to 13.3 years over the period studied. Moreover, in 1996, 50.5% of workers had completed secondary education, while this proportion increased to 72.8% in 2017. At the regional level, results tend to coincide with improvements in QoE. For instance, the five regions with larger expansions in education have shown 15 perceptual points stronger improvements in terms of QoE compared with those regions at the bottom of the distribution. Controlling for all other variables, one additional year of education reduces the probability of having poor quality employment by 3.2%. Figure A5 in Appendix A in the supplemental data online shows the impact of increases of years of education for 1996, 2006 and 2017. These results show that higher education levels have continuously decreased the likelihood of having bad QoE, regardless of which year we examine.
5. DISCUSSION AND CONCLUSIONS
The QoE index presented in this paper constitutes the first attempt to analyse how QoE deprivation has evolved over time and across regions in a developing country by means of a single synthetic measure.
As discussed above, this paper draws on the capability approach in three important ways: first, it uses the approach as a theoretical framework to inform how the QoE is formulated; second, it applies the conceptual logic behind the development of synthetic indicators based on the capability approach, such as the HDI, to the subject of employment; third, it adapts the AF method used by Sehnbruch et al. (Citation2020) to the case of a single country, Chile. It thus examines the development of simultaneous QoE deprivations over time, across regions and across other subgroups in the labour force.
The results answer the research questions presented in the introduction: first, a synthetic indicator is useful in showing how the QoE changes over time and across regions. It shows that despite converging, some Chilean regions have improved much more than others. Second, this paper highlights which factors have most contributed to these results. Important differences between regions with similar indicators are highlighted, such as Antofagasta and O’Higgins (both with an M0 of 0.19) but due to improvements in different QoE dimensions (employment conditions in Antofagasta and income levels in O’Higgins).
The hypothesis that varying rates of regional economic growth together with regional and individual characteristics have contributed to these different levels of QoE deprivation is then examined. shows that the impact of economic growth has not been significant on QoE outcomes. Regression analysis confirms this result although it does show that higher unemployment rates increase QoE deprivation, along with a higher proportion of the labour force employed in very small firms. Conversely, higher education and urbanization levels decrease QoE deprivation. The impact of further regional characteristics is less clear and lead to an analysis of the characteristics of individual workers. These results show that women are more likely to be QoE deprived as are agricultural workers and those employed in smaller businesses. By contrast, more educated workers and those who are heads of households are less likely to be QoE deprived.
However, the most important contribution of this paper relates to how these results can inform policymakers: first, they permit the identification of the most vulnerable workers in a regional labour market, which is an essential to targeting public policies such as employment subsidies to their needs (Sehnbruch, Citation2013).
Second, by incorporating indicators such as occupational status, tenure, and working hours in this measure, the QoE index draws attention to those variables not usually considered by traditional measures of labour market functioning. It shows that wages and hours worked have improved principally due to regulatory changes implemented at the national level, in particular the steady but significant increase of minimum wages. This has not only contributed to improving QoE deprivation levels across regions, but also to their convergence. However, the results also show that policy issues such as formalizing employment relationships, encouraging pension contributions and improving job stability have been neglected.
To summarize, this QoE deprivation index offers new insights into the subject of job quality. By demonstrating what this multidimensional measure can accomplish, it should foster the development of further national and regional indicators of this type in other Latin American countries, and help refocus policy debates that are still frequently stuck on traditional employment variables such as the unemployment rate or wage levels in countries where these indicators are meaningless.
Finally, this paper points to important future research: first, this QoE index can be used to track workers’ employment trajectories using either panel or administrative data. This would allow analysts to understand whether and to what extent workers become trapped in poor quality jobs, and which policies could support them. Second, with administrative data, a more precise analysis could be undertaken that compares specific regions or localities with each other. This could even target active labour market policies to specific local communities. Third, the sample sizes of household surveys are not large enough to focus on specific economic sectors. Qualitative research could provide key insights into why similar regions have developed differently, especially between and within industries.
Looking to the future, it is important to consider how this index can be used in times of economic crisis, significantly increasing numbers of intraregional migration, and the irruption of the gig economy in developing countries. There is a risk that all three challenges will focus policy attention on the quantity of jobs created while the quality of these jobs is relegated to the backburner. This paper shows, however, that this would be a mistake. Indicators of job quality should be closely monitored in conjunction with the quantity of jobs as the development of these two aspects may diverge significantly.
Supplemental Material
Download PDF (520.1 KB)DISCLOSURE STATEMENT
No potential conflict of interest was reported by the authors.
Additional information
Funding
Notes
1. This is the case for all measures that use the European Working Conditions Survey. Similar limitations apply to the European Union Statistics on Income and Living Conditions (EU-SILC) (Verma et al., Citation2017; Goedemé, Citation2013). The European Union Labour Force Survey (EU-LFS) can be used to produce subnational regional indicators of employment (Betti et al., Citation2012; Eurostat, Citation2020), but includes fewer variables relevant to QoE deprivation.
2. This paper is replicated by González et al. (Citation202Citation1) for six Central American countries.
3. Until 2007, there were 13 regions in Chile. Between 2007 and 2017, several regions were split into two, bringing the total number of regions to 17. In this paper, all indicators were calculated as though there had always been 13 regions in Chile as the data would otherwise not be comparable over time. This should not impact the results of the analysis, however, as the regions that were divided into two are similar in terms of their characteristics and productive structures.
4. The terms ‘decent work’, ‘quality of jobs’, ‘quality of work’ and ‘quality of employment’ are used almost interchangeably in the academic and policymaking literature (Burchell et al., Citation2014).
5. Bustillo et al. (Citation2011), Burchell et al. (Citation2014), the Taylor Review (2017) and Piasna et al. (Citation2019) discuss these conceptual confusions in detail.
6. Bustillo et al. (Citation2011) summarized all the job quality indices found in the academic and institutional literature, which was subsequently updated by Burchell et al. (Citation2014) and Piasna et al. (Citation2019).
7. This report was commissioned and paid for by the European Commission given the difficulties in producing a manageable definition and measure of job quality. For a discussion of these complex political dynamic, see Piasna et al. (Citation2019).
8. Data on physical risks, work autonomy, job prospects, unionization and collective bargaining or vocational training are rarely available from a single source in developing countries and are never available for cross-country comparisons.
9. See Leßmann (Citation2012), Huneeus et al. (Citation2015) and Soffia (Citation2018) for other discussions of labour markets and the capability approach.
10. See Paredes et al. (Citation2014) on wage differentials in Chile; Blanchard and Katz (Citation1992) and Krugman (Citation1993) on the United States; Green (Citation1999) on unemployment and non-employment in Europe; Martin and Tyler (Citation2000) on the United States and Europe; and Sheamur and Polese (2007) on Canada.
11. For example, see Akyelken (Citation2013) on Turkey; and Kumar and Pattanaik (Citation2020) and Tamvada (Citation2015) on India.
12. Each wave uses a complex sampling design organized in several stages. The design is first stratified and organized by conglomerates at the regional and district levels. Random census tracts are then selected, and a systematic selection is performed in each one. Each official dataset provides information about each step and identifies all primary sample units, conglomerates and weights. Standard errors were computed in STATA 14 following the protocols defined by the Chilean Ministry of Social Development.
13. The CASEN survey is also representative of urban and rural areas, but not at the municipal level (with some exceptions).
14. This paper follows Alkire and Foster (Citation2011), who first measured multidimensional poverty across a large number of countries, and then produced several applications of this approach using specific case studies, for example, India and its regional disparities (Alkire & Seth, Citation2015).
15. A simple average of the number of dependants per worker in the seven countries studied here is 1.25.
16. Other potential cut-off lines, such as relative income as used in Europe (60% of median income) or minimum wages, were also considered in the context of this index. However, the former option was discarded as it generated misleading results due to the high levels of income inequality in Chile and the latter was ruled out as the minimum wage is subject to political and not objective criteria. The data analysed below show that the minimum wage was set at a level below six basic food baskets for much of the period studied in this paper.
17. Unemployment risk as used by some methodologies (e.g., OECD, Citation2014) cannot be calculated with Chilean household data as there are no consistent longitudinal data.
18. For details of the relationship between job tenure, contracts and the duration of unemployment, see Sehnbruch et al. (Citation2019).
19. Differences in costs of living between regions are not considered by the survey. If these diverge, then convergence might be overestimated. The study is correlational and therefore does not allow causal relationships to be extracted.
20. For the before and after distribution of working hours pre and post the enactment of the law regulating working hours, see Figure A2 in Appendix A in the supplemental data online.
21. For kernel density distribution plots on real monthly wages and minimum wages for 1996, 2006 and 2017, see Figure A3 in Appendix A in the supplemental data online.
REFERENCES
- Akyelken, N. (2013). Infrastructure Development and Employment: The Case of Turkey. Regional Studies, 49 (8).
- Alkire, S., & Foster, J. (2011). Counting and multidimensional poverty measurement. Journal of Public Economics, 95 (7–8).
- Alkire, S., & Santos, M. E. (2014). Measuring Acute Poverty in the Developing World: Robustness and Scope of the Multidimensional Poverty Index. World Development, 59, 251–274.
- Alkire, S., Roche, J. M., Ballon, P., Foster, J., Santos, M. E., & Seth, S. (2015). Multidimensional poverty measurement and analysis. Oxford University Press, USA.
- Alkire, S. & Seth, S. (2015). Multidimensional Poverty Reduction in India between 1999 and 2006: Where and How? World Development, Vol. 72: 93–108.
- Anand, S., & Sen, A. (1997). Concepts or human development and poverty! A multidimensional perspective. United Nations Development Programme, Poverty and human development: Human development papers, 1–20.
- Anker, R., Chernyshev, I., Egger, P., Mehran, F. & Ritter, J. (2003). Measuring Decent Work with Statistical Indicators. In SSRN
- Aroca, P. (2009). Desigualdades regionales en Chile. Foreign Affairs Latinoamérica, 9(1), 53–62.
- Aroca, P., Azzoni, C., & Sarrias, M. (2018). Regional concentration and national economic growth in Brazil and Chile. Letters in Spatial and Resource Sciences, 11(3), 343–359.
- Arranz, J. M., García-Serrano, C., & Hernanz, V. (2019). Job quality differences among younger and older workers in Europe: The role of institutions. Social Science Research, 84 (January), 102345.
- Atkinson, A. B. (2003). Multidimensional deprivation: contrasting social welfare and counting approaches. Journal of Economic Inequality, 1(1), 51–65.
- Barro, Robert J., and Xavier Sala-i-Martin. 1992. Convergence. Journal of Political Economy 100(2): 223–251.
- Berdegué, J. A., & Soloaga, I. (2018). Small and medium cities and development of Mexican rural areas. World Development, 107, 277–288.
- Betti, G., Gagliardi, F., Lemmi, A., & Verma, V. (2012). Subnational indicators of poverty and deprivation in Europe: Methodology and applications. Cambridge Journal of Regions, Economy and Society, 5(1), 129–147.
- Blanchard, O. J., & Katz, L. F. (1992). Regional evolutions. Brookings Papers on Economic Activity, 1992(1), 1–75.
- Bourguignon, F. (2015). Appraising income inequality databases in Latin America. Journal of Economic Inequality, 13(4), 557–578.
- Burchell, B., Sehnbruch, K., Piasna, A., & Agloni, N. (2014). The quality of employment and decent work: Definitions, Methodologies, and ongoing debates. Cambridge Journal of Economics, 38(2), 459–477.
- Busso, M., Cristia, J. P., Hincapie, D., Messina, J., & Ripani, L. (2017). Learning Better: public policy for skills development. Inter-American Development Bank.
- Bustillo, R. M., Fernández-Macías, E., Antón, J. I., & Esteve, F. (2011). Measuring more than money: The social economics of job quality. Edward Elgar Publishing.
- Cazes, S. and Verick, S. (eds.). 2013. Perspectives on Labour Economics for Development. Geneva: ILO
- Di Caro, P., & Nicotra, G. (2015). Short, Long and Spatial Dynamics of Informal Employment. Regional Studies, 50(11), 1804–1818.
- Di Cataldo, M., & Rodríguez-Pose, A. (2017). What drives employment growth and social inclusion in the regions of the European Union? Regional Studies, 51(12), 1840–1859.
- Duranton, G., & Puga, D. (2003). Micro-Foundations of Urban Agglomeration Economies. In Handbook of regional and urban economics (Vol. 4, pp. 2063–2217).
- Eurostat. (2020). Statistical Regions in the European Union and Partner Countries. European Union.
- Fernández de Córdova, G., Fernández-Maldonado, A. M., & del Pozo, J. M. (2016). Recent changes in the patterns of socio-spatial segregation in Metropolitan Lima. Habitat International, 54, 28–39.
- Ghai, D. (2003). Decent work: Concept and indicators. Int'l Lab. Rev., 142, 113.
- Goedemé, T. (2013). How much Confidence can we have in EU-SILC? Social Indicators Research, 110(1), 89–110.
- González, P., Sehnbruch, K., Apablaza. M., Méndez Pineda, R., & Arriagada, V. (2021). A Multidimensional Approach to Measuring Quality of Employment (QoE) Deprivation in six Central American Countries. Social Indicators Research, Vol. 158(1): 1–22
- Goos, M., & Manning, A. (2007). Lousy and Lovely Jobs: The Rising Polarization of Work in Britain The Review of Economics and Statistics, 89(1), 118–133.
- Gornick, J. & Meyers, M. (2003) Families that Work: Policies for Reconciling Parenthood and Employment. Russell Sage Foundation.
- Green, D. A. (1999). Immigrant occupational attainment: Assimilation and mobility over time. Journal of Labor Economics, 17(1), 49–79.
- Green, F., & Mostafa, T. (2012). Trends in job quality in Europe. Eurofound.
- Green, A. E., & Livanos, I. (2015). Involuntary Non-Standard Employment and the Economic Crisis: Regional Insights from the UK. Regional Studies, 49(7), 1223–1235.
- Green, F. (2021) Decent Work and the Quality of Work and Employment. In: Zimmermann K. F. (eds) Handbook of Labor, Human Resources and Population Economics. Springer.
- Hipp, et al., 2015 institutions and the prevalence of non-standard employment. Socioeconomic Review, Vol. 13, No 2, 351–377.
- Huneeus, F., O. Landerretche, E. Puentes & J. Selman (2015) A multidimensional employment quality index for Brazil, 2002–11. International Labour Review, Vol. 154 (2).
- Iglesias Fernández, C., Llorente Heras, R., & Dueñas Fernández, D. (2011). Calidad del empleo y satisfacción laboral en las regiones españolas. Investigaciones Regionales, 19, 25–49.
- Inter-American Development Bank. (2017) Better jobs index: An employment conditions index for Latin America (Technical Note No. IDB-TN-1326). Inter-American Development Bank.
- International Labour Organization (ILO). (1999). Report of the Director-General: Decent Work. International Labour Conference, Geneva. International Labour Office.
- Jones, P. S., & Green, A. E. (2009). The quantity and quality of jobs: Changes in UK regions, 1997–2007. Environment and Planning A, 41(10), 2474–2495.
- Kovacevic, M., & Calderon, M. C. (2014). UNDP’s multidimensional poverty index: 2014 specifications. UNDP Human Development Report Office Occasional Paper.
- Krugman, P., & Lawrence, R. (1993). Trade, Jobs, and Wages. National Bureau of Economic Research, 119–173
- Kumar, S., & Pattanaik, F. (2020). Regional Disparities in Employment Intensity of Indian Industries. Emerging Economy Studies, 6(1), 23–38.
- Leschke, J., & Watt, A. (2014). Challenges in constructing a multi-dimensional European job quality index. Social indicators research, 118(1), 1–31.
- Leßmann, O. (2012). Applying the Capability Approach Empirically: An Overview with Special Attention to Labor. Management Revue, 23(2), 98–118.
- Lugo, M. A. (2007). Employment: A proposal for internationally comparable indicators. Oxford Development Studies, 35(4), 361–378.
- Martin, R., & Tyler, P. (2000). Regional employment evolutions in the European union: A preliminary analysis. Regional Studies, 34(7), 601–616.
- McCollum, D. (2013). Precarious Transitions and Labour Market Disadvantage: Using Longitudinal Data to Explain the Nature of Work–Welfare Cycling. Regional Studies, 47(10), 1752–1765.
- Munoz de Bustillo, R., Fernandez-Macias, E., Esteve, F., & Anton, J.-I. (2011). E pluribus unum? A critical survey of job quality indicators. Socio-Economic Review, 9(3), 447–475.
- Organisation for Economic Co-operation and Development (OECD). (2014). OECD Employment Outlook 2014. OECD Publ.
- Organisation for Economic Co-operation and Development (OECD). (2015). OECD Employment Outlook 2015. OECD Publ.
- Organisation for Economic Co-operation and Development (OECD). (2018). OECD Regions and Cities at a Glance 2018. OECD Publ.
- Paredes, D., Iturra, V., & Lufin, M. (2014). A Spatial Decomposition of Income Inequality in Chile. Regional Studies.
- Parro, F., & Reyes, L. (2017). The rise and fall of income inequality in Chile. Latin American Economic Review, 26(1), 3.
- Piasna, A., Burchell, B., & Sehnbruch, K. (2019). Job quality in European employment policy: one step forward, two steps back? Transfer, 25(2), 165–180.
- Prieto, J. & Sehnbruch, K. (2022). The Dynamics of Job Quality in Chile, LSE forthcoming Working Paper.
- Quintana, L., Salas, C., Duarte, C., & Correa-Quezada, R. (2020). Regional inequality and labour precariousness: An empirical regional analysis for Brazil, Mexico and Ecuador. Regional Science Policy and Practice, 12(1), 61–81.
- Rofman, R., & Carranza, E. (2005). Social security coverage in Latin America. Social Protection, World Bank.
- Royuela, V., & García, G. A. (2015). Economic and Social Convergence in Colombia. Regional Studies, 49(2), 219–239.
- Sehnbruch, K. (2006). The Chilean labor market: A key to understanding Latin American labor markets. Springer.
- Sehnbruch, K. (2013) ‘The Labour Market under the Concertacion’, in K. Sehnbruch and P. Siavelis (eds) Democratic Chile: The Politics and Policies of a Historic Coalition, 1990– 2010, pp. 263–80. Boulder, CO: Lynne Rienner Publishing
- Sehnbruch, K., Carranza, R. & Prieto, J. (2019). The Political Economy of Unemployment Insurance based on Individual Savings Accounts: Lessons from Chile. Development and Change, Vol. 50(4): 948–975
- Sehnbruch, K., González, P., Apablaza, M., Méndez, R., & Arriagada, V. (2020). The Quality of Employment (QoE) in nine Latin American countries: A multidimensional perspective. World Development, 127.
- Sen, A. (1975). Employment, Technology and Development. Oxford: Clarendon press.
- Sen, A. (1999). Development as Freedom. Oxford University Press.
- Sen, A. (2009). The idea of justice. Harvard University Press.
- Soffia, M. (2018). Scope and limitations of a capability-based measure of job quality in Central America. October, 271.
- Spurgeon, A., & Cooper, C. L. (2000). Working time, health and performance. International Review of Industrial and Organizational Psychology, 15, 189–222.
- Tamvada, J. P. (2015). The Spatial Distribution of Self-Employment in India: Evidence from Semiparametric Geoadditive Models. Regional Studies, 49(2), 300–322.
- Taylor, M. (2017). Good work: The Taylor review of modern working practices (p. 116). UK Government.
- Veneri, P., & Murtin, F. (2019). Where are the highest living standards? Measuring well-being and inclusiveness in OECD regions. Regional Studies, 53(5), 657–666.
- Verma, V., Lemmi, A., Betti, G., Gagliardi, F., & Piacentini, M. (2017). How precise are poverty measures estimated at the regional level? Regional Science and Urban Economics, 66(July), 175–184.
- Volpe Martincus, C., Carballo, J., & Cusolito, A. (2017). Roads, exports and employment: Evidence from a developing country. Journal of Development Economics, 125(October 2016), 21–39.