
 ?Mathematical formulae have been encoded as MathML and are displayed in this HTML version using MathJax in order to improve their display. Uncheck the box to turn MathJax off. This feature requires Javascript. Click on a formula to zoom.
ABSTRACT
As regions evolve, their economies become more complex, and they tend to diversify into related activities. Although there is a bright side to this diversification process in terms of economic development, there may also be a dark side to it, as it possibly contributes to regional inequalities. The paper uses data on industries and patents to analyse the diversification patterns of 283 regions in 32 European countries over the past 15 years. We find that only the most economically advanced regions have the opportunity to diversify into highly complex activities. These regions tend to focus on related high-complex activities, while lagging regions focus on related low-complex activities, creating a spatial inequality feedback loop. This pattern creates a wicked problem for innovation policy: the strategy needed to improve the innovativeness of the European knowledge system might disproportionately benefit regions that are already developed and foster disparities.
1. INTRODUCTION
Since Schumpeter (Citation1942), scholars have argued that one of the key drivers of economic development is innovation and structural change. Regions have to innovate and develop new activities to compensate for the processes of decline and lock-in. However, scholars have also raised concerns that innovation may not always deliver in terms of reducing income disparities across regions and – what has been labelled as one of the key societal challenges – social inequality (Lee, Citation2019; Piketty, Citation2014). In fact, there are reasons to believe that innovation might even contribute to the regional divergence of income levels in Europe (Iammarino et al., Citation2019). For instance, innovation may disproportionately benefit higher income regions, because they are well-endowed with features that are beneficial for innovation, such as human capital, diversity of activities, the best knowledge infrastructures, connections to centres of excellence elsewhere, etc. (Feldman, Citation1994).
This dark side to the geography of innovation is not at all a new story (Lee, Citation2011, Citation2016; Lee & Rodríguez-Pose, Citation2013). However, what is still missing in this narrative as well as in research on regional inequality in Europe are recent findings on related diversification and economic complexity (Boschma, Citation2017; Hidalgo et al., Citation2018). These new approaches have not been fully considered and may have the potential to shed new light on this crucial debate on regional inequality. This body of literature argues that territories tend to diversify into new activities that are close to what they have been doing in the past (Hidalgo et al., Citation2007). In this regard, geography scholars have built on evolutionary concepts such as cumulative, collective and localized learning (Antonelli, Citation1995; Boschma & Lambooy, Citation1999; Camagni, Citation1991; Dosi et al., Citation1988; Maskell & Malmberg, Citation1999; Storper, Citation1997) to argue that regions diversify into new activities related to existing activities in regions (Neffke et al., Citation2011). There is a large body of studies showing that this principle of relatedness indeed holds when explaining the entry of new technologies (Boschma et al., Citation2015; Colombelli et al., Citation2014; Rigby, Citation2015), new products (Boschma et al., Citation2013), and new occupations (Muneepeerakul et al., Citation2013) in regions.
However, this literature has been rather silent on how it affects the economic development of regions (Kogler, Citation2017) and the evolution of regional inequality in particular (Hartmann et al., Citation2017). There is some evidence that the most complex activities tend to concentrate in the richest cities, at least in the United States, and that this correlates positively with their long-run economic performance (Balland et al., Citation2020; Balland & Rigby, Citation2017). Pintar and Scherngell (Citation2020) showed for 193 metropolitan regions in Europe that knowledge complexity in a region has a positive effect on gross regional product (GRP) growth. Mewes and Broekel (Citation2020) demonstrated a similar positive effect of technological complexity on gross domestic product (GDP) per capita in 159 NUTS-2 regions in Europe. Antonelli et al. (Citation2020) showed for European regions that the complexity of the knowledge stock in a region enhances knowledge production and innovation but negatively affects regional productivity. Balland et al. (Citation2019) showed that regions in Europe tend to diversify less in complex activities unless they build on related capabilities in the region. Rigby et al. (Citation2022) showed that GDP growth and employment growth have been higher in cities in Europe that diversified into more related and more complex technologies in the period 1981–2015. Hidalgo and Hausmann (Citation2009) and Hausmann et al. (Citation2014) showed that the complexity of economies is positively correlated with GDP levels of countries, while Hartmann et al. (Citation2017) showed that the complexity of economies is negatively correlated with income inequality at the country level. Morais et al. (Citation2021) found an inverted-‘U’-shaped relationship at the regional level in Brazil. Overall, this could imply that high-income regions have a greater ability to develop new activities that are more complex, and that this potentially will also bring greater economic benefits to regions that are already the most advanced. This spatial polarization of complex activities might be even stronger on the regional than the national level, due to spatial agglomeration effects, including face-to-face interaction, tacit knowledge, and relatively free movements of labour within Europe. However, systematic empirical evidence is still lacking for European regions. Providing evidence for this would shed new light on the dark side of innovation in terms of regional inequality and provide an additional explanation for the spatial divergence process in Europe in the last decades (Iammarino et al., Citation2019).
The main objective of this paper is to address this gap in the literature. We conduct an empirical analysis of 274 NUTS-2 regions and investigate their opportunities to diversify into more complex technologies and more complex industries, and how relatedness affects these diversification opportunities in the case of high-, medium- and low-income regions in Europe. Our findings show that there is a general tendency for high-income and high-complex regions to focus on related high-complex activities, and for low-income and low-complex regions to rely on related low-complex activities when diversifying. This implies that income disparities across regions in Europe are more likely to be reinforced, not reduced, due to innovation and diversification processes.
The structure of the paper is as follows. Next, we provide a brief literature review. We then introduce the data on patents and industries. We present the main empirical findings regarding the diversification opportunities of regions in terms of new technologies (patents) and new industries, and discuss them in terms of regional inequalities. We discuss the policy implications. Last, we conclude and discuss future research avenues.
2. LITERATURE REVIEW
There is a long tradition in development economics to discuss structural factors, economic externalities and cumulative effects leading to economic disparities across countries. Myrdal (Citation1957) argued that the free play of market forces tends to promote regional inequalities, because backwash effects, such as externalities of infrastructure for commerce, capital movement, and the selective migration of young and educated towards economically more developed regions, outweigh potential spread effects, for example, via remittances and diffusion of technologies. Kuznets (Citation1955) and Hirschman (Citation1958) argued while there might be a tendency towards polarization at initial stages of industrialization and economic growth, eventually counterbalancing forces and knowledge diffusion would ‘lift all boats’ and lead to convergence processes. However, these seminal contributions on convergence/divergence paid little attention to innovation processes in general and to the nature of the innovation process in particular.
The geography of innovation literature often argues that innovation processes tend to agglomerate in space (Asheim & Gertler, Citation2005; Audretsch & Feldman, Citation1996; Autant-Bernard et al., Citation2007). Knowledge spillovers do not easily travel across space but are geographically bounded and spatially concentrated (Jaffe et al., Citation1993). High-income regions are perceived to have specific features that promote innovation, such as human capital, a variety of economic activities, and a rich knowledge infrastructure (Feldman, Citation1994). Core regions act as hubs in research networks that provide access to centres of excellence, which tend to reinforce the uneven spatial distribution of innovation (Maggioni et al., Citation2007; Moreno et al., Citation2005). Following evolutionary thinking in economics (Nelson & Winter, Citation1982), there is a tendency for regions to accumulate knowledge and specialize over time, as knowledge diffusion is often limited across space (Boschma & Lambooy, Citation1999). The focus of these approaches is on the nature of the innovation process, stressing its cumulative, localized and path-dependent features (Dosi, Citation1982; Dosi et al., Citation1988). This place-dependent nature of innovation has been conceptualized in territorial notions, such as innovative milieu (Camagni, Citation1991) and regional innovation systems (Cooke, Citation2001).
More recently, the idea of the path-dependent nature of innovation has been applied in the regional diversification literature. Yet instead of providing a rationale for technological specialization of regions, this path-dependent nature of innovation has been used to explain how regions renew themselves, and how they create new technological specializations and develop new growth paths over time. This body of research in evolutionary economic geography has been stimulated by the development of new concepts and methods (e.g., proximity, product space, relatedness measures and complexity measures) as well as the availability of longitudinal data sets that allowed for a better empirical understanding of diversification processes (Boschma, Citation2017). Numerous studies show that regions build and draw on existing capabilities when diversifying into new activities, as embodied in new products (Boschma et al., Citation2013; Hidalgo et al., Citation2007; Neffke et al., Citation2011), new technologies (Colombelli et al., Citation2014; Rigby, Citation2015), new jobs (Farinha Fernandes et al., Citation2019; Muneepeerakul et al., Citation2013) and new scientific fields (Guevara et al., Citation2016).
Now, the big question is whether this diversification process is more likely to happen in high- or low-income regions, and if it is more likely to contribute to widening or decreasing income disparities across regions. Hidalgo et al. (Citation2007) suggested that high-income countries with a great diversity of activities have a better potential to make new combinations and diversify into (related) activities than low-income countries with a narrow knowledge base. This could provide an alternative explanation for why rich countries stay rich, and poor countries stay poor. It is important to note that this has not yet been thoroughly investigated, especially at the regional level (Kogler, Citation2017). However, there is some scattered evidence. Cortinovis et al. (Citation2017) found a positive effect of population density, but no significant effect or sometimes even a negative effect of GRP on regional diversification. Balland and Boschma (Citation2021) found evidence that less developed regions in Europe (with a GRP per capita lower than 90% of the European average) have a lower rate of diversification into new technologies. Xiao et al. (Citation2018) found that regions with a high GRP or population density do not have a higher rate of diversification in new industries.
However, the type of new activities that are being created in regions is also of crucial importance. Research on economic complexity literature (Balland et al., Citation2022; Hidalgo, Citation2021; Hidalgo & Hausmann, Citation2009) has argued that regions should move into more complex activities, as these activities would bring greater economic benefits to a region. Complex activities build on and combine a wide range of capabilities that are difficult to develop and also hard to copy. Therefore, complex activities provide a competitive economic advantage to a region that will last for some time when they can build locally on all the required capabilities. Technologies that are simple to learn can be diffused more easily, so they have a relatively lower economic value, while complex technologies that are more difficult to replicate do not diffuse easily and therefore provide a potential for regional competitive advantage (Fleming & Sorenson, Citation2001). In consequence, complex activities will be more geographically concentrated and show less ubiquity. This tends to be confirmed by studies (Balland et al., Citation2020; Balland & Rigby, Citation2017; Mewes & Broekel, Citation2020) showing that more complex activities concentrate more strongly in large cities with a high density of activities, which increases the need for geographical proximity and makes this type of knowledge more sticky and spatially immobile. Van der Wouden (Citation2020) showed that more complex knowledge more often depends on local collaborations while less complex knowledge relies on local collaborations to a lesser extent.
Yet to what extent do the complexity levels of cities reflect their economic performance? Studies (Antonelli et al., Citation2017; Balland et al., Citation2020; Balland & Rigby, Citation2017) show that the complexity level of cities positively correlates with their long-run economic performance. Antonelli et al. (Citation2020) showed that knowledge complexity enhances knowledge generation and innovation but harms productivity in regions. Mewes and Broekel (Citation2020) and Pintar and Scherngell (Citation2020) showed that knowledge complexity has a positive effect on GRP growth in European regions. Balland et al. (Citation2019) showed that regions in Europe diversify less in complex activities unless they build on related capabilities in the region. Rigby et al. (Citation2022) showed this paid off economically speaking; GDP growth and employment growth were shown to be higher in cities in Europe that diversified into more related and more complex technologies.
But which regions have a greater potential to develop more complex activities and sustain higher economic performance as a consequence? To what extent do high-income regions diversify into activities with higher economic returns? When high-income regions have a better ability to develop new activities that are more complex, and have a greater potential to bring greater economic benefits, it could contribute to regional divergence, and it would reveal the dark side of innovation in terms of contributing to an increase of interregional inequality in Europe. At the national level, there is some evidence that poor countries often seem to be trapped into low complex activities, having difficulties in overcoming structural constraints and climbing the economic ladder (Hartmann et al., Citation2016, Citation2020; Petralia et al., Citation2017). At the same time, rich countries with many capabilities experience large returns – in terms of increased diversification – to the accumulation of additional capabilities and gravitate towards more complex and valued-added activities (Hartmann et al., Citation2020; Hidalgo & Hausmann, Citation2009; Pinheiro et al., Citation2021). Systematic empirical evidence is still lacking on the regional level. Filling this gap is important, though, as spatial agglomeration effects can lead to an even stronger polarization on the regional level than on the national level.
This paper makes use of large datasets on patents and industries to scrutinize to which extent regions across Europe differ in their closeness to more complex or simple activities. We observe that low-income regions across Europe tend to be close to simple technologies and industries, while high-income regions tend to be close to complex technologies and industries. These structural differences can cement or increase economic inequalities and polarization processes across regions in Europe, and show how innovation may indeed reveal a dark side.
3. DATA
We make use of two large datasets on patents and industries to determine which European regions are close to more complex or simple activities. Using patent data, we study the ability of regions to develop new technologies. However, patent data might bias the results towards high-income regions, as patent activity in low-income regions is generally low. Therefore, we also use industry data (which have no bias towards high-income regions) and run the same type of analyses to see whether findings will also hold for regional diversification in new industries.
Following studies on regional diversification (e.g., Balland et al., Citation2019), we use data on published patent applications from the Organisation for Economic Co-operation and Development’s (OECD) REGPAT to study technological diversification and complexity of European regions. According to the address of inventors, we assign patents from 36 technology classes (aggregations of six-digit Cooperative Patent Classification (CPC) groups) to 285 European NUTS-2 regions. Regions include all EU-27 countries, the UK as well as the four European Free Trade Association (EFTA) countries (Iceland, Liechtenstein, Norway and Switzerland). Since the dataset reports the number of published patents per year in a region, it is prone to temporal noise and outliers that can lead to overestimations and large temporal fluctuations in the complexity indicators. To control for these two factors, we applied a three-year moving average (sliding window) to smoothen the dataset. To control for outliers, we subsequently discarded regions that produced less than 50 patents on average per year between 2009 and 2011. Moreover, to prevent revealed comparative advantages based on very small absolute numbers of patents, we apply a minimum threshold of at least 10 patents in a patent class, to consider that a region is active and has potential strengths in this activity. The dataset on technological complexity includes 206 NUTS-2 regions.
We measure industrial diversification and complexity of 283 NUTS-2 European regions using data from Eurostat on employment numbers, which is reported and compiled by the Structural Business Statistics (SBS) from the Statistical Office of the European Union. We focus on employment numbers among 65 industry classes (two-digit NACE, Rev. 2).Footnote1 Regions include all current EU-27 countries, the UK plus the EFTA countries of Norway, Iceland and Liechtenstein.
The above two datasets on regional activities were complemented with data on GDP per capita (purchasing power standards – PPS) and population density for NUTS-2 European regions obtained from Eurostat.
4. COMPLEXITY OF ACTIVITIES AND COMPLEXITY OF REGIONS
We follow methods of Hidalgo and Hausmann (Citation2009) to measure the knowledge complexity of technologies and industries. Their method of reflection considers not only the diversity of activities present in a region (diversity), but also how many other regions can produce these activities in a competitive manner (ubiquity). This captures the idea that many regions can produce simple technologies, goods and services, but only a few regions can engage in complex technologies (such as aerospace) and industries (such as medical equipment) that require capabilities in a large variety of associated activities.
Following previous works (e.g., Balland et al., Citation2019), we use the concept of revealed comparative advantage (RCA) to identify which activities (industries or technologies) are present in which regions. The RCA is defined as:
(1)
(1) where
is a rectangular matrix that summarizes the intensity of an activity (e.g., number of patents or employment) in a region. A region
is considered to have an RCA in activity
when
.
Based on the matrix of revealed comparative advantages , we compute the economic complexity index (ECI) and the product complexity index (PCI) as indicators of the technological and economic capabilities of regions and the knowledge intensity of activities respectively. The ECI is computed as the average knowledge intensity of activities present in a region (i.e., the average PCI of its activities). Conversely, we compute the knowledge intensity of an activity/product (PCI) as the average knowledge intensity of the regions that have comparative advantages in these activities. This circular argument gives rise to the following iterative mapping:
(2a)
(2a)
(2b)
(2b)
Replacing (2b) into (2a) leads to an eigenvalue equation whose solution is the economic complexity index (ECI) of a region:
(3)
(3) where
stands for the diversity of a region, that is, the number of activities present in a region. In the rest of the manuscript, we refer to the regional complexity indicators (ECI) estimated for each dataset as the technological complexity index (RTCI) and industrial complexity index (RICI). While the ECI offers a measure of the embedded knowledge in a region, the PCI is a measure of the knowledge intensity of an activity. Like its counterpart, it can be computed by solving the following eigenvalue equation:
(4)
(4)
In the remaining, we refer to the complexity of technologies (TCI) and of industries (ICI) instead of PCI, which refer to the estimated complexity of activities stemming from the two different datasets.
5. RELATEDNESS DENSITY
Relatedness density has been shown to be a relevant factor in determining the likelihood of a region to enter a new activity (Hidalgo et al., Citation2018; Neffke et al., Citation2011). We follow Hidalgo et al. (Citation2007) and estimate relatedness/proximity () between two activities by means of minimum conditional probability that a region has RCA in two industries/technologies at the same time. The relatedness/proximity between activities j and k are estimated as:
(5)
(5) where
measures the ubiquity of an activity and is equal to the number of regions that have an
(
) in such activity.
From the definition of relatedness, we can conveniently measure relatedness density, , as the relatedness of an activity, j, to the overall region’s i portfolio of activities.
(6)
(6)
6. CLOSENESS OF REGIONS TO COMPLEX PRODUCTS
A defining characteristic that shapes a region’s ability to diversify their industrial or technological structures is its proximity to either complex or simple activities. The possible diversification gains and feasibility are captured by the measures of complexity and relatedness density respectively, and these measures define a region’s strategic space for development. Moving into a more complex activity can increase the average complexity of a region. However, this is arguably easier to achieve if the region has a high density of comparative advantages in related activities (i.e., related density) (Balland et al., Citation2019).
Quantifying the relationship between relatedness and complexity is useful in assessing the potential development opportunities and constraints each region faces (Hartmann et al., Citation2020; Pinheiro et al., Citation2021). To that end, we compute the Pearson correlation coefficient, , between complexity and relatedness of activities with
in region
as:
(7)
(7) where
is the set of activities in region
with
, while
and
are their average complexity and relatedness. A positive correlation coefficient shows that these regions are close to complex products, while a negative correlation coefficient shows that regions are close to simple products. No correlation indicates that the respective region is not mainly close to complex or simple products.
7. RESULTS
The main findings are presented as follows. First, we present the complexity levels of technologies (36 in total) and industries (65 in total). Second, we show maps of Europe with regard to the average complexity scores of regions, both for technologies and industries. Third, we map the correlation between complexity and relatedness density for all potential new technologies and industries in all regions (with a current ). This analysis reveals what are the constraints and opportunities of regions to move into more complex technologies and industries. This correlation will be linked to the income levels of regions (GRP per capita), their economic complexity levels, the population density of regions, and whether regions belong to old or new membership states in the EU. This will indicate whether potential new entries are more likely to increase regional disparities or not. Doing so, we go beyond the conventional GRP per capita and take up other regional disparity dimensions, such as the complexity of regional economies, the urban–rural dimension, and institutional membership (comparing regions in EU-12 versus EU-15 countries). Finally, we look at actual entries of new activities and investigate what is the average complexity of actual entries (new technologies and new industries) in regions with varying GDP, technological and industrial complexity, and population density levels during the period 2011–15. This would give strong indications of whether actual entries may contribute to increasing regional disparities.
7.1. Distribution of complexity
The method of reflection algorithm helps to estimate the complexity of technologies and industries () and map the technological (RTCI) and industrial (RICI) complexity of European regions (). The results indicate that few regions are able to achieve comparative technological and industrial advantages in activities such as information and communication technologies. In contrast, a relatively large number of regions in Europe show comparative technological and industrial advantages in various types of manufacturing industries.
Table 1. Top five and bottom five activities by complexity in 2015 for technologies and industries.
Table 2. Top five and bottom five regions in terms of technological and industrial complexity.
and present the regions in Europe regarding their opportunities to develop complex activities in which they are not yet specialized (RCA < 1). The maps show for technologies () and industries () the average complexity of the most related activities (the top three most related activities) that are not yet developed in the region for 2015. These are the activities that are most likely to enter the region as new specializations because they are most related to existing activities in the region. The shade of grey encodes the complexity of activities. The lighter shades are associated with lower complexity levels, while the darker shades are associated with high complexity values. Thus, and provides information on the likelihood of regions to move in more simple or more complex activities. NUTS-2 regions for which data are not available or show low activity intensity are white.
Figure 1. Average complexity of the three most related technologies available for development (revealed comparative advantage (RCA) < 1) in regions in Europe in 2015.
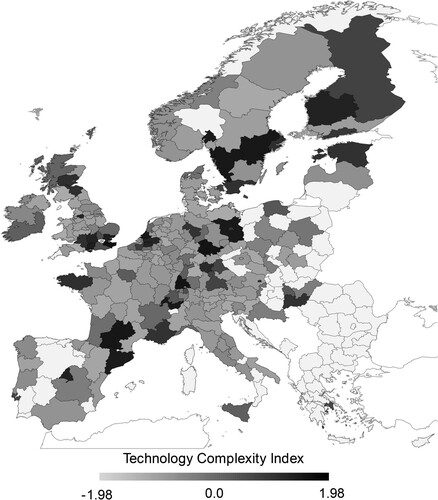
and show there are huge differences between regions in Europe regarding their opportunities to develop complex technologies for which they do not have comparative advantages yet. Some regions in south Sweden, southern Germany, south-eastern France, south-eastern UK, the Netherlands, Estonia and Finland do have good opportunities to develop complex technologies. In contrast, regions in Spain (with the exception of Madrid and Catalonia), Italy, Norway (excluding the Oslo region), Denmark (with the exception of the Copenhagen region), north-western Germany and Eastern Europe show potential to diversify in new technologies that are less complex.
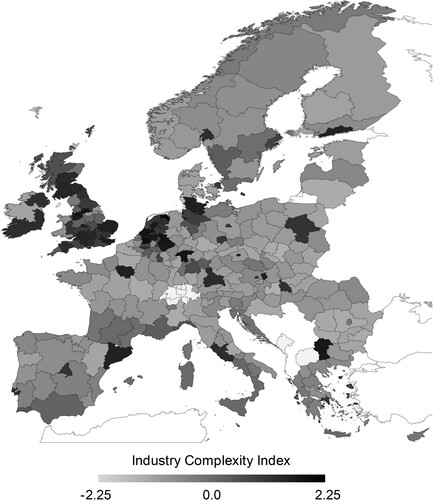
shows diversification opportunities of regions in Europe in terms of new industries. Note that many more regions can now be included in the analysis. Again, we observe large differences between regions with respect to their opportunities to diversify into more complex activities, but there are differences in terms of opportunities for industrial diversification in comparison to technological diversification. Many regions in the Netherlands and the UK seem to have potential to develop more complex industries, as well some regions in Germany (such as in the former industrial heartland in the Ruhr area) and capital regions such as Copenhagen, Stockholm, Oslo, Warsaw, Ile-de-France, Madrid and Lazio. In contrast, the rest of Europe shows diversification opportunities merely in low complex industries.
Figure 2. Average complexity of the three most related industries available for development (revealed comparative advantage (RCA) < 1) in regions in Europe in 2015.
7.2. Diversification opportunities of regions
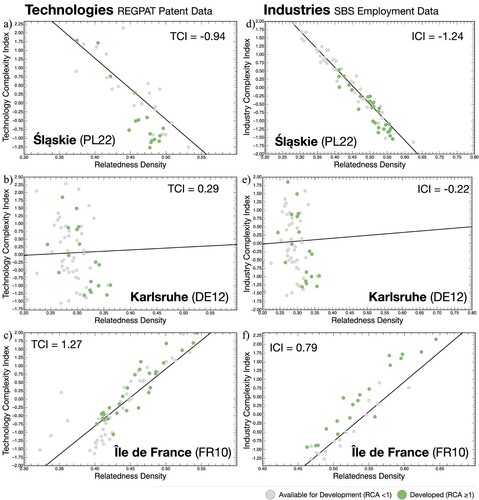
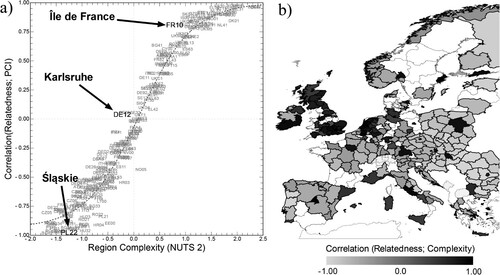
Measures of relatedness and complexity help to reveal and compare the future diversification opportunities of regions in Europe. Studies have confirmed that regions are more likely to move into related activities that require similar technological and productive capabilities that regions already master (Boschma, Citation2017; Hidalgo et al., Citation2018). In this article, we show how differences in the relatedness density of European regions to either more complex or simple activities depict unequal branching opportunities of regions. In , we present three examples of regions (Slaskie, Karlsruhe and Ile-de-France) with respect to their relationship between the relatedness density (x-axis) and complexity (y-axis). It compares to what extent the three regions are close to complex or simple technologies and industries. The left panels show the outcomes for technologies, while the right panels show the outcomes for industries. Each point corresponds to an activity. Darker points indicate activities for which a region has RCA > 1, while grey points indicate activities with RCA < 1. The line shows the best ordinary least squares (OLS) linear model fit for the grey points. We map the correlation between complexity and relatedness density for all potential new technologies and industries for each of the regions (with a current ). The results indicate that the highly developed region of Ile-de-France is mainly close to complex activities, whereas the old industrial region of Slaskie in Poland is closer to simple activities. The German region of Karlsruhe shows low correlation between relatedness density and complexity: it is not mainly close to complex activities or to simple activities.
Figure 3. Relationship between relatedness density and complexity for all technologies (a–c) and industries (d–f) in three regions.
and show the correlation between relatedness density and the complexity of technologies (4) and industries (5) with RCA < 1 for European NUTS-2 regions as a function of the complexity of the region (ECI) in 2015. a and a show the relationship between the complexity of activities in NUTS-2 regions and their average closeness to complex activities (i.e., the correlation ) for both technologies and industries. b and b illustrate the spatial distribution of the closeness of regions to complexity of activities across Europe. The technological/industrial structure of regions with darker shades tend to be close to complex activities, while regions in lighter grey shades tend to be close to simple activities. Regions with statistically significant correlations have thick black borders, regions with non-significant correlations have thin borders, while regions in white represent regions with missing data or low activity intensity. An ‘S’-shaped curve association between the level of complexity and the closeness to new complex activities can be observed for both the patent data (a) and the industry data (a).
Figure 4. Correlation between relatedness density and complexity of technologies with a revealed comparative advantage (RCA) < 1 for European NUTS-2 regions as a function of the regional technological complexity index of regions (RTCI) in 2015.
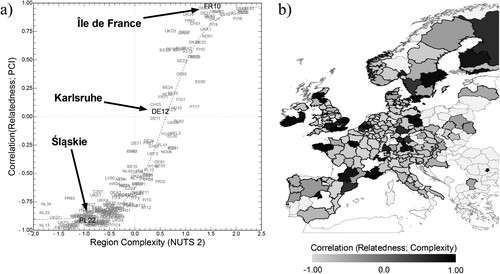
Figure 5. Correlation between relatedness density and complexity of industries with a revealed comparative advantage (RCA) < 1 for European NUTS-2 regions as a function of the regional industrial complexity index of regions (RICI) in 2015.
The non-linear relationship suggests that regions go through different phases of economic development. While initially an increase in levels of diversity and complexity of the activity portfolio may not go along with a significant increase in the closeness to complex diversification opportunities, further increase in economic complexity at an intermediate stage of development is associated with moving significantly closer to more complex activities. High levels of complexity tend to gravitate toward other complex activities. We observe that relatively few regions are located at the intermediate stage of this transformation process, rather than at stages that are either being close to complex or simple products. As shown in research on the national level (Hartmann et al., Citation2020; Pinheiro et al., Citation2021), it appears that development at the regional level is not a linear, additive continuum between less and more developed stages of development. Instead, it can rather be characterized by two extreme stages of development – one characterized by regions of low complexity that are closer to simple activities, and a second one with high complexity regions that are closer to complex activities – as well as a sharp ladder connecting both stages. This implies a certain gravitation toward being either a highly developed or a less developed region, with fewer cases and less stability for intermediate levels of development. Moreover, the ‘S’-shaped curve shows that in order to move up the ladder of development, regions might need to undergo a deeper transformative process – a catching-up and leapfrogging effort that may require smart industrial policies (Hartmann et al., Citation2020).
In other words, these results point out that a region’s ability to enter complex activities is conditioned by its level of complexity. More complex regions may benefit from self-reinforcing regional capability accumulation due to their proximity to complex activities. Conversely, simple regions may suffer from a quiescence trap/lack of capabilities accumulation based on their large distance to complex activities and closeness to simple activities. This is a pattern that is likely to promote and entrench regional inequality.
7.3. Diversification dynamics
But is the above-described pattern reflected in the observed differences in the regional diversification dynamics? To answer this question, we next compare the complexity of new activities entered by each region with low, medium, or high initial levels of GDP per capita, technological and industrial complexity, and population density between 2011 and 2015. We also compare the regions from the longer term EU-15 member countries with the EU-12 enlargement countries. Low, medium and high initial levels were measured by splitting the countries in three equally sized quantiles in each year.
To that end, we consider that a region, , entered a new activity,
, if it had a low
in year
and then was able to develop to a
in year
(with
). This means that a region had little or no presence in the respective activity in the base year, but then managed to achieve revealed comparative advantages in this activity the following year. In line with previous works on economic complexity (Bahar et al., Citation2014), we chose a relatively large difference between a low threshold value of 0.25 at the beginning and a relatively high RCA > 1 for the next time period to minimize a false identification of diversification activities. These steps have been done for each year from 2011 to 2015.
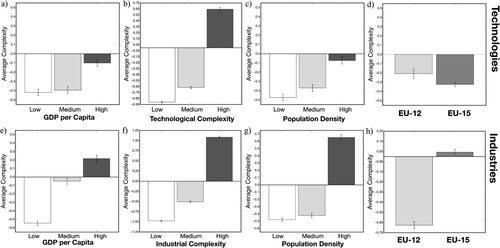
compares the average complexity of new activities of regions that started with low (white), medium (light grey) and high (dark grey) levels of GDP per capita (a, e), regional complexity indicators (b, f) and population density (c, g). Moreover, we also compare the average complexity of new activities of regions from the EU-15 (dark grey) versus the EU-12 (light grey) (d, h). The top row shows results for technologies, while the bottom row shows results for industries. GDP per capita, economic complexity and population groups have been estimated annually and by dividing the regions into three quantiles. The error bars indicate the standard errors.
Figure 6. Average complexity of newly entered activities by regions grouped per gross domestic product (GDP) per capita (a, e), complexity index (b, f) and population density (c, g); and between the EU-12 and EU-15 countries (d, h).
We find that regions in the group of high initial GDP per capita, complexity and population density consistently have been able to enter higher complexity activities when compared with regions starting from low and medium levels. These results provide evidence that developed regions tend to move into more complex activities than less developed regions, leading to persistent, self-reinforcing levels of regional inequality. While developed regions tend to move even further to more complex activities, regions that rely on simple activities and are lagging behind tend to diversify into simple activities.Footnote2 We have done the same type of analyses for three types of regions that are distinguished in Cohesion Policy in EU: (1) ‘less developed’ regions (regions with a GDP per capita < 75% of the EU average), (2) ‘transition’ regions (GDP per capita between 75% and 90%), and (3) ‘developed’ regions. We find the same results, which are reported in Figure A3 in Appendix A in the supplemental data online.
As a robustness check, we changed the minimum RCA requirement for a region entering an activity. We test for different values of T the distribution of events in which regions developed capabilities in an industry/technology from an RCA < 0.25 to an RCA > T, with T between 1 and 4. We have included these results in the Appendices in the supplemental data online. The results remained the same.
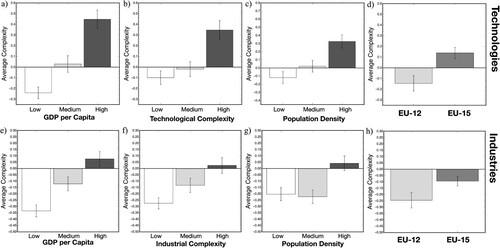
extends the above exercise to potential entries, besides actual entries shown in . In that sense, we inspect the average complexity of potential entries by regions at different levels of GDP, complexity and population density. We identify potential entries as the three most related activities with RCA < 1, which are the most feasible activities to undergo development (Hidalgo et al., Citation2018). These results set a frame of the most natural development directions, which further shows the differences in opportunities between the most/least developed regions. For instance, shows that the average complexity of potential entries is higher for high-income regions than for low-income regions.
Figure 7. Average complexity of potential new activities entries by regions grouped per gross domestic product (GDP) per capita (a, e), complexity index (b, f) and population density (c, g); and between the EU-12 and EU-15 countries (d, h).
In sum, these results raise questions regarding the agglomeration of complex activities in regions that already exhibit high levels of development, indicating the potential for the existence of self-reinforcing dynamics that lead to systemic gaps between regions.
8. DISCUSSION AND CONCLUSIONS
The main objective of the paper is to determine whether diversification patterns in regions in Europe are more likely to increase rather than decrease income disparities across regions. We investigated both potential and actual entries in new and complex technologies and industries in regions in Europe. First, we looked at potential entries and examined the extent to which regions across Europe differ in their closeness to more complex or simple activities, showing the opportunity space of each region to diversify into more complex technologies and more complex industries. We found that low-income and low-complexity regions across Europe tend to be close to simpler technologies and industries, while high-income and high-complexity regions tend to be close to more complex technologies and industries. This provided a first indication of how diversification can cement or increase economic inequalities and polarization processes across regions in Europe. Second, we investigated actual entries and examined what is the average complexity of new technologies and new industries that entered regions during the period 2011–15. We found a general pattern in which core regions of Europe with a high GDP, a high complexity, and a high population density are more capable of entering more high-complexity activities, while regions in Europe that are lagging behind rely more on low-complex activities when diversifying. This provided a second indication that income disparities across regions in Europe are more likely to be reinforced, not reduced, due to diversification processes. Low-income regions tend to diversify into simpler technologies and industries, while high-income regions tend to diversify into more complex technologies and industries.
This paper can be seen as a step to develop a more balanced view in which bright and dark sides of innovations are analysed in combination. However, much additional work needs to be undertaken in this respect. First, we have not investigated whether regions in Europe have succeeded to make jumps and have managed to escape development traps, and if so, how they were able to achieve this. This is a crucial question that would shed light on how to overcome lock-ins and development traps in Europe.
Second, we have only looked at the creative side of innovation (as embodied in potential and actual entries of new activities), but not at its destructive side (Aghion, Citation2002; Mendez, Citation2002; Schumpeter, Citation1942). There is some evidence that the bright side of innovation, creating new activities, concentrates in other regions than where the dark side of innovation is doing its destructive work (Boschma, Citation2021). For instance, the United States has witnessed in the last decades the rise of the Sunbelt states (which previously were not part of the highest-income regions) alongside the decline of the Rustbelt states that belonged previously to the top-income regions of the United States (Hall & Preston, Citation1988). Current debates on possible regional effects of digitalization focus on the question whether regions that experience job creation due to automation are different from the regions where jobs are at risk (Farinha Fernandes et al., Citation2019; Muro et al., Citation2019).
Third, we investigated whether complexity in regions affects the nature of the diversification process, but we did not look at the effects on productivity. Studies have shown that knowledge complexity might hamper productivity, because it might be more difficult to exploit and apply it in production processes in regions (Antonelli et al., Citation2020; Balland & Rigby, Citation2017; Ferrarini & Scaramozzino, Citation2016). This productivity dimension has to be accounted for when assessing the impacts of complexity on interregional inequalities.
Fourth, the role of regional institutions needs to be addressed more fully in research on innovation and inequalities. In this respect, literatures on geography of innovation and evolutionary economic geography could be more closely linked to political and institutional approaches that focus on issues of unevenness and inequalities (MacKinnon et al., Citation2019; Phelps et al., Citation2018; Sheppard, Citation2016).
Fifth, we investigated regional capabilities but did not account for interregional linkages. However, access to relevant capabilities in order to develop new activities can also be exploited through linkages with other regions that provide complementary linkages. Balland and Boschma (Citation2021) have shown that this is actually very relevant for both core and peripheral regions to diversify into new technologies.
Sixth, our study has implications for spatial inequalities but we did not investigate empirically the relationship between the intensity and nature of diversification processes in regions and the actual evolution of spatial inequality in Europe in terms of interregional income disparities.
Seventh, many studies on innovation and spatial inequality have looked at intra-regional inequality. They primarily used patent data and observed a positive relationship (Breau et al., Citation2014; Lee, Citation2011, Citation2016). It remains to be seen whether this is also true for the relationship between regional diversification and intra-regional inequality, especially when making a distinction between diversification in complex and simple activities, and examining diversification in new industries rather than new technologies.
Finally, what we might expect, and what studies (Balland & Rigby, Citation2017; Mewes & Broekel, Citation2020) have observed, is that complex activities tend to concentrate in fewer places. This may induce negative effects on local societies in terms of social inequality (crowding out of low-income people due to higher housing costs) and environmental concerns (such as pollution and health issues). This calls for research that investigates the social and environmental effects of complexity at the regional scale, which would enhance our understanding of the dark side of the geography of innovation.
Our research has also important policy implications. Our findings tend to suggest that the nature of the diversification process in Europe is disproportionately benefitting regions that are already advanced. This is not necessarily a bad thing. It might actually be very good that some complex activities (such as artificial intelligence – AI) are spatially concentrated in Europe because this is likely to promote technological leadership that enables Europe to compete globally with the United States and China. At the same time, there is a major policy challenge to promote innovation and diversification in peripheral regions, to tackle spatial inequality. Peripheral regions have to search for and explore opportunities to diversify into new activities that are related to local activities, preferably in new activities that would lift the overall complexity of their regional economies. But also policy that would encourage the development of less complex activities that build on existing local capabilities could already make a difference in these peripheral settings (Balland et al., Citation2019). The creation of new jobs in such less complex activities and the upgrading of existing activities (making them more complex) could shift economic fortunes of peripheral regions. Also here, related diversification is not a natural process but it needs to be activated and promoted by public policy, as there might be serious bottlenecks in peripheral regions that block related diversification, such as a lack of finance, low education, lack of entrepreneurial culture, missing regulations, corruption, etc. What is an even more challenging task for public policy is to ensure that peripheral regions can evolve out of their low complexity trap (Rodríguez-Pose & Wilkie, Citation2019), especially when this requires peripheral regions to make jumps in the more unknown, as our findings tend to suggest. One way to accomplish this is to develop the local knowledge and education infrastructure in such a way that it can upgrade the local economy and help the region move into more complex activities. Another way is to establish linkages with other regions (Balland & Boschma, Citation2021; Grillitsch & Nilsson, Citation2015; Miguelez & Moreno, Citation2018; Trippl et al., Citation2018), through the mobility of skilled migrants (Caviggioli et al., Citation2020), attracting external firms (Neffke et al., Citation2018), and establishing new research collaborations (De Noni et al., Citation2018; Uhlbach et al., Citation2017; Uyarra et al., Citation2018) because research has shown these help regions to diversify in less related activities. Finally, improving institutional governance in peripheral regions is crucial as well (Trippl et al., Citation2019), as these regions are often characterized by a low quality of government and the presence of bonding social capital that negatively impact on the diversification opportunities in peripheral regions in Europe (Cortinovis et al., Citation2017).
Supplemental Material
Download PDF (1.3 MB)DISCLOSURE STATEMENT
No potential conflict of interest was reported by the authors.
Additional information
Funding
Notes
1. We excluded industries such as travel agency, rental and leasing activities, and accommodation as they are overrepresented in lagging regions.
2. As a robustness check, we repeated the same analyses using patents classified at the four-digit between 1990 and 2017. We discarded regions with low patent production to avoid regions having inflated complexity estimates. In this, we discarded all regions with fewer than 75 annual patents in 2011 as a reference for such filtering, which left a total of 204 out of the 284 NUTS-2 (2013) regions. We obtained similar results.
REFERENCES
- Aghion, P. (2002). Schumpeterian growth theory and the dynamics of income inequality. Econometrica, 70(3), 855–882. https://doi.org/10.1111/1468-0262.00312
- Antonelli, C. (1995). The economics of localized technological change and industrial dynamics. Kluwer.
- Antonelli, C., Crespi, F., Mongeau Ospina, C., & Scellato, G. (2017). Knowledge composition, Jacobs externalities and innovation performance in European regions. Regional Studies, 51(11), 1708–1720. https://doi.org/10.1080/00343404.2016.1217405
- Antonelli, C., Crespi, F., & Quatraro, F. (2020). Knowledge complexity and the mechanisms of knowledge generation and exploitation: The European evidence. Research Policy, https://doi.org/10.1016/j.respol.2020.104081
- Asheim, B. T., & Gertler, M. (2005). The geography of innovation: Regional innovation systems. In J. Fagerberg, D. Mowery, & R. Nelson (Eds.), The Oxford handbook of innovation (pp. 291–317). Oxford University Press.
- Audretsch, D. B., & Feldman, M. (1996). Spillovers and the geography of innovation and production. American Economic Review, 86(3), 630–640. http://www.jstor.org/stable/2118216
- Autant-Bernard, C., Billand, P., Frachisse, P., & Massard, N. (2007). Social distance versus spatial distance in R&D cooperation: Empirical evidence from European collaboration choices in micro and nanotechnologies. Papers in Regional Science, 86(3), 495–519. https://doi.org/10.1111/j.1435-5957.2007.00132.x
- Bahar, D., Hausmann, R., & Hidalgo, C. A. (2014). Neighbors and the evolution of the comparative advantage of nations: Evidence of international knowledge diffusion? Journal of International Economics, 92(1), 111–123. https://doi.org/10.1016/j.jinteco.2013.11.001
- Balland, P. A., & Boschma, R. (2021). Complementary interregional linkages and smart specialisation: An empirical study on European regions. Regional Studies, 55(6), 1059–1070. https://doi.org/10.1080/00343404.2020.1861240
- Balland, P. A., Boschma, R., Crespo, J., & Rigby, D. (2019). Smart specialization policy in the European union: Relatedness, knowledge complexity and regional diversification. Regional Studies, 53(9), 1252–1268. https://doi.org/10.1080/00343404.2018.1437900
- Balland, P. A., Broekel, T., Diodato, D., Giuliani, E., Hausmann, R., O’Clery, N., & Rigby, D. (2022). The new paradigm of economic complexity. Research Policy, 51(3), 1–11. https://doi.org/10.1016/j.respol.2021.104450
- Balland, P. A., Jara-Figueroa, C., Petralia, S. G., Steijn, M. P. A., Rigby, D. L., & Hidalgo, C. (2020). Complex economic activities concentrate in large cities. Nature Human Behaviour, 4(3), 248–254. https://doi.org/10.1038/s41562-019-0803-3
- Balland, P. A., & Rigby, D. (2017). The geography of complex knowledge. Economic Geography, 93(1), 1–23. https://doi.org/10.1080/00130095.2016.1205947
- Boschma, R. (2017). Relatedness as driver of regional diversification: A research agenda. Regional Studies, 51(3), 351–364. https://doi.org/10.1080/00343404.2016.1254767
- Boschma, R. (2021). The geographical dimension of structural change. In N. Foster-McGregor, L. Alcorta, A. Szirmai, & B. Verspagen (Eds.), New perspectives on structural change (pp. 172–187). Oxford University Press.
- Boschma, R. A., Balland, P. A., & Kogler, D. F. (2015). Relatedness and technological change in cities: The rise and fall of technological knowledge in U.S. metropolitan areas from 1981 to 2010. Industrial and Corporate Change, 24(1), 223–250. https://doi.org/10.1093/icc/dtu012
- Boschma, R. A., & Lambooy, J. G. (1999). Evolutionary economics and economic geography. Journal of Evolutionary Economics, 9(4), 411–429. https://doi.org/10.1007/s001910050089
- Boschma, R., Minondo, A., & Navarro, M. (2013). The emergence of new industries at the regional level in Spain: A proximity approach based on product-relatedness. Economic Geography, 89(1), 29–51. https://doi.org/10.1111/j.1944-8287.2012.01170.x
- Breau, S., Kogler, D. F., & Bolton, K. (2014). On the relationship between innovation and wage inequality: New evidence from Canadian cities. Economic Geography, 90(4), 351–373. https://doi.org/10.1111/ecge.12056
- Camagni, R. (Ed.). (1991). Innovation networks: Spatial perspectives. Belhaven-Pinter.
- Caviggioli, F., Jensen, P., & Scellato, G. (2020). Highly skilled migrants and technological diversification in the US and Europe. Technological Forecasting and Social Change, 154. https://doi.org/10.1016/j.techfore.2020.119951
- Colombelli, A., Krafft, J., & Quatraro, F. (2014). The emergence of new technology-based sectors in European regions: A proximity-based analysis of nanotechnology. Research Policy, 43(10), 1681–1696. https://doi.org/10.1016/j.respol.2014.07.008
- Cooke, P. (2001). Regional innovation systems, clusters, and the knowledge economy. Industrial and Corporate Change, 10(4), 945–974. https://doi.org/10.1093/icc/10.4.945
- Cortinovis, N., Xiao, J., Boschma, R., & van Oort, F. (2017). Quality of government and social capital as drivers of regional diversification in Europe. Journal of Economic Geography, 17(6), 1179–1208. https://doi.org/10.1093/jeg/lbx001
- De Noni, I., Orsi, L., & Belussi, F. (2018). The role of collaborative networks in supporting the innovation performances of lagging behind European regions. Research Policy, 47(1), 1–13. https://doi.org/10.1016/j.respol.2017.09.006
- Dosi, G. (1982). Technological paradigms and technological trajectories: A suggested interpretation of the determinants and directions of technical change. Research Policy, 11(3), 147–162. https://doi.org/10.1016/0048-7333(82)90016-6
- Dosi, G., Freeman, C., Nelson, R., Silverberg, G., & Soete, L. (Eds.). (1988). Technical change and economic theory. Pinter.
- Farinha Fernandes, T., Balland, P., Morrison, A., & Boschma, R. (2019). What drives the geography of jobs in the US? Unpacking relatedness. Industry and Innovation, 26(9), 988–1022. https://doi.org/10.1080/13662716.2019.1591940
- Feldman, M. P. (1994). The geography of innovation. Kluwer.
- Ferrarini, B., & Scaramozzino, P. (2016). Production complexity, adaptability and economic growth. Structural Change and Economic Dynamics, 37, 52–61. https://doi.org/10.1016/j.strueco.2015.12.001
- Fleming, L., & Sorenson, O. (2001). Technology as a complex adaptive system: Evidence from patent data. Research Policy, 30(7), 1019–1039. https://doi.org/10.1016/S0048-7333(00)00135-9
- Grillitsch, M., & Nilsson, M. (2015). Innovation in peripheral regions: Do collaborations compensate for a lack of local knowledge spillovers? The Annals of Regional Science, 54(1), 299–321. https://doi.org/10.1007/s00168-014-0655-8
- Guevara, M. R., Hartmann, D., Aristarán, M., Mendoza, M., & Hidalgo, C. A. (2016). The research space: Using career paths to predict the evolution of the research output of individuals, institutions, and nations. Scientometrics, 109(3), 1695–1709. https://doi.org/10.1007/s11192-016-2125-9
- Hall, P., & Preston, P. (1988). The carrier wave: New information technology and the geography of innovation 1846–2003. Unwin Hyman.
- Hartmann, D., Bezerra, M., Lodolo, B., & Pinheiro, F. L. (2020). International trade, development traps, and the core–periphery structure of income inequality. EconomiA, 21(2), 255–278. https://doi.org/10.1016/j.econ.2019.09.001
- Hartmann, D., Guevara, M. R., Jara-Figueroa, C., Aristaran, M., & Hildalgo, C. A. (2017). Linking economic complexity, institutions, and income inequality. World Development, 93, 75–93. https://doi.org/10.1016/j.worlddev.2016.12.020
- Hartmann, D., Jara-Figueroa, C., Guevara, M., Simoes, A., & Hidalgo, C. A. (2016). The structural constraints of income inequality in Latin America. Integration & Trade Journal, 40, 70–85.
- Hausmann, R., Hidalgo, C. A., Bustos, S., Coscia, M., Simoes, A., & Yildirim, M. A. (2014). The atlas of economic complexity: Mapping paths to prosperity. The MIT Press.
- Hidalgo, C. A. (2021). Economic complexity theory and applications. Nature Reviews Physics, 3(2), 92–113. https://doi.org/10.1038/s42254-020-00275-1
- Hidalgo, C. A., Balland, P. A., Boschma, R., Delgado, M., Feldman, M., Frenken, K., Glaeser, E., He, C., Kogler, D., Morrison, A., Neffke, F., Rigby, D., Stern, S., Zheng, S., & Zhu, S. (2018, July 22–27). The principle of relatedness. In Springer proceedings in complexity (pp. 451–457). Springer. Paper originally presented at the International Conference on Complex Systems (ICCS), Cambridge, MA, USA.
- Hidalgo, C. A., & Hausmann, R. (2009). The building blocks of economic complexity. Proceedings of the National Academy of Sciences, 106(26), 10570–10575. https://doi.org/10.1073/pnas.0900943106
- Hidalgo, C. A., Klinger, B., Barabasi, A. L., & Hausmann, R. (2007). The product space conditions the development of nations. Science, 317(5837), 482–487. https://doi.org/10.1126/science.1144581
- Hirschman, A. O. (1958). The strategy of economic development (Vol. 10). Yale University Press.
- Iammarino, S., Rodriguez-Pose, A., & Storper, M. (2019). Regional inequality in Europe: Evidence, theory and policy implications. Journal of Economic Geography, 19(2), 273–298. https://doi.org/10.1093/jeg/lby021
- Jaffe, A., Trajtenberg, M., & Henderson, R. (1993). Geographic localization of knowledge spillovers as evidenced by patent citations. Quarterly Journal of Economics, 108(3), 577–598. https://doi.org/10.2307/2118401
- Kogler, D. F. (2017). Relatedness as driver of regional diversification: A research agenda – a commentary. Regional Studies, 51(3), 365–369. https://doi.org/10.1080/00343404.2016.1276282
- Kuznets, S. (1955). Economic growth and income inequality. The American Economic Review, 45(1), 1–28. https://www.jstor.org/stable/1811581
- Lee, N. (2011). Are innovative regions more unequal? Evidence from Europe. Environment and Planning C: Government and Policy, 29(1), 2–23. https://doi.org/10.1068/c1046r
- Lee, N. (2016). Growth with inequality? The local consequences of innovation and creativity. In R. Shearmur, C. Carrincazeaux, & D. Doloreux (Eds.), Handbook on the geographies of innovation (pp. 419–431). Edward Elgar.
- Lee, N. (2019). Inclusive growth in cities: A sympathetic critique. Regional Studies, 53(3), 424–434. https://doi.org/10.1080/00343404.2018.1476753
- Lee, N., & Rodríguez-Pose, A. (2013). Innovation and spatial inequality in Europe and USA. Journal of Economic Geography, 13(1), 1–22. https://doi.org/10.1093/jeg/lbs022
- MacKinnon, D., Dawley, S., Pike, A., & Cumbers, A. (2019). Rethinking path creation: A geographical political economy approach. Economic Geography, 95(2), 113–135. https://doi.org/10.1080/00130095.2018.1498294
- Maggioni, M. A., Nosvelli, M., & Uberti, T. E. (2007). Space versus networks in the geography of innovation: A European analysis. Papers in Regional Science, 86(3), 471–493. https://doi.org/10.1111/j.1435-5957.2007.00130.x
- Maskell, P., & Malmberg, A. (1999). The competitiveness of firms and regions: ‘Ubiquitification’ and the importance of localized learning. European Urban and Regional Studies, 6(1), 9–25. https://doi.org/10.1177/096977649900600102
- Mendez, R. (2002). Creative destruction and the rise of inequality. Journal of Economic Growth, 7(3), 259–281. https://doi.org/10.1023/A:1020158115979
- Mewes, L., & Broekel, T. (2020). Technological complexity and economic growth of regions. Research Policy, https://doi.org/10.1016/j.respol.2020.104156
- Miguelez, E., & Moreno, R. (2018). Relatedness, external linkages and regional innovation in Europe. Regional Studies, 52(5), 688–701. https://doi.org/10.1080/00343404.2017.1360478
- Morais, M. B., Swart, J., & Jordaan, J. A. (2021). Economic complexity and inequality: Does regional productive structure affect income inequality in Brazilian states? Sustainability, 13(2), 1006. https://doi.org/10.3390/su13021006
- Moreno, R., Paci, R., & Usai, S. (2005). Geographical and sectoral clusters of innovation in Europe. The Annals of Regional Science, 39(4), 715–739. https://doi.org/10.1007/s00168-005-0021-y
- Muneepeerakul, R., Lobo, J., Shutters, S. T., Gomez-Lievano, A., & Qubbaj, M. R. (2013). Urban economies and occupation space: Can they get ‘there’ from ‘here’? PLoS ONE, 8(9), e73676. https://doi.org/10.1371/journal.pone.0073676
- Muro, M., Maxim, R., & Whiton, J. (2019). Automation and artificial intelligence: How machines are affecting people and places, Metropolitan Policy Program. Brookings.
- Myrdal, G. (1957). Economic theory and underdeveloped regions. Duckworth.
- Neffke, F., Hartog, M., Boschma, R. A., & Henning, M. (2018). Agents of structural change: The role of firms and entrepreneurs in regional diversification. Economic Geography, 94(1), 23–48. https://doi.org/10.1080/00130095.2017.1391691
- Neffke, F., Henning, M., & Boschma, R. A. (2011). How do regions diversify over time? Industry relatedness and the development of new growth paths in regions. Economic Geography, 87(3), 237–265. https://doi.org/10.1111/j.1944-8287.2011.01121.x
- Nelson, R. R., & Winter, S. G. (1982). An evolutionary theory of economic change. Harvard University Press.
- Petralia, S., Balland, P.-A., & Morrison, A. (2017). Climbing the ladder of technological development. Research Policy, 46(5), 956–969. https://doi.org/10.1016/j.respol.2017.03.012
- Phelps, N. A., Atienza, M., & Arias, M. (2018). An invitation to the dark side of economic geography. Environment and Planning A: Economy and Space, 50(1), 236–244. https://doi.org/10.1177/0308518X17739007
- Piketty, T. (2014). Capital in the twenty-first century. Belknap Press.
- Pinheiro, F. L., Hartmann, D., Boschma, R., & Hidalgo, C. A. (2021). The time and frequency of unrelated diversification. Research Policy, https://doi.org/10.1016/j.respol.2021.104323
- Pintar, N., & Scherngell, T. (2020). The complex nature of regional knowledge production: Evidence on European regions. Research Policy, https://doi.org/10.1016/j.respol.2020.104170
- Rigby, D. (2015). Technological relatedness and knowledge space: Entry and exit of US cities from patent classes. Regional Studies, 49(11), 1922–1937. https://doi.org/10.1080/00343404.2013.854878
- Rigby, D. L., Roesler, C., Kogler, D., Boschma, R., & Balland, P. A. (2022). Do EU regions benefit from Smart Specialization principles? Regional Studies, 1–16. https://doi.org/10.1080/00343404.2022.2032628
- Rodríguez-Pose, A., & Wilkie, C. (2019). Innovating in less developed regions: What drives patenting in the lagging regions of Europe and North America. Growth and Change, 50(1), 4–37. https://doi.org/10.1111/grow.12280
- Schumpeter, J. A. (1942). Capitalism, socialism and democracy. Unwin.
- Sheppard, E. (2016). The limits to globalization: Disruptive geographies of capitalist development. OUP.
- Storper, M. (1997). The regional world: Territorial development in a global economy. Guilford.
- Trippl, M., Grillitsch, M., & Isaksen, A. (2018). Exogenous sources of regional industrial change: Attraction and absorption of nonlocal knowledge for new path development. Progress in Human Geography, 42(5), 687–705. https://doi.org/10.1177/0309132517700982
- Trippl, M., Zukauskaite, E., & Healy, A. (2019). Shaping smart specialization: The role of place-specific factors in advanced, intermediate and less-developed European regions. Regional Studies, 54(10), 1328–1340. https://doi.org/10.1080/00343404.2019.1582763
- Uhlbach, W. H., Balland, P., & Scherngell, T. (2017). R&D policy and technological trajectories of regions: Evidence from the EU framework programmes (Papers in Evolutionary Economic Geography (PEEG) No. 17.22). Utrecht University, Section Economic Geography.
- Uyarra, E., Marzocchi, C., & Sorvik, J. (2018). How outward looking is smart specialisation? Rationales, drivers and barriers. European Planning Studies, 26(12), 2344–2363. https://doi.org/10.1080/09654313.2018.1529146
- Van der Wouden, F. (2020). A history of collaboration in US invention: Changing patterns of co-invention, complexity and geography. Industrial and Corporate Change, 29(3), 599–619. https://doi.org/10.1093/icc/dtz058
- Xiao, J., Boschma, R., & Andersson, M. (2018). Resilience in the European Union: The effect of the 2008 crisis on the ability of regions in Europe to develop new industrial specializations. Industrial and Corporate Change, 27(1), 15–47. https://doi.org/10.1093/icc/dtx023