
 ?Mathematical formulae have been encoded as MathML and are displayed in this HTML version using MathJax in order to improve their display. Uncheck the box to turn MathJax off. This feature requires Javascript. Click on a formula to zoom.
ABSTRACT
Britain’s industrial strategy, preoccupied with labour productivity, projects London as a role model because of a high gross value added (GVA) to employment ratio, an approach since followed in the national ‘levelling-up’ agenda. We demonstrate that this is misplaced: it misses the subtleties of how positive agglomeration effects act and ignores how negative effects can, for distributional reasons, cause real as well as GVA-measured productivity to rise in a misleading way. We consider the implications for both London and infrastructure projects designed to reduce productivity differentials by improving connectivity with other cities, such as the ambitious but flawed High Speed 2 (HS2).
1. INTRODUCTION
Industrial policy in Britain has become preoccupied with productivity, with support for labour productivity growth currently a principal aim of government strategy. One of the most visible manifestations of this is the projection of London as a model of strong economic performance based on comparative city-level productivity. Consistent with this, the most expensive by far of the concrete policy commitments to date – which have garnered support based on a hoped-for contribution to regional development and productivity – is a major infrastructure project intended to improve transport connectivity between London and other cities and regions in Britain: the High Speed 2 (HS2) rail network programme. Focusing on productivity, and the use of London as a reference point for the associated industrial strategy, we set out a critique.
1.1. Prior context
Prior context is needed on why so much weight is now given in Britain’s industrial strategy to productivity. Before the financial crisis of 2008, the industrial policy stance was broadly horizontal in the sense that policies were conceived as parts of a package of general measures benefiting industry, or ‘business’, as a whole. Its most prominent features included a twin emphasis on infrastructures and skills (for Britain, see Driver & Martell, Citation1998; Coates, Citation2005; Coffey & Thornley, Citation2015; and Bailey et al., Citation2019a; for a general comment, see Cowling et al., Citation1999; and Aiginger & Sieber, Citation2006). After the crisis, more scope was given to vertical or sector-specific policy (meaning a more direct or discriminatory mode of engagement; Coates, Citation1996, pp. 23–24). There was general support for manufacture initially, as Britain’s financial services sector floundered, as well as a low carbon industrial strategy with a wider remit including energy; and then, with a change in government, identification of ‘strategic’ sectors – such as automotive, aerospace, pharma and biotech – for priority support (Bailey et al., Citation2019a, pp. 335–336).
However, developments since have added a new twist. Economists expect labour productivity to dip going into recessions and rebound coming out, an empirical regularity usually attributed to labour hoarding by firms which makes output more elastic than employment over the course of the cycle. But although employment quickly recovered after the recession following the 2008 crisis, labour productivity growth failed to bounce back – the so-called British ‘productivity puzzle’ (just how puzzled economists were is well conveyed by Pessoa & Van Reenen, Citation2014). Worse, it was also becoming apparent, a point driven home by the Organisation for Economic Co-operation and Development (OECD) (Citation2016) (a sophisticated statistical exercise to establish a secular trend-line after filtering out noise), that Britain was experiencing a long-term and ongoing decline in labour productivity growth. This is pointedly illustrated by the rolling average of (unfiltered) data in Martin et al. (Citation2018, p. 8).
It is this that has triggered an intense preoccupation with labour productivity growth. A new national industrial strategy was approved in 2017, in the form set out in Industrial Strategy: Building a Britain Fit for the Future (HM Government (HMG), Citation2017). Productivity was heavily emphasized as its unifying theme, with the main organizing parts of the strategy – dealing with ideas, people, infrastructure, business environment and places – designated the ‘five foundations of productivity’ (pp. 10–11). Our particular concern is with ‘place’, and a cities-focused strategy that frames London as the very model of strong economic performance based on its labour productivity and makes it a national reference point that justifies programmes including the HS2 network.
Developments since have affirmed this. In 2021, the British government announced a ‘transitioning’ of strategy to emphasize its national growth response in light of pressures on the economy from Brexit and Covid, with a stress on investments in infrastructures, skills and innovation: this was laid out in Building Back Better: Our Plan for Growth (HMG, Citation2021). This also anticipated legislation, passed several months later, committing Britain to net zero carbon emissions by 2050. Building on this, in 2022 the government published a substantial policy agenda – Levelling Up the United Kingdom (HMG, Citation2022) – aimed at tackling unequal economic development in Britain’s cities and regions. All this has subsumed, rather than displaced, the existing industrial strategy.Footnote1 Most importantly for present purposes, London’s status has again been strongly confirmed as a reference point for economic performance and high labour productivity.
1.2. The terms of critique
At a later stage we will remark on just how paradoxical it is that London’s economic reputation within Britain should be rehabilitated via industrial strategy, given that the original impetus to a shake-up of industrial policy came on the back of a financial crisis that saw that reputation plummet as a result of its prominence as a major global centre for banking and finance, including investment banking. This is why the immediate shift into increased sectoral support in the first post-2008 responses pitched towards manufacture and other production sectors. However, our main concern is with how the industrial strategy conceptualizes productivity, and how the inferences that follow are then used at a practical level to justify policy.
On the side of concept or theory, the explanation proffered for London’s high labour productivity is that it benefits exceptionally from advantages of agglomeration. On the side of the practical application of concept or theory to policy, this proposition has justified the largest of the infrastructure projects greenlighted by the government on the basis of a hoped-for contribution to Britain’s regional development and output. This is the HS2 rail network programme already mentioned, approved by Parliament with the aim of improving transport connectivity between London and other parts of Britain. There is considerable public interest in what has throughout been a highly controversial project, partly because of projected costs and uncertainties about future use-rates over a planned 120-year life, but also because of damaging environmental impacts in the construction phase. A recent partial and unexpected downscaling of Northern ambitions for the project has added to this.
In setting out a critique we focus initially on the quality of the economic reasoning that sees in London’s high labour productivity nothing but evidence of the presence of city-advantages and positive agglomeration effects. We explain why the relationship between even positive effects and the government’s favoured productivity metric is far more involved than policymakers have recognized, and why it is possible that negative agglomeration effects, resulting from cost diseconomies and inflicting damage on businesses, consumers and workers, are for their part quite capable of leading to a higher rather than a lower score on the same productivity metric. In other words, the metric used does not tell us which factors are most responsible for its value.
The implications of a failure to think sufficiently about causalities are then considered for HS2, where there is no doubt that government thinking about London and its productivity differentials with the rest of Britain played a role in pushing the project ahead against frequently vocal objections. The obvious question to ask is whether the final full review undertaken of HS2 (Oakervee, Citation2020) was persuaded by what we show to be overly simplified thinking about London’s labour productivity.
1.3. Outline
The article develops these themes in more or less consecutive order. Section 2 delves further into how Britain’s industrial-cum-cities strategy uses London, and sets out an explicit statement of the form of (and reason for) this article’s critique. Salient details about the spatial characteristics of London’s economy are given in section 3, before an alternative approach to its labour productivity is set out analytically in section 4. General criticism is next made of how London is treated as a policy role model, with suggestions for the amendment of policy thinking; after which the critique turns to HS2. These discussions are contained in section 5, before conclusions in section 6.
2. HOW LONDON PRODUCTIVITY FRAMES BRITAIN’S PLACES STRATEGY
The industrial strategy in HMG (Citation2017) makes a priority of finding policies to improve the least productive: ‘businesses, people and places whose level of productivity is well below what can be achieved’ (p. 6). Whereas ‘too many’ cities in Britain are argued to ‘underperform’, London for its part is a ‘world-leading hub’ and a ‘magnet’ for ‘international business and talent’ (pp. 18–19). The first data displayed in the chapter called ‘Places’ compare regional productivity performances, based on gross value added (GVA) per hour of work, and shows London on top (p. 218). After the storm and stress of the financial crisis years, London is thus reclaimed as a success story. The chapter references productivity in all five of its opening pages; subsequently, a section entitled ‘Foundations of productivity’ discusses people (skills), infrastructure and ideas in connection with raising productivity in Britain’s ‘places’ (pp. 216–221, 228–235). When discussing political processes in the form of city, growth and devolution deals, the stress is likewise on partnering locally to drive productivity. Taking the document as a whole, productivity is mentioned 199 times across 256 pages.
This could be summarized as productivity first, last and in the middle – and with London framed as the national exemplar of what ‘world-leading’ looks like. The 2021 plan for growth, highlighting the strong position of London, similarly argues that productivity, and differences in productivity, is fundamental (HMG, Citation2021, pp. 20–25). The subsequent levelling-up strategy published in HMG (Citation2022) follows suit, with London again the productivity leader, sitting with the South East above the average (pp. 6–7). To give the comparison, productivity in this document is mentioned 194 times.
2.1. The productivity metric and London’s score
The productivity metric deployed in each of these cases uses the gross value generated by the sale of the produce of a city or region as a proxy for its output. At industry level, GVA is the monetary value of gross receipts from sale of goods or services minus the cost of materials and services acquired from other industries. Summing across industries, and adding in an estimate for public services based on state expenditure, is the basis of how national gross domestic product (GDP) is calculated. Disaggregating by city or region therefore constitutes an attempt to make an assay into place contributions to national GDP – ‘productivity’ then being calculated in every instance by dividing through by an estimate of the relevant labour input.
This is not without its problems. When working with GVA data, price adjustments are required in order to arrive at (guess) real orders of difference or change. But in all the above it is London’s total nominal GVA, divided through by a labour input proxy, that is simply compared ‘as is’ with the same for other cities. Yet bearing this in mind, it is still useful to consider how London stands, because it is on this basis that its status within the national strategy has been secured.
To take an example from the evidence fed into the 2017 strategy, a carefully compiled and instructive study meriting close reading, Martin et al. (Citation2017) show – using a sample frame of 85 British cities for the period 1971–2014 – that London’s ratio of GVA to employment consistently outstripped Britain’s city average. The size of this gap in fact increased steadily from 1991, attributed to growth in financial and knowledge-based services which more than compensated earlier deindustrialization (by 2014, the last year in this series, manufacture had fallen to just 2.3% of total workforce jobs and to 2.6% of GVA; Girardi & Marsden, Citation2017, pp. 5–6). One interesting finding is that ‘most’ city-level variation in the ratio of GVA to employment appears attributable to within sector variations, with similar sectors performing differently in different cities (Martin et al., Citation2017, pp. 8–9). A separate, and almost contemporaneous, study from the Economics Evidence Base for London (Citation2016, pp. 14–15) finds that by the end of the same period London’s ratio for GVA over workforce jobs stood at 36.5% above the British city average. For a slightly later year, Beatty and Fothergill (Citation2019, p. 11) estimate a 41% gap for 2017. The evidence of the Regional Studies Association (RSA) (Citation2017) is broadly consistent with these figures. In the 2022 levelling-up strategy, reflecting an amended method of calculation, a somewhat lower but still sizeable gap of 31.95% is suggested for 2019 (HMG, Citation2022, p. 7).
2.2. Explaining London’s advantages
In the industrial strategy set out in HMG (Citation2017), London’s high overall rating on this metric is explained as a consequence of positive agglomeration effects: agglomeration economies are described as a ‘major driver of productivity’, albeit one which Britain’s cities, ‘outside London’, have mostly still to enjoy (p. 219). The levelling-up agenda next advanced in HMG (Citation2022) expands on this: physical, human and financial capitals, as well as intangible assets such as innovations, ideas and patents, are all identified as potentially significant advantages for London, together with scale benefits. Social capital is added to this, reflecting such things as health, security, green spaces and culture, together with good institutions and leadership (pp. 42–47). There is an aside too on the relevance of science-thinking about complex adaptive systems. The consistent conclusion advanced is that London benefits from positive interactions inside a city-agglomeration which possesses advantages across this range (pp. 48–49).
2.3. The view on distribution
In the first of these strategies productivity is quietly divorced from any concerns about how the product is distributed. HMG (Citation2017) thus emphasizes that ‘rising wages depend on growing productivity’: a graphic showing low British GDP per hour of work compared with other Western European economies tactfully omits accompanying details on how different their national wage shares look (pp. 19–21). HMG (Citation2022) does not depart from the basic proposition that pay tracks productivity (p. 8). To its credit, intra-city and intra-regional inequalities (‘disparities’) are accorded far more discussion than in the industrial strategy; and not only for pay but other socio-economic indicators. But this is accompanied by an account of spatial variations in productivity, and the solution proffered once more is to raise productivity amongst the least productive (pp. 8–28). It is acknowledged that London ‘contains significant pockets of high deprivation’, even while it receives praise overall as an ‘economic powerhouse’ (p. 27).
2.4. HS2
Amongst the concrete policies proffered as being essential to lifting productivity performance in the rest of Britain’s cities and regions, transport infrastructures have found favour from the outset: ‘We will invest more in improving transport connections … target projects that drive productivity’ (HMG, Citation2017, p. 231). Although including inter-city connectivity separate from London, by far the single most expensive and controversial component in the infrastructures programme has been HS2, a high-speed rail network linking London with England’s Midlands and North, as well as Scotland. The total capital expenditure for this project is estimated by Oakervee (Citation2020) – the final full review – at circa £80 billion, at 2015 prices. This project has forged ahead, with ongoing support from the levelling-up agenda, albeit with some recent scaling back.
2.5. The form of the critique
The critique that will be developed focuses on the chain of reasoning that begins with the proposition that a higher city score on a nominal GVA labour productivity metric necessarily reveals the positive advantages of agglomeration, and ends with support for massive investments such as HS2. We show:
A positive agglomeration effect, acting to the benefit of businesses, consumers and (or) workers, may reduce rather than raise the nominal value of a GVA productivity metric, so that what happens is an empirical question. But drawing a distinction between this and a real change, the most likely consequence of a positive static agglomeration effect could well be to depress real labour productivity when considered in conjunction with a city-economy shaped like London’s.
Further to this, we demonstrate why, in the same circumstances, a negative agglomeration effect could well act to raise not only the nominal value of the GVA productivity metric but also real labour productivity. To underline the reason we will call this a rentier productivity effect. This is because, if present, it involves income transfer from other city stakeholders to rentier interests.
From here it is a simple step to reconsider the quality of the economic case that was made for HS2, the most expensive and controversial of the infrastructure projects promoted and defended on the back of strategies to foment productivity growth – strategies which have showcased London as though it were proof of concept. Questions can be asked too of other facets of how Britain’s cities-strategy is formulated. However, before this we must first consider the rather particular attributes of the spatial economy of London, as a basis upon which to explore agglomeration effects.
3. THE LONDON SPATIAL ECONOMY
Agglomeration effects are, by any intelligible definition, rooted in the spatial characteristics of an economic system. For this reason, and as a necessary prelude, we must first consider the spatial character of London’s economy, as well as its primary orientations, which are services led. Given a service sector economy, its key elements are: a highly compacted spatial distribution of jobs and income generation; a mass commute structure; and earnings that, in recent decades, have severely lagged accommodation costs, resulting in a collapse of affordability for houses and (when not socially protected) rents. Their importance is such that we briefly reprise each.
3.1. A service sector economy with spatially compacted jobs and income generation
Following surveys by Girardi and Marsden (Citation2017) and Brown et al. (Citation2020), London’s economy can be summarized thus. It is more than 90% services based. While manufacture has almost disappeared, even more jobs have been created in finance and insurance; information and communications; real estate; and professional, scientific and technical activities, which includes management consultancy, legal work, accounting, and advertising and market research. Together these now account for more than half of GVA generated by London’s economy, although less than a third of jobs. Other services, such as arts and entertainment, have also expanded, as too services with a large public component: education, healthcare and social work. While spatial distribution is not static, shares have recently been stable (Brown et al., Citation2020, pp. 41–44) (albeit that the longer term consequences of Brexit for London have yet to be seen).
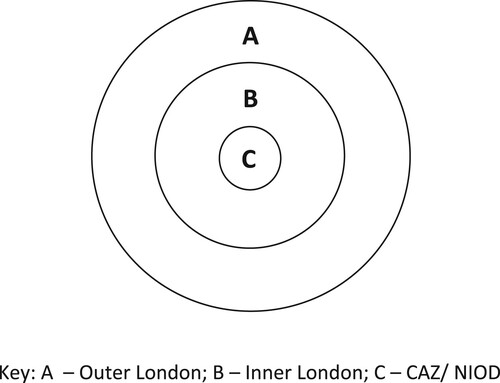
Greater London conventionally separates into Inner and Outer London: the Office of National Statistics (ONS) counts 13 local boroughs, plus the Corporation of the City of London, as Inner London, leaving 19 outer boroughs. Although a majority of the population live in Outer London, Inner London accounts for some two-thirds of the GVA generated by the city-economy, while sourcing over 60% of jobs (although note should be made here that London’s territorial-subdivisions jobs data omit the self-employed and working proprietors; Girardi & Marsden, Citation2017, p. 8). Job density and higher value-added work concentrates most in Inner London’s so-called Central Activities Zone (CAZ): this comprises the City of London and adjacent parts of 10 Inner London boroughs; and alongside this, a ‘satellite’ in the northern area of the Isle of Dogs (NIOD) (the ‘isle’ is a peninsula of the River Thames). According to figures excerpted from Brown et al. (Citation2020, pp. 22–27), finance and insurance, information and communication, and other knowledge-intensive work are heavily represented in this central core: it presently accounts for just 2.2% of London land-space and 3.0% of its households; but 23.3% of its businesses; 40.0% of workforce jobs; and 45.0% of GVA generated by London’s economy. Hence:
a majority of London-dwellers live in Outer London;
job density is greater in Inner London;
higher value-added work concentrates in Inner London; and
jobs density is greatest, and higher value-added work most concentrated in the Inner London CAZ-NIOD districts.
This radial structure for the London economy is emphasized in .
Figure 1. A radial structure.
3.2. A mass commute city-economy
Of great importance is the obvious implication for commuting patterns. For instance, a study of a representative year found ‘over 600 000 in-commuters’ commuting to work in the City of London and adjacent Westminster alone (Economics Evidence Base for London, Citation2016, p. 94). Interestingly, commutes rose steadily from 1991 (p. 103), the year in which the relative size of London’s productivity gap with Britain began to grow (if we refer back here to the study previously noted from Martin et al., Citation2017). Pressure on commuters continues (Brown et al. Citation2020, p. 12), which in the case of the land-space of the City of London now runs daily at 60 times the residency total (p. 30).
3.3. Residential property prices leading earnings growth
The median price of a residential property is highest in Inner London and rises furthest moving into the central core comprising the CAZ-NIOD districts. Based on the authors’ own calculations using the ONS data tables referenced in ONS (Citation2019), the average borough value of the nominal increase in gross fulltime-equivalent median earnings between 1997 and 2019 was 78%, 77% and 119% for Outer London, Inner London and the City of London, respectively. The corresponding increase in median house price was 463%, 539% and 607%. Taking the ratio of the medians thus calculated for annual earnings and house prices in each borough separately, and averaging across, shows that in the last of these years it required a multiple of more than 13.5 times the earnings figure to acquire a house in Outer London, and in excess of 17.5 times in Inner London; in the City of London, and despite a median earnings figure almost twice that of Outer London, the ratio was 14.9 (this way of looking at it follows the officially favoured affordability measure.) This reflects super-charged house prices outpacing London earnings (ONS, Citation2019). Outside of social housing, rental costs for accommodation follow house prices. Both are resilient to shocks (an experimental index tracking private landlord rents shows a ‘markedly higher’ recovery in London following the 2008 crisis than elsewhere in Britain; ONS, Citation2014). Some of this reflects large speculative investments. For example, an econometric study by Sa (Citation2016) ]which uses Land Registry data finds that foreign investment, accounting for almost 20% of overall house price inflation in England between 1999 and 2014, was concentrated in, and particularly significantly in, London and the South East.
3.4. High costs of living
Costs of living in London are high. Hearne (Citation2021, pp. 956–957) finds London a particularly expensive place to live in Britain, at 130% of the national average for retail prices. High housing costs are very significant, a point recognized as important for disposable income in the levelling-up strategy (HMG, Citation2022, pp. 22, 223); but price levels more generally are high. This matters when comparing nominal earnings with other cities, and not just for the better paid. For example, Britain’s national minimum wage was conceived with a London allowance (Thornley & Coffey, Citation1999), now incorporated into the national living wage that was introduced in 2016. London therefore generates generally high costs of living, within the specific contexts of its spatially compacted commuter-driven economy and high property valuations. All these points are relevant to how best to think about agglomeration effects, to which we now turn.
4. AGGLOMERATION EFFECTS AND PRODUCTIVITY METRICS
In keeping with the preceding discussion, an agglomeration effect will be called positive when benefitting at least one constituent group, in a triad composed of the generality of business establishments, consumers and workers in a city-space, with damage to none. Conversely, it is negative if one or more of these groups is damaged, without benefit to any.Footnote2 Economies or diseconomies are involved if the spatial proximities that foment the agglomeration effects act to reduce or raise costs, respectively. Costs should be measured at the level of production which establishments choose.
We proceed by considering how positive and negative agglomeration effects separately affect labour productivity in a (stylized) representative establishment. The establishment’s real output, measured in its ‘natural’ unit, is . The GVA, generated from its sale, is
. By assuming that a change in labour input means a change in the number of staff jointly employed within the reference period, each of whom holds a single job, the difference for expository purposes between a head-count, jobs-count or hours-count becomes nugatory. Labour input can therefore be interpreted in any of these terms, and is denoted by
. For simplicity, but without loss of substance to the subject at hand, other variable inputs are abstracted from.
4.1. An expository framework
It will be assumed that diminishing returns to variable labour input is the norm: each extra unit of labour input adds less to production than the last. While less plausible in a manufacturing economy, applied to a services-dominated economy such as London’s, it is eminently reasonable to suppose that adding hire after hire does not produce equivalent results in the reference work period, but tapers as bodies accumulate in, around or at other points via a premises. This is obvious for establishments in situ, whose workers are constrained to operate in a fixed space: a restaurant, say, or a café, theatre, salon, office, shop, chambers or retail outlet. But the point extends naturally to limits on the number of people a single office can organize effectively for activities performed either at, or travelling between, other premises: for example, in cleaning services, maintenance services or courier work. In a multi-establishment business, where each has similar in situ characteristics, nothing substantial alters. In a franchise chain, for example, scale economies in areas such as marketing, acquisitions, purchasing or management training at the collective level do not preclude diminishing returns to variable labour input at establishment level. Adding successive bodies to the kitchen in a franchised fast-food restaurant is still likely to see diminishing increments to its rate of burger output. A similar point applies elsewhere, including business services.
How output changes as labour input
rises (falls) is illustrated by curve
, which is drawn identically for and . The ratio
over
falls whenever we move down this curve, going from left to right. A corresponding marginal cost (MC) curve is fully determined once the nominal (money) value of the wage rate is known. The MC curve then traces the addition to total cost of successive increases in output. For example, at wage rate
(
) the MC curve is
. Suppose that the marginal revenue (MR) curve, which traces by how much the establishment’s total revenue changes as it expands output, is
. Profit is maximized when output is chosen for the level at which MC cuts MR from below. This is at point
in either . Output
is then produced using labour input
.
Figure 2. Positive agglomeration effects.
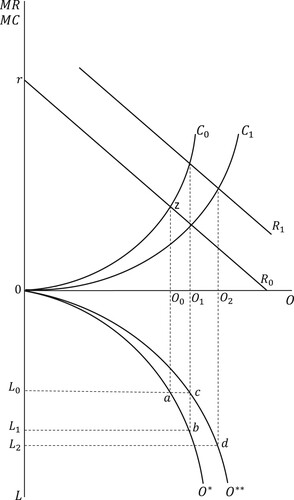
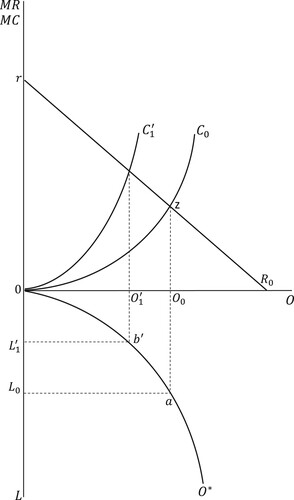
Figure 3. Negative agglomeration effects.
Let us take these curves, and the associated profit-maximizing choice for output, as representing how things would look without agglomeration effects. Starting from this same initial position, positive and negative effects can be compared. Positive agglomeration effects are considered in , negative in . Because we have abstracted from the variable costs of materials or bought-in services, it follows that establishment GVA is the same thing as gross revenue. In other words, GVA is simply price () times output. This in turn means that the GVA productivity metric is determined as follows:
.
4.2. Positive agglomeration effects
Rather than run through every conceivable example of a positive agglomeration effect, two prominent potential sources are sufficient. Each is particularly relevant when thinking about London’s central (CAZ-NIOD) core, which has an international clientele that looks to it for a range of financial and other knowledge-based services. Agglomeration conduces to transactions cost savings for these clients, including search costs and contracting costs: the specialized services and relevant reserves of expertise are ‘known’ to be had in London, and more easily found and used. Analogous savings would similarly apply to inter-firm transactions in and around the city core. Likewise, agglomeration gains accrue if the spatial proximities of cognate businesses, combined with the prestige of work in a major city-centre, reduce the cost to establishments of recruiting workers with requisite capabilities and personality profiles – workers perhaps also attracted by proximities to the capital city’s cultural social capital.
On the demand side, the net implication of this is that demand for the services of the London core is higher than it would otherwise be. expresses this as a displacement of curve to a higher position: say
. Profit-maximizing output is now increased to
and labour input to
. This represents a new position further down curve
, initially at point
but now at
, where the ratio
/
is smaller. In other words, the effect of this is to reduce real average labour productivity. Insofar as the GVA productivity metric is concerned, the impact of the positive agglomeration effect can now go either way. This is because demand has risen against an upwards sloping MC curve, so that price
will be greater. This means that, without imposing further restrictions on the example, it is actually impossible to say in which direction (if at all) the positive agglomeration effect moves the GVA productivity metric, which depends for its value on both sets of factors.Footnote3
On the production side, greater success in finding and hiring capable and suitably inclined workers could shift the production relation. Carrying on from the position arrived at after incorporating effects on the demand side, this next effect is indicated by a displacement of production relation : say to
. Although the extent of the shift would be mediated by any change in the wage rate that might accompany different hiring-practice by worker type, the effect (since cost-reducing) would be to generate a new MC curve to the right of
, here labelled
. Were output to remain at its initially expanded level
, the ratio of
over
goes back up: compare point
on
with point
on
. However, because the new intersection point for MC and MR dictates a further expansion of output to
, the relevant comparison is not with point
on
, but rather point
. Whether
over
is higher, lower, or just the same at this last point when compared with
are all possibilities to be entertained. While the case drawn in is, for illustration’s sake, one in which there is no further net decline in real labour productivity, this cannot be ruled out.Footnote4 Moreover, because this extra expansion of output will cause
to fall again, then even if the production effect were to raise overall the ratio of
/
, the GVA productivity metric
could still move in response (if at all) either way.Footnote5
There is in fact only one instance in which we can be certain that a labour productivity metric based on GVA will rise. This is where demand rises to the point where the establishment reaches its maximum capacity point for further expansions of output and labour input, so that /
locks. From this point, if demand is further supported by the positive agglomeration effect,
must increase. This follows directly from an ongoing increase in
alongside a fixed value for
. Taking all possibilities together, it is nonetheless clear that a multiplicity of potential outcomes exists.
4.3. Negative agglomeration effects
By comparison, negative agglomeration effects are straightforward. Recall the particular spatial distribution of London jobs vis-à-vis workers, and how in recent decades housing and rents have become increasingly less affordable in its centre. The agglomeration effect is immediately negative because workers either pay more to live near jobs or expend more in time and money commuting to work. One natural outcome of this is to put upwards pressure on nominal (money) wage rates. Looking to , and starting from the same initial position as before with ,
,
and point
, any upwards pressure on the wage rate will shift the MC curve leftwards. For example, suppose as a result of cost of living pressure the wage rises to
and MC displaces to
, so that output contracts to
and labour input to
. Comparing the new point
on
with the initial point
, we can see that
rises. In other words, real labour productivity is increased by the negative effect. Moreover, with less output on the market, price
must go up, so that
rises on both counts.Footnote6
4.4. A comparison
All these effects could operate at the same time. A negative agglomeration effect, which raises productivity, could in one respect be construed as an epiphenomenon of a positive agglomeration effect, with its less certain results. Thinking once more about services-oriented London, characterized by a particular (radial) structure and spatial concentration of financial and other knowledge-based activities, the core of the city-space is certainly supported by positive agglomeration effects. It is the commercial strength of this core that would in turn account for negative effects, via pressures thus exerted on access to the central spaces (and also because expertise found in the core undoubtedly facilitates London’s damaging property speculation). And if economies from agglomeration reduce, for example, transactions costs, to the main benefit of commercial undertakings in and around the core, the diseconomies of living and working in London could expect to be felt across a broader width of the city’s industries. What we have shown confirms the critical points made at the close of section 2. Relevant relationships, both for the ‘real’ ratio and
are summarized in .
Table 1. Agglomeration effects and productivity metrics
We have previously described the likely impact of negative agglomeration effects on labour productivity as a rentier productivity effect, when specifically considered in the context of a city-economy shaped like the London city-space. This is because it would arise as the unintended and incidental by-product of a transfer of income from a range of city stakeholders to what in the main is a rentier interest in property. All three parts of the triad of businesses, consumers and workers suffer: business establishments from higher wage costs and consumers from higher prices, and with no presumption that workers – as consumers also affected by the general price level – are fully compensated for the excesses they pay for access to accommodation and (or) commutes to work. The study of aggregate regional incomes and prices by Hearne (Citation2021) establishes that a strong general price lift effect exists in the London region. We have noted too that statutory wage minima for directly employed workers are higher in London. Both are consistent with the prerequisites for a rentier productivity effect, because it is only through pressure on money wages – which feed higher prices – that such a phenomenon could occur. As with its spatial structure, London appears as an ideal type.
4.5. Capitalization of production
There are further dimensions to this, and while some of these lie beyond the scope of this article to consider, one additional point should be made. It is reasonable to ask how agglomeration effects, whether positive or negative, affect the capital committed to providing workers with equipment in the workplace. Let us suppose for argument’s sake that the workforce employed in the financial and knowledge-based industries that cluster in the London core is better equipped as a result, because the positive agglomeration effects encourage this kind of investment (the core is well positioned internationally and profitability in ‘normal’ times is thought secure). Translated into the terms of the expository framework in , the effects of this in the first instance simply entail additional reinforcing displacements of the MR curve, production relation and MC curve, of a type already considered. Thus the MR curve would be expected to shift outwards inasmuch as a financial analysis unit, for example, which is better equipped with hardware, software and data, experiences a greater demand in the marketplace for its services as a result. This can be incorporated into the account already given without qualifying its conclusions. The net effect of this investment on both /
and on the GVA metric would again be ambiguous, for reasons that parallel our previous discussion of .
What is probably more interesting is whether negative agglomeration effects impact establishment investment decisions in an analogous way. To the extent that upwards pressure on wage rates encourages investment in capital equipment, this would affect the demand side and the production side of the business similarly (especially if the ability of lenders to bet on the resale value of property rather than the expected profitability of the investment per se mitigates any offsetting rise in the cost of finance). However, empirical evidence that the wage rate, relative to the cost of finance, significantly impinges the choice of technology is notoriously rather weak. For this reason, and with both positive and negative agglomeration effects in mind, we see no reason to qualify a summary of likely outcomes as this is shown in . With these observations in place, we return now to questions of strategy.
5. STRATEGY, PRODUCTIVITY AND CONNECTIVITY RECONSIDERED
The unquestioned assumption running through the various British government strategy documents is that London is a productivity role model, which policy should enable other cities and regions to emulate. In challenging this, we follow a standard practice amongst economists of exploring weaknesses in the theorization of data by demonstrating the existence of a quite alternative explanation, one which is consistent with the premises of basic economic theory and whose prior plausibility is supported by practically every facet of what is known about the structure of the London economy: its service orientation, spatial organization, data on trends in accommodation costs relative to earnings, higher nominal wages even for low-pay workers, and high prices. We next consider this in relation to how it would change the cities-focused policy debate.
5.1. London as a role model
Given impetus after the financial crisis of 2008 towards industrial policies aimed at moving Britain away from an over-dependence on finance, banking and property, the rehabilitation since of London’s reputation is risky as well as ironic. Although central banks have worked hard to prop up asset prices, there are no good reasons for supposing that these sectors are now stable. Hazards range from debt exposure and mal-investments to trigger-events for another financial meltdown: while the ultimate economic fallout remains unknown at the time of writing, Russia’s invasion of Ukraine is certainly not conducive to the stability of financial architectures. Added to this are existing uncertainties over post-Brexit (and post-Covid) Britain. Yet, even putting this plethora of ‘known’ unknowns to one side (for an example of the routine risk assessments conducted at the Bank of England, see Financial Policy Committee (FPC), Citation2021), our analysis explains why the treatment of productivity in relation to agglomeration has not been undertaken in a sufficiently complete way to justify London’s use as a role model.
Positive effects from agglomeration are undoubtedly relevant to the financial and knowledge-based activities of London’s central core. One prominent feature of the central CAZ-NIOD districts of London, led by finance, followed by information and communications, as well as professional, scientific and technical work, is how its services feed an international market. This includes its real estate services, which support foreign investment in London properties. Data for a sample year presented in the Economic Evidence Base for London (Citation2016, pp. 14–20) show that a half-decade on from the post-2008 slump service exports originating from London made up around two-fifths of all service exports from Britain as a whole. Not unreasonably, regional specialists have inferred that a high share of service exports overseas is an important factor in explaining London’s productivity (Martin et al. Citation2017, pp. 7–8). In the last section we described the special case in which high demand pushes establishments to capacity, after which a GVA labour productivity metric must rise. A high enough service export demand could certainly push the central core of London establishments onto the inelastic portions of supply, from where this metric () can only go up.
However, both the national industrial strategy and the levelling-up agenda can be criticized for thinking only in terms of positive effects. Against this, we have demonstrated how negative agglomerate effects could in a very direct way lift both the GVA metric and its real component (), in service industries of every stripe, including services outside the finance and knowledge-based sectors. We explain likewise why such negative effects are likely to accompany positive ones. Positive advantages, including London’s access to physical, financial, human and social resources as well as its claim to intangibles, sustain a core which in turn drives an epiphenomenal rentier effect – one caused by the pressures this creates for access by businesses, workers and wider populations to the central spaces of the city. A rentier productivity effect acts directly to increase the real as well as the nominal component of labour productivity.
The first thing that must change is how policymakers think not only about GVA metrics, but also about labour productivity more generally. Uncritically presenting data whose interpretation is questionable should cease. For example, the ONS is constructing a ‘subnational data explorer’ to make granular data available to local and regional decision-makers. While laudable, a sample page shows GVA per hour worked at the top (HMG, Citation2022, p. 152), which we have shown to be problematic. Because negative as well as positive factors can lift this metric, at the very least a clear warning on interpretation is required, alongside other indicators that better indicate shared prosperities, including amenities, housing costs, the real wage range and other local income sources. Following on from this, the second thing that must change is London’s rehabilitation as a productivity role model.
5.2. Productivity and wages
To illustrate further, consider the following. Despite having the highest average score in Britain for GVA over employment, London experiences high incidences of low pay. But as observed, the statutory minimum wage for London’s directly employed workers has incorporated from inception a cost-of-living allowance (see section 3). While part compensating high costs of living, in housing, transport and the general price level, this also raises the MCs of employment for London businesses. It is widely remarked that London possesses a large self-employed workforce lacking this wage protection. Broughton and Richards (Citation2016, pp. 6–8) find that of the one in five London workers estimated at the time of study as being self-employed, nearly two-thirds earned less than a directly employed fulltime worker paid at the statutory minimum rate (while losing other statutory entitlements including employers’ pension contributions, paid holidays and sick pay). This London phenomenon, of mass self-employment with impoverishment, runs alongside seemingly high productivity. An obvious way to reconcile what must otherwise appear paradoxical is this: a higher regulatory wage, to compensate a higher cost of living, contributes directly to London’s seemingly impressive labour productivity scores via the mechanism of a rentier effect; but it also encourages businesses to opt for a ‘firm contractor’ model (p. 6) that reclassifies workers as self-employed to avoid statutory wage regulation. Unsurprisingly, employment status is a major area of litigation in the British capital.
Yet, while our analysis offers a single integrated way of drawing all these different elements together, there is nothing in the results to boast about. A consistent theme in the industrial strategy and levelling-up agendas is that productivity leads wages. But a downwards pressure on (real) wages, through higher living costs and forced self-employment, may come from the same effect that lifts labour productivity both on the nominal GVA metric and in real terms. This is obviously relevant to research (e.g., Rae, Citation2012), on space and deprivation. The Evidence Base for London’s Local Industrial Strategy (Citation2020, pp. 3–4) stresses that after deducting housing cost, incomes for the bottom half of London’s population lie below the national average, with high incidences of relative poverty, child poverty and food insecurity. It is to the credit of the levelling-up agenda that deprivation in London is recognized. But it still refuses to countenance anything other than a further productivity lift as solution. Our analysis sets out an alternative interpretation of the situation, wherein the mechanisms inflating the productivity metrics drive the deprivation. London’s is not a role model.
From this vantage point, policy implications follow. Legislation to stop London workers being redefined as self-employed by firm-contractors, thereby re-establishing the reach of statutory wage and other employment protections, requires support from policies to tackle rack-rents and other sources of high housing costs. This could include, as an immediate measure, the full exploitation of new modes of home-based working of the sort experimented with because of Covid, to address the almost extraordinary divergences between where Londoners live and work. Ending speculative inflows of money into London property markets would also be important. From this, lessons could be drawn for other parts of Britain and fresh approaches to levelling up.
5.3. HS2
Sharing benefits from London’s agglomeration with other parts of Britain has been used to justify HS2, largest by far of Britain’s current infrastructure projects. This is a very significant illustration of how the conceptual (theoretical) underpinning of a strategy shapes a major practical (applied) policy. But here again, a one-sided understanding of agglomeration effects, and vis-à-vis London productivity, has played an important role. To see this, consider the controversy over this project.
A useful way to begin is by noting the course of debate amongst urban and regional specialists when HS2 was first mooted. Tomaney (Citation2011), opposing the idea, drew on evidence for high-speed rail links in five other countries to warn that some cities and regions could prove net losers; while for those gaining the principal winner was likely to be London itself rather than other parts of Britain. A contra-opinion, reflecting a long-standing interest in inter-city connectivity and drawing on other sources, came (with caveats) from Peter Hall (e.g., Hall, Citation2013a, Citation2013b). While this discussion principally concerned the distribution of economic gains and losses, growing sensitivities about ecological damage in the project’s construction stage led follow-on commentaries, even when favouring Hall, to acknowledge this aspect. This is evident, for instance, in Coyle and Sensier’s (Citation2020) discussion of cost–benefit rules. Such was the mounting controversy that, despite support from the 2017 industrial strategy, a final review commissioned by the government was published as Oakervee (Citation2020). Relevant questions then are how this review handled both economics and ecology.
On the first point, there is little doubt that Oakervee (Citation2020) took a positive view of the developmental prospects of HS2 for Britain’s regional economies. While unfortunately oblique on calculation details, an amenable view of the conceptual approach of the industrial strategy is evident: ‘static agglomeration’ is linked with ‘productivity benefits’ (p. 94). Pros and cons were certainly considered, in a way mirroring the Tomaney-Hall debate:
On the one hand, there are views that HS2 will drive greater economic growth outside of London and across the country because of poor connectivity, reliability, quality and inadequate capacity acting as a constraint on productivity and economic growth. On the other hand, there are views, based on international experiences, that London could derive more benefits from HS2 than places outside of London.
The conclusion reached was that the project overall merited a ‘low–medium’ pass, with estimated benefit–cost ratios ranging between 1.1–1.2 and 1.3–1.5 (pp. 102–103) (ratios somewhat smaller than the first ones produced by the British government; Tomaney, Citation2011). But on the second point, the remit given to the Oakervee review did not include prospective ecological damage. Hence, the benefit–cost ratio upon which the project passed was only a partial one, excluding amongst other things biodiversity and loss of species and habitats. Accepting the review, the government confirmed that the whole of the project would proceed – connecting London via the Midlands to England’s North, and Scotland in the later stages.
The government has since announced that the Eastern leg of the project, connecting the Midlands to the city of Leeds in the North East of England, is to be scrapped and replaced with alternative local rail programmes; in this way focusing the Northern component of the HS2 investment on the North West.Footnote7 This news, which came late in 2021, was welcomed by anti-HS2 campaigners, but widely reported as weakening the government’s commitment to its levelling-up agenda. However, had a more critical understanding been arrived at of agglomeration effects and productivity metrics – justifications for HS2 as a fast link to London – it is difficult to see in any case how the Oakervee review could have found a positive benefit–cost ratio. It is germane to observe that HM Treasury project appraisal rules had previously been relaxed to accommodate the view taken in the industrial strategy of agglomeration effects in relation to productivity (on which, see Coyle & Sensier, Citation2020). What we have endeavoured to show is that this view has never been a complete one.
5.4. Industrial policy, place and democracy
There is another context to this. Coyle and Sensier (Citation2020), in relation to industrial policy, demonstrate the stranglehold that a London-centric policy machine has had on regional investments in Britain in transport infrastructures. Yet, despite an avowed aim of developing places beyond London, HS2 is a striking instance of a project driven from the London-centred heart of Britain’s highly centralized government apparatus – for example, there was no local consultation before cancellation of its Leeds link. It is reasonable to ask if this massive, and still hugely expensive, project would have been chosen had alternative uses of the same money been publicly debated.
Transport infrastructures and services are part of the ‘foundational economy’, a term used in an emerging interdisciplinary perspective that gives short shrift to highly aggregated metrics, favouring instead attention to the variety of lived human experiences and income-tiered policy relevance (Moran & Williams, Citation2017; Foundational Economy Collective, Citation2018; Calafati et al., Citation2021), and this would be a case in point. While by no means tying automatically into a purely ‘localist’ policy agenda, by starting from a bottom-up perspective and the existing patterns of need and disparity the approach to connectivity which follows is better attuned to genuinely place-based policies which are less centralized and more democratic in nature, and as such more likely to lead to more inclusive outcomes.Footnote8 It has been belatedly recognized in the levelling-up strategy that people living in transport poverty, unable to afford local bus services, are unlikely to gain from a high-speed London rail-link; and some money has been primed to support a national bus strategy (HMG, Citation2022, pp. 177–179). While commendable, if belated, HS2 will continue nonetheless, barring a major and politically unlikely volte face by central government (albeit with the likelihood that some planned elements may get revised as this costly project proceeds). In the meantime, the opportunity cost in other projects foregone is large: for instance, the amount that has and will be spent could have been used to reinsulate Britain’s homes.
The appropriate balance of devolved policy decision-making has generated an international literature, with multiple spatial reference points. Recent commentaries applying to Britain include Bailey and Tomlinson (Citation2017), Bailey et al. (Citation2017, Citation2019a, Citation2019b) and Fai and Tomlinson (Citation2019); with broader contextualization provided by the likes of Rodrik (Citation2011) (on which see Bailey et al., Citation2019a, pp. 339–343; and Warwick, Citation2013). The design of policymaking architecture is extensively discussed in the levelling-up strategy, with particular attention on appropriate levels of devolution, representing another advance on the 2017 industrial strategy (HMG, Citation2022, pp. 122–158). Alongside a rethink on agglomeration, productivity and levelling up, taking seriously the question of democratization of policy formulation and funding is fundamental.
6. CONCLUSIONS
Considering all this in the round, the current strategies for Britain are a peculiar mix of the regressive and familiar, and the novel. On the side of regression, the restoration of London as a role model, as well as the attempt to transform the economic prospects of other cities and regions via an indirect approach to economic development that gives primacy to supporting infrastructure investments, harks back to the biases and viewpoints that held sway before the financial crisis. Yet, at the same time it would be unfair not to recognize the novelty: city and regional development has been placed firmly on the British government policy agenda, accompanied by an explicit acceptance of imbalances between and (more recently) inequalities within city-regions. What is also novel is the impetus provided by a secular decline in national workforce productivity growth, giving a particular slant to the aims of strategy: there is an urgent desire to promote measures aimed at raising levels of labour productivity. It is on this basis that London has been rehabilitated as a British role model: converging towards its higher labour productivity has been made a totem for other cities and regions.
What we have shown in this article is that the analysis of the productivity metrics is one-sided, if not naïve, in how agglomeration effects are understood. The argument that has been advanced by the British government posits London’s productivity metric, based on a ratio of GVA generated to labour input, as the result of a successful realization of static economies of agglomeration, supplemented in recent formulations by its access to a range of other types of resource advantage. However, this underestimates somewhat the subtleties of how productivity metrics can be shaped even by positive agglomeration effects, while missing negative ones. All of which points towards a major rethink: on the use and presentation of data; on policies to address inequalities within as well as between cities; and on the need for decision processes that permit democratized comparisons of alternative uses of large sums of money.
Critically, the prevailing methodology and (indeed) obsession with framing industrial policy outcomes in terms of a questionable productivity metric is currently skewing the policy decision-making process in ways that are liable to undermine the levelling-up agenda and lead ultimately to suboptimal outcomes. We have described how a city rentier effect can potentially immiserate a workforce while ‘supporting’ its productivity, as this is measured by the ONS. Similarly, we have seen that important environmental (ecological) qualifications to the desirability of Britain’s controversial and massively expensive HS2 rail infrastructure project were sidelined in favour of a cost–benefit approach which certainly failed to take account of negative reasons for a high London labour-productivity metric. Accepting that a more nuanced and less uncritical stance is needed on productivity, we have observed too the potential relevance of a foundational economy approach, within which to frame policies that foster genuinely place-based social programmes to enrich the experience of living by taking as their starting point the material realities of people’s lives.
ACKNOWLEDGEMENTS
The authors are pleased to acknowledge the suggestions of the referees and overseeing editor in improving the contents of this paper. All errors naturally remain the authors’ own.
DISCLOSURE STATEMENT
No potential conflict of interest was reported by the authors.
Notes
1. For example, four ‘Grand Challenges’ were discussed in the 2017 strategy, for artificial intelligence and big data; clean growth; (auto) mobility; and an ageing population. These have become quasi-autonomous components in the industrial strategy roll on (an update on the industrial strategy webpage, published shortly before the 2021 plan for growth, emphasized an ongoing commitment to ‘ambitious’ missions to meet these challenges). In keeping with a net zero carbon target by 2050, clean growth – including auto-mobility – is again prominent in the 2022 levelling-up strategy, as too artificial intelligence, in relation to jobs.
2. Although not required for this article, where benefits and detriments accrue to different parts of this triad, we could call the resulting agglomeration effect a mixed effect.
3. A parallel outwards shift from creates a new marginal revenue with vertical intercept
, with
. Differentiate to obtain:
With both right-hand side terms positive their difference cannot be signed a priori.
4. To obtain a marginal formula for a given (unchanged) wage rate, write profit-maximizing output as a function of all of its parameters plus a factor
which captures the displacement of the production relation. With
(we deal with the case where
> 0), and
, we obtain:
Once again, the right-hand side cannot be signed without further information. This could be obtained by further exploring the production relation. However, once we allow for the fact that different workers might obtain different wages, analysis is necessarily complicated. (Note also that while draws labour productivity at points and
as though they were equal, this would be purely coincidental if so and need not be the case.)
5. Carrying on from (4) we obtain:
As before, and bearing in mind that we also allow the possibility that different workers obtain different wages, further information is needed to sign the first term on the right-hand side. But the second term is negative, provided only that is negative (< 0). We can see, considering possibilities, why
over
and
over
can move in different directions.
6. The argument is not greatly complicated if we include another displacement of the production relation, this time in an opposite direction. However, it seems more plausible to think rather of the negative agglomeration effect constraining the size of the positive.
7. This development is unsurprising given the cost of HS2 – £80 billion in 2015 prices is an enormous undertaking as a rolling commitment whatever the trajectory of prices over time. Another casualty of economizing has been the Industrial Strategy Council (ISC), established to monitor progress on the 2017 industrial strategy, likewise ended in 2021.
8. A framing device that would better connect policy dialogue and formulation to the rich body of regional research (e.g., Morgan, Citation2019) that exists more generally.
REFERENCES
- Aiginger, K., & Sieber, S. (2006). The matrix approach to industrial policy. International Review of Applied Economics, 20(5), 573–601. https://doi.org/10.1080/02692170601005507
- Bailey, D., Coffey, D., Gavris, M., & Thornley, C. (2019a). Industrial policy, place and democracy. Cambridge Journal of Regions, Economy and Society, 12(3), 327–345. https://doi.org/10.1093/cjres/rsz010
- Bailey, D., Glasmeier, A., & Tomlinson, P. R. (2019b). Industrial policy back on the agenda: Putting industrial policy back in its place. Cambridge Journal of Regions, Economy and Society, 12, 319–326. https://doi.org/10.1093/cjres/rsz018
- Bailey, D., & Tomlinson, P. R. (2017). Back to the future? UK industrial policy after the great financial crisis. In P. Arestis & M. Sawyer (Eds.), Economic policies since the financial crisis (pp. 221–264). Palgrave MacMillan.
- Beatty, C., & Fothergill, S. (2019). Local productivity: The real differences across UK cities and regions. Centre for Regional Economic and Social Research, Sheffield Hallam University.
- Broughton, N., & Richards, B. (2016). Tough gig: Low paid self-employment in London and the UK. Social Market Foundation.
- Brown, J., Gariban, S., Belcher, E., & Washington-Ihieme, M. (2020). Core values: The future of Central London. Centre for London. https://www.centreforlondon.org/reader/central-london/central-london-today/
- Calafati, L., Froud, J., Haslam, C., Johal, S., & Williams, K. (2021). Diversity in leading and laggard regions: Living standards, residual income and regional policy. Cambridge Journal of Regions, Economy and Society, 14(1), 117–139. https://doi.org/10.1093/cjres/rsaa027
- Coates, D. (1996). Introduction. In D. Coates (Ed.), Industrial policy in Britain (pp. 3–29). Macmillan.
- Coates, D. (2005). Prolonged labour: The slow birth of new labour Britain. Palgrave Macmillan.
- Coffey, D., & Thornley, C. (2015). Unions, government and sector interventions: A new British path for industrial sustainability? In F. Gerlach, M. Schietinger, & A. Ziegler (Eds.), A strong Europe – but only with a strong manufacturing sector: Policy concepts and instruments in ten EU member states (pp. 80–115). Schüren.
- Cowling, K., Oughton, C., & Sugden, R. (1999). A reorientation of industrial policy? Horizontal policies and targeting. In K. Cowling (Ed.), Industrial policy in Europe: Theoretical perspectives and practical proposals (pp. 17–31). Routledge.
- Coyle, D., & Sensier, M. (2020). The imperial treasury: Appraisal methodology and regional economic performance in the UK. Regional Studies, 54(3), 283–295. https://doi.org/10.1080/00343404.2019.1606419
- Driver, S., & Martell, L. (1998). New labour: Politics after Thatcherism. Polity.
- Economics Evidence Base for London. (2016). Economic evidence base for London. GLA Economics, Greater London Authority (GLA). https://www.london.gov.uk/what-we-do/research-and-analysis/economic-analysis/economic-evidence-base-london-2016
- Evidence Base for London’s Local Industrial Strategy. (2020). The evidence base for London’s local industrial strategy – Final report. GLA Economics, Greater London Authority (GLA). https://www.london.gov.uk/business-and-economy-publications/evidence-base-londons-local-industrial-strategy-final-report
- Fai, F. M., & Tomlinson, P. R. (2019). Developing a place-based industrial strategy: The case of England’s LEPs. L’industria, 4, 736–760. https://doi.org/10.1430/95939
- Financial Policy Committee (FPC). (2021). Financial stability report. Financial Policy Committee of the Bank of England. https://www.bankofengland.co.uk/financial-stability-report/2021/july-2021
- Foundational Economy Collective. (2018). Foundational economy: The infrastructure of everyday life. Manchester University Press.
- Girardi, A., & Marsden, J. (2017). A description of London’s economy (Working Paper No. 85). GLA Economics, Greater London Authority (GLA). https://www.london.gov.uk/sites/default/files/description-londons-economy-working-paper-85.pdf
- Hall, P. (2013a). Other side of the high-speed rail argument. The Guardian, 30 January. https://www.theguardian.com/uk/2013/jan/30/other-side-high-speed-rail-argument
- Hall, P. (2013b). High speed two: The great divide. Built Environment, 39(3), 339–354. https://doi.org/10.2148/benv.39.3.339
- Hearne, D. (2021). Regional prices and real incomes in the UK. Regional Studies, 55(5), 951–961. https://doi.org/10.1080/00343404.2020.1836340
- HM Government(HMG). (2017). Industrial strategy: Building a Britain fit for the future. Department for Business, Energy and Industrial Strategy (BEIS). https://www.gov.uk/government/publications/industrial-strategy-building-a-britain-fit-for-the-future
- HM Government(HMG). (2021). Build back better: Our plan for growth. HM Treasury. https://www.gov.uk/government/publications/build-back-better-our-plan-for-growth
- HM Government(HMG). (2022). Levelling up the United Kingdom. Department for Levelling Up, Housing and Communities. https://www.gov.uk/government/publications/levelling-up-the-united-kingdom
- Martin, R., Tyler, P., Storper, M., Evenuis, E., & Glasmeier, A. (2018). Globalization at a critical conjuncture? Cambridge Journal of Regions, Economy and Society, 11(1), 3–16. https://doi.org/10.1093/cjres/rsy002
- Martin, R., Tyler, P., Sunley, P., Pike, A., Bailey, D., Evenhuis, E., Gardiner, B., & Swinney, P. (2017). Cities and the national productivity problem: Evidence submitted to the UK government’s industrial strategy green paper consultation. https://www.cityevolutions.org.uk/wp-content/uploads/Project-Submission-to-Industrial-Strategy.pdf
- Morgan, K. (2019). The future of place-based innovation policy (as if ‘lagging regions’ really mattered). In M. Barzotto, C. Corradini, F. M. Fai, S. Labory, & P. R. Tomlinson (Eds.), Revitalising lagging regions: Smart specialisation and industry 4.0 (pp. 175–192). Taylor & Francis.
- Moran, M., & Williams, K. (2017). Avoiding ‘back to the future’ policies by reforming the ‘foundational economy’. In B. Jones & M. O’Donnell (Eds.), Alternatives to neo-liberalism: Towards equality and democracy (pp. 175–192). Polity.
- Oakervee. (2020). The Oakervee Review of HS2. https://assets.publishing.service.gov.uk/government/uploads/system/uploads/attachment_data/file/870092/oakervee-review.pdf
- Organisation for Economic Co-operation and Development (OECD). (2016). Measuring productivity. In OECD compendium of productivity indicators 2016. OECD Publ. http://www.oecd.org/std/productivity-stats/oecd-compendium-of-productivity-indicators-22252126.htm
- Office for National Statistics (ONS). (2014). Trends in the United Kingdom housing market, 2014. ONS. https://www.bl.uk/collection-items/trends-in-the-united-kingdom-housing-market-2014#
- Office for National Statistics (ONS). (2019). Housing affordability in England and Wales: 2019. ONS. https://www.ons.gov.uk/peoplepopulationandcommunity/housing/bulletins/housingaffordabilityinenglandandwales/2019
- Pessoa, P. P., & Van Reenen, J. (2014). The UK productivity and jobs puzzle: Does the answer lie in wage flexibility? The Economic Journal, 124(576), 433–452. https://doi.org/10.1111/ecoj.12146
- Rae, A. (2012). Spatially concentrated deprivation in England: An empirical assessment. Regional Studies, 46(9), 1183–1199. https://doi.org/10.1080/00343404.2011.565321
- Rodrik, D. (2011). The globalization paradox: Why global markets, states and democracy can’t coexist. Oxford University Press.
- Regional Studies Association (RSA). (2017). Industrial strategy green paper: Regional Studies Association response. https://www.regionalstudies.org/news/industrial-strategy-green-paper-regional-studies-association-response/
- Sa, F. (2016). The effect of foreign investors on local housing markets: Evidence from the UK (Discussion Paper). http://www.centreformacroeconomics.ac.uk/Discussion-Papers/2016/CFMDP2016-39-Paper.pdf
- Thornley, C., & Coffey, D. (1999). The low pay commission in context. Work, Employment and Society, 13(3), 525–538. https://doi.org/10.1177/09500179922118060
- Tomaney, J. (2011). The local and regional impacts of high speed rail in the UK: A review of the evidence. Written evidence to Transport Committee, May. https://publications.parliament.uk/pa/cm201012/cmselect/cmtran/writev/rail/m14.htm
- Warwick, K. (2013). Beyond industrial policy: Emerging issues and new trends (OECD Science, Technology and Industry Policy Papers No. 2). OECD Publ. https://ideas.repec.org/p/oec/stiaac/2-en.html