
 ?Mathematical formulae have been encoded as MathML and are displayed in this HTML version using MathJax in order to improve their display. Uncheck the box to turn MathJax off. This feature requires Javascript. Click on a formula to zoom.
ABSTRACT
Creative services have become an important, but understudied, part of global trade. This paper presents new evidence on the transformation, geography and industrial relatedness of creative service exports in the UK, using the Inquiry in International Trade in Services (ITIS) database. Creative services exports have grown over the past decade, but there are pronounced patterns of geographical specialization in the export of creative and non-creative services. We develop a measure of relatedness between exports of creative and non-creative services and of manufacturing goods. We argue that creative services are economically significant because of their interrelationship with other local sectors.
1. INTRODUCTION
Over the past decade, cross-border services have grown more than 60% faster than trade in goods (McKinsey Global Institute, Citation2019; United Nations Conference on Trade and Development (UNCTAD), Citation2017). New technology, deregulation and multilateral efforts to liberalize them have made services increasingly internationalized (De Backer & Flaig, Citation2017). In particular, creative services such as publishing, architecture and design have experienced unprecedented growth, leading to increasing attention from policymakers. In 2015, creative service industries (CSIs) accounted for approximately 19% of total trade in services worldwide. CSIs are often characterized by their intangible output (Department for Culture, Media and Sport (DCMS), Citation1998; UNCTAD, Citation2008, Citation2010), and so continuous progress in new digital technologies has expanded the range of creative services able to be produced and distributed remotely to consumers, thus lowering the barriers to entry in the global economy (UNCTAD, Citation2018a).
The literature on creative industries (CIs) has been growing rapidly (e.g., Casadei & Lee, Citation2020; Kemeny et al., Citation2020; Tether, Citation2019), yet their tradability has been largely ignored. The few studies aimed at exploring trends in CIs trade (Di Novo et al., Citation2020; Fazio, Citation2021; UNCTAD, Citation2018a) have remarked that its rise has been mainly driven by the expansion of trade in creative services. However, to date, little research has focused on the service component of CIs and, most importantly, its role in trade. Only a few studies started disentangling creative and non-creative services, analysing how regional specialization in CSIs is associated with higher levels of regional gross domestic product (GDP) per capita and labour productivity (Boix et al., Citation2013; Boix-Domenech & Soler-Marco, Citation2017), while their relevance in international trade has been investigated only descriptively at the aggregate level (Gouvea & Vora, Citation2016).
It is also important to understand how creative services originated, and how they are linked to the rest of the economy. Due to technological advances and digitalization, an increasing number of creative goods over time have been transformed into creative services, in particular in the media and publishing sectors (Abbasi et al., Citation2017), stimulating a growth as well in cross-border transactions of so-called ‘intangible goods’ (Hill, Citation1977; World Economic Forum (WEF), Citation2018). This has led to an increasingly blurred distinction between the tangible and intangible components of the CIs. More generally, the distinction between manufacturing and services over time has become increasingly vague, as these are more and more interdependent with the emergence of servitization in manufacturing industries combining sales of service- and manufacturing-related components (Baines et al., Citation2017; De Backer et al., Citation2015; Miles, Citation1993; Miroudot & Cadestin, Citation2017). In this regard, previous work has called for the research to investigate the way services and manufacturing industries are increasingly intertwined, in particular in the CIs (De Backer et al., Citation2015; Miroudot & Cadestin, Citation2017).
To combine these research gaps, this paper provides quantitative evidence of the growing significance of creative services exports over time, to identify regional clusters of specialization, as well as to study their industrial relatedness with non-creative services and manufacturing industries using export data. The focus is on the UK, an economy dominated by services and second only to the United States among OECD countries in terms of trade in services flows (Abreu et al., Citation2008). The UK has strongly invested in creativity as an engine of economic development, recently experiencing remarkable creative service sector growth. Between 2009 and 2014, the value of creative services exported from the UK increased by nearly 50%, three times faster than those from the rest of the economy, reaching £19.8 billion in 2014 (DCMS, Citation2016). This reflects a more general worldwide increase in the demand for creative services, making the UK one of the top exporting countries in the world thanks to its pool of creative human capital, long-lasting specialization in services and world's leading CIs (Di Novo et al., Citation2020).
We use Inquiry in International Trade in Services (ITIS) data in combination with the Annual Business Survey (ABS) to study trade in services. First, we locate CIs geographically and trace trade in creative services flows across the country to identify a pattern of regional specialization. Second, using co-occurrence analysis, we develop a measure of industrial relatedness between exports of creative, non-creative services and manufacturing goods to investigate the frequency with which they co-locate with manufacturing goods (Hidalgo et al., Citation2007; Neffke et al., Citation2011). The frequency by which creative services exports are located with non-creative services and manufacturing industries helps us to analyse their relationship with the rest of the local economy, in terms of production processes, product complementarity, technologies and skills, and markets. Finally, we analyse whether the relatedness of creative services, which measures how strongly connected these are with the local industrial structure (Boschma et al., Citation2015; Hidalgo et al., Citation2007), shapes the emergence of new comparative advantages and the regional specialization in knowledge intensive, high added-value creative services.
The paper makes two main contributions. First, it presents new data on trade in creative services and identifies clusters of specialization. Second, it provides evidence of industrial relatedness between creative and non-creative services and manufacturing industries, stimulating discussion on the nature of these relationships, their complementarity and how these shape the pattern of regional specialization in creative services.
Our results show that creative services exports have rapidly increased, becoming among the UKs most important service trade flows. Different creative services have different regional specialization patterns. However, they tend to be clustered in the South East of England and major urban areas. Creative services are strongly related to other non-creative services, even more than among creative services themselves, while the relatedness with manufacturing industries is weaker. Consequently, creative services have a stronger relatedness density with the local economy in urban areas and in the South East of England, the main hubs of knowledge creation where universities and knowledge-intensive industries are mostly clustered. An econometric analysis shows that relatedness with the rest of the local industrial structure explains regional specialization in creative services, even more than for other industries, in particular relatedness with other local services, and in regions with weaker relationships between creative services and the local economy.
2. CONTEXT AND THEORY
2.1. Trade in creative services
Services have often been overlooked in discussions of global trade. This was perhaps because of their intangible nature, which makes it more difficult to envision exactly what trade in services means (Schöllmann, Citation2015). The term ‘services’ covers a large variety of activities that cannot be easily encapsulated within a simple definition. The World Trade Organization (WTO) General Agreement on Trade in Services (GATS), in force since 1995, provides a rather broad definition of what constitutes trade in services, including four modes of supply: (1) services that cross the border virtually, such the provision of online banking; (2) services consumed abroad by foreign consumers, such as healthcare provided abroad; (3) services provided by branches or subsidiaries of foreign suppliers, such as the establishment of a local branch by a foreign bank; and (4) services provided by suppliers temporarily moving to a foreign country, such as engineers moving abroad to supervise construction work.
Trade liberalization and information and communication technological (ICT) advances have enabled tradability of services by lowering trade costs and barriers to entry and creating new channels for firms to deliver services remotely (De Backer et al., Citation2015; De Backer & Flaig, Citation2017). The value of services worldwide has increased considerably, now representing almost two-thirds of GDP and half of global employment (UNCTAD, Citation2017). Services have become the most dynamic component of international trade in both developed and developing economies,Footnote1 and their share of global trade could grow by 50% by 2040 (WTO, Citation2019).
Trade in creative services is a growing part of this phenomenon (UNCTAD, 2019). Since Howkins (Citation2002) used the term ‘creative economy’, there has been increased recognition of the role played by the creative economy in employment, trade and innovation. Central to the creative economy are the CIs, defined as ‘activities which have their origin in individual creativity, skill and talent and which have the potential for wealth and job creation through the generation and exploitation of intellectual property’ (DCMS, Citation1998, p. 5). UNCTAD (Citation2010, p. 8) enlarges this definition by describing these industries as ‘a set of knowledge-based activities, focused on, but not limited to the arts, potentially generating revenues from trade and intellectual property rights’.
Creative services are CIs in the service sector characterized by an intangible output (Boix et al., Citation2013; Gouvea & Vora, Citation2016; UNCTAD, Citation2018a). The few studies focusing on the service component of CIs have highlighted their contribution to GDP (Boix et al., Citation2013), labour productivity (Boix-Domenech & Soler-Marco, Citation2017) and trade (Gouvea & Vora, Citation2016). Various governments and economic development agencies have recognized the importance of creative services, and their exports, for economic growth (DCMS, Citation2016).
Creative services are highly diverse and can be exported under one of the four GATS exports modes: cross-border provision (e.g., telecommunications, the downloading of software products, book-keeping service deliveries), consumption abroad (e.g., visits to museums, attendance to live performance events), commercial presence abroad (e.g., headquarters of international advertising companies) and temporary movement of people (e.g., architects, musicians, artists moving abroad). They can also enter the export market as complements to other goods or services (e.g., books sold with web resources) (Fazio, Citation2021). Once services are sold to entities in foreign countries, they can be used in both the foreign and domestic markets, for instance, to support non-UK-based businesses in their activities in the UK.
Technological advances and digitalization have blurred the distinction between creative goods and services (Giannini & Bowen, 2019) and increased cross-border transactions of ‘intangible goods’ (Hill, Citation1977; WEF, Citation2018). For years, books, movies, games, music and media content have been moving from physical printed copies to digital files that can be distributed via channels of electronic communication to customers anywhere in the world (UNCTAD, 2019). Streaming sites such as Spotify and Netflix have turned the music, film and television industries into digital services, a process which was boosted by the COVID-19 pandemic. Future developments such as virtual reality and artificial intelligence will expand the range of creative services.
Creative services are amongst the most dynamic sectors in global trade (UNCTAD, Citation2010). Yet academic interest has been limited. Following the 2008–09 economic and financial crisis, international trade contracted by 12%, yet creative services have since grown globally at an average rate of 14%. Between 2000 and 2011, world trade in creative services more than doubled, accounting US$624 billion in 2011. Creative services exports rose from US$52.2 billion to US$172 billion, growing annually by 17% (Gouvea & Vora, Citation2016; Hajkowicz, Citation2015). Available creative services exports data from 38 advanced countries show that creative services account for a significant and growing portion of the overall trade in services in advanced economies. According to these data, the average annual growth rate of trade in creative services between 2011 and 2015 more than doubled that of all services. In 2015, the share of creative services in total trade in services accounted for 19% (UNCTAD, Citation2018a). In the UK, creative service exports were worth £19.8 billion and accounted for 9% of total service exports (British Council, Citation2019), and increased up to £27.1 billion in only two years (Creative Industries Trade and Investment Board (CITIB), Citation2019). However, tradability of creative services remains a major gap in the literature.
2.2. Relatedness between creative services and the rest of the economy
Given the increasing economic contribution of CSIs to advanced economies, it has become particularly important to understand how creative services are intertwined with other services and manufacturing sectors. This helps evaluate the strength of their relatedness with the rest of the industrial structure, in terms of input–output relationships, technological and skills mutual needs, and better understand how it could be possible to boost and exploit their complementarity.
An established literature has developed several measures to estimate the similarity and relatedness between different economic activities, without imposing a priori assumptions regarding the nature of these relationships (Breschi et al., Citation2003; Hidalgo et al., Citation2018; Jaffe, Citation1989; Teece et al., Citation1994). One of the most common approaches to measuring inter-industry relatedness is co-occurrence analysis which examines how often two industries are found together in the same economic entity. This method assumes that cognitive proximity leads to co-production of related products/sectors. Teece et al. (Citation1994) marked an important step forward in this field by measuring coherence of a firm based on the intra-business relatedness of its outputs. In this case, two activities that appear together regularly within the same business are assumed to be highly related; conversely, those business activities rarely occurring together are assumed to be largely unrelated. While these approaches were based on the co-occurrences of activities within one firm, Hidalgo et al. (Citation2007) generalized this framework by considering the number of times that two products showed a joint revealed comparative advantage (RCA) across countries. Their relatedness measure is based on the idea that two products are related if they are co-exported with a higher intensity than the national average by several countries. The probability that a country will export a product increases with the number of related products that this country already exports. In other words, two products will be close to each other if countries tend to have RCA in both products. This is because once a country has developed the capabilities to specialize in exporting particular products, it can easily diversify in related products that require very similar production processes, inputs, technologies, skills, as well as final costumers or distribution channels. One important implication is that product or industrial relatedness is likely to be geographically bounded, with firms co-locating near related firms (Corradini & Vanino, Citation2021). Because of this, one way of analysing relatedness is to focus on patterns of geographical proximity in terms of exporting industries (Bahar et al., Citation2014). While this approach cannot identify the exact mechanisms at play, it can – alongside other analysis – show potentially important patterns.
So far, few studies have applied the concept of relatedness or related variety to CIs. From an evolutionary perspective, higher related variety amongst CIs – in terms of technologically relatedness with other sectors – implies that firms can benefit from inter-sectoral knowledge spillovers and that regions will be able to successfully diversify in new industries that use similar skills, competencies or knowledge bases (Berg & Hassink, Citation2014). Cognitive proximity in the CIs has also been regarded as a key factor in fostering innovation and economic development in the area through cross-fertilization processes (e.g., Innocenti & Lazzeretti, Citation2019; Klement & Strambach, Citation2019b; Lee, Citation2020). Although unrelated variety within CIs is less common, it becomes particularly significant in the context of symbolic knowledge creation and through the decontextualization of mobile knowledge from its origin and its interaction with new contexts (Klement & Strambach, Citation2019a). Indeed, an heterogenous environment made of different cognitive frameworks can be an important source of inspiration and of fruitful collaborations across industries (Cohendet et al., Citation2014).
Several studies have also emphasized a positive relation between creative and non-creative sectors. Bakhshi et al. (Citation2008) explored the links between the CIs and other sectors in the UK to assess the contribution of CIs to innovation derived from a process of inter-sectoral cross-fertilization. Their findings support the idea that supply chain linkages to the creative sector are positively related to innovation elsewhere in the economy. Chapain et al. (Citation2010) highlighted co-location patterns and knowledge spillovers between creative sectors, high-tech manufacturing and knowledge-intensive business services in the UK. CIs may also play a key role in stimulating growth in non-creative parts of the economy (Lee, Citation2014). More broadly, the UK CIs seem to be highly integrated with the rest of the economy, as further stressed by the Trident methodology (Higgs & Cunningham, Citation2008) showing that creative workers are not restricted to creative firms but embedded throughout all industries.
More recently, Innocenti and Lazzeretti (Citation2019), using data on Italian provinces, adapted Hidalgo et al.'s (Citation2007) methodology to explore the relatedness between creative and other sectors. They found that the major interactions occur between creative sectors and other apparently distant sectors, which seem to have a high degree of cognitive proximity. Higher relatedness implies that these industries share similar knowledge that allows for cross-fertilization and spillovers between them. Previous work has also shown that services more broadly tend to co-locate not only amongst themselves, but also with manufacturing and other industries (Wernerheim, Citation2010). However, while some scholars have provided evidence of patterns of co-location between different creative services (e.g., Boix et al., Citation2013; De Propris et al., Citation2009), to the best of our knowledge, no studies have adopted the concept of relatedness to explore the proximity between the exports of creative services, non-creative services and other manufacturing goods.
3. DATA AND SUMMARY STATISTICS
Our primary dataset is the International Trade in Services Survey (ITIS), which contains data on UK firms’ trade in services (Office for National Statistics (ONS), Citation2021a). ITIS provides detailed information on the type, value and partner country for a sample of representative firms which are known to be trading in services. It differentiates between 52 service types following the United Nations Extended Balance of Payment Services (EBOPS) classification. For this analysis we focus on exports of services, defined as the sale by UK based entities of intangible commodities to any individual or business entity located outside the UK.Footnote2 Weighted measures of exports value at the regional (NUTS-2) and product level are obtained by summing the grossed value weighted by the probability of a firm to be selected in the ITIS sample. The analysis was restricted to the period 2011–17 to allow consistent comparison with data from other sources.Footnote3
Creative service exports were identified in the ITIS database using the DCMS (Citation2016) classification. We looked for the description of each group and subgroup of activities in the DCMS and ITIS classifications and then matched the corresponding categories. The following types of creative services exports were selected: advertising, market research and public opinion polling (ITIS code 7), public relations (9), copyrighted literary works, sound recordings, films, television programmes and databases (19), telecommunications (22), computer software (23), publishing (24), news agency (25), information services (26), audio-visuals (43), heritage and recreational services (46), and architectural services (48). Because our aim is to explore the relationship between exports of creative services, non-creative services and manufacturing goods, we opted for keeping this more granular classification of creative services compared to the traditional DCMS taxonomy. The match between our selected ITIS codes and traditional DCMS codes can be found in Table A1 in Appendix A in the supplemental data online. We classified the rest of the services exports into 10 categories: agriculture, manufacturing and mining supporting services (ITIS codes 1, 4 and 5), business and professional services (6, 8, 10–15), research and development (R&D) and patenting services (16–18, 20), postal services (21), construction services (27), financial and insurance services (29, 30), trading services (41, 42), personal services (44, 45, 47), technical and scientific services (49, 50), and other services (51, 52).
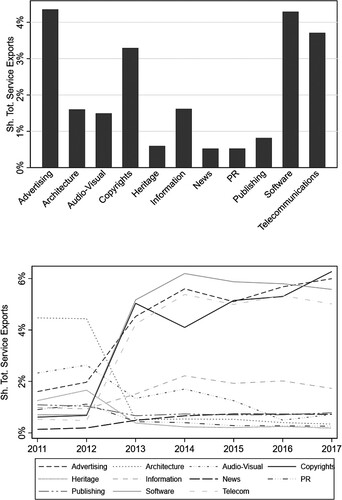
In 2011, only two creative services were in the top 10 most exported in the UK (see Table A2 in Appendix A in the supplemental data online): architectural services, which accounted for 4.5% of services exports, and audio-visuals (2.35%). By 2017, creative services had become much more important, with copyrights (6.3%), advertising (6.0%), software (5.6%) and telecommunications (5.0%) among the top 10 services exported.
Focusing on creative services exports, shows that over the period 2011–17 creative services exports accounted for about 30% of total UK services exports. Exports of advertising services, copyrighted creative works, telecommunication services and computer software have mostly driven creative services exports, accounting for around 5% of total services exports each. In addition, we note a rapid increase in the share of services in four of the sectors which form the top 10: copyrights, advertising, software and telecommunications, while a relative decline in the share of architectural and audio-visual services exports. The remaining creative services exports remained stable below 2% of total UK services exports throughout the period. For instance, in 2016 the UK exported £439 million of architectural services; however, these only represented 0.3% of total service exports (GLA, Citation2018). There are still many barriers preventing architectural practices from taking the first steps to international expansion. Visa restrictions and a lack of mutual recognition agreements for architects’ qualifications outside of the European Union (EU) are amongst the biggest barriers for working in overseas markets. Another barrier faced by especially small practices is being unprepared both financially and in terms of skills and expertise to work in other countries. Moreover, as architecture is a highly regulated profession, different regulatory environments further complicate overseas work (The Royal Institute of British Architects (RIBA), Citation2018).
Figure 1. Share of creative services exports over total services exports in the UK, average and change over the period 2011–17.
Note: Statistics are elaborated using data from the Inquiry in International Trade in Services (ITIS) database. The share is given by the average ratio between creative services exports over total services exports in the UK over the period 2011–17.
We then consider the top 10 destinations for all services and creative services (see Table B1 in Appendix B in the supplemental data online). The United States dominates both lists for service and creative service exports, being responsible for around 23% of service exports and 20% of creative service exports, followed by Germany (6.3% and 7.4%) and Switzerland (6.1% and 5.7%). Sweden, Spain and Norway are amongst the top destination for only creative service exports. We note that seven of the top 10 creative service destinations are in the EU, collectively accounting for around 30% of total creative service exports. The European Single Market is indeed the most integrated area for trade in services in the world. Although member states have regulatory powers, their rules do not generally discriminate or prohibit access to their markets. For example, when the UK was still part of the EU, a programmer in the UK could work for Spanish software companies or an Italian architectural business and was free to establish a subsidiary in the UK and manage a branch in Czechia. In the EU, freedom to provide services is supported by the free movement of people, as well as cross-cutting and sector-specific rules on mutual recognition of professional qualifications and common rules on data. Given the lack of a trade agreement on services between the UK and the EU post-Brexit, the introduction of cross-border regulations and restrictions could potentially create major disruption to exports towards the EU in such an increasingly important sector of the UK economy.
Additional information on firms’ manufacturing exports was obtained through the ABS dataset (ONS, Citation2021b), consisting of a census of large firms with more than 250 employees, and a representative sample of medium and small firms. Data were weighted and collapsed in order to calculate the total turnover of exporting firms across 10 manufacturing industries resulting from the aggregation of Standard Industrial Classification (SIC) 2 classification sectors: food manufacturing (SIC codes 10–12), textiles manufacturing (13–15), wooden products manufacturing (16–18), chemicals (19–23), metals (24, 25), computers (26), electric equipment (27), machineries (28), transport equipment (29, 30), and other manufacturing (31–33).Footnote4 In this way we provide estimates of Great Britain exports for 11 creative services, 10 other services and 10 manufacturing industries across 39 NUTS-2 regions.
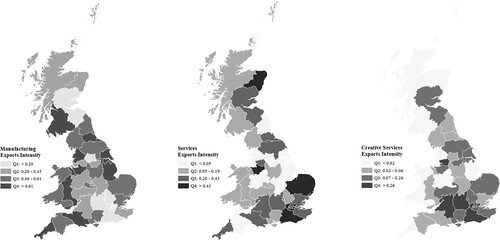
From a spatial point of view, shows that the geographical distribution of creative services exporters is quite different from those of manufacturing and other services exporters. While manufacturing exports are more evenly distributed across space, with higher intensities in the South West, Wales, the Midlands, the North East, and West and South West of Scotland, service exports are focused mostly around urban areas, in particular around London and the South East, Cambridgeshire and Oxfordshire, as well as the Greater Manchester area and East Scotland. For instance, in 2016 London's service exports accounted for £117.3 billion, which represented nearly half of the UK's total export of services. Financial services, travel services, real estate, and the professional, scientific and technical services sectors were London's largest exporting sectors (ONS, Citation2018). Indeed, services, which benefit from urbanization economies, tend to concentrate in larger cities with high density of different economic activities because of proximity to costumers, the availability of highly educated employees and learning dynamics arising from co-located firms (Boschma & Frenken, Citation2011). However, creative services exports are even more geographically clustered, mainly in London and the South East, Oxfordshire, Greater Manchester and Yorkshire. This partially reflects the geographical distribution of CIs, which have a dominant presence in the South East and London, which alone accounts for around 40% of creative industry employees and a third of creative businesses (Mateos-Garcia & Bakhshi, Citation2016).
Figure 2. Spatial distribution of creative, other services and manufacturing exports, 2011–17.
Note: Statistics are elaborated using data from the Annual Business Survey (ABS) and Inquiry in International Trade in Services (ITIS) databases. Manufacturing, services and creative service exports intensities have been normalized and averaged over the period 2011–17.
4. REGIONAL SPECIALIZATION AND RELATEDNESS ANALYSIS
The different geographical distribution of manufacturing, creative and other services exports could provide relevant insights regarding the potential complementarity and similarity between different types of exports. Thus, we follow the established stream of economic complexity and relatedness research (Hidalgo et al., Citation2007; Hidalgo & Hausmann, Citation2009; Neffke et al., Citation2011) in the economic geography literature to estimate the relatedness between these exporting activities and the evolution of UK regions industrial specialization based on their spatial distribution across regions.
To estimate the relatedness between creative services, other services and manufacturing exports, we followed the methodology proposed by Breschi et al. (Citation2003) based on co-occurrence analysis, as seminally started by Jaffe (Citation1989) and developed broadly since (Bryce & Winter, Citation2009; Hidalgo et al., Citation2007; Teece et al., Citation1994). We investigated the frequency with which exports of creative services i and non-creative services and manufacturing exports j co-locate across regions relative to all other exports, analysing the RCA of UK NUTS-2 regions exports. Co-occurrence analysis measures the relatedness between two exporting activities by assessing whether they are often found together in the same local economic entity. The assumption is that the frequency by which two products and services are jointly exported from the same regions can be interpreted as a sign of the strength of their relationship, in terms of production processes implemented, inputs of production used, technologies developed, skills required, complementarity and final markets targeted.
First, we measure the RCA of region r in exporting product i based on the Balassa index (Balassa, Citation1965; French, Citation2017):
Starting from the value of total exports of product i in region r (
), this index simply computes the relative share of product i in the total exports basket of region r, (
) compared with the relative importance of product i in the total exports of the country. Thus, a region r will have a comparative advantage in the export of product i in respect to all other regions within the same country only if
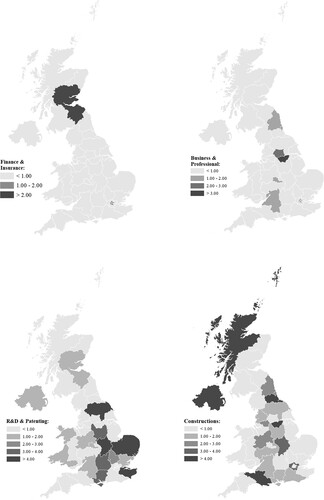
. The RCA index has been initially developed in international economics for calculating the relative advantage or disadvantage of countries in a certain class of goods or services, based on Ricardian comparative advantage, but has been recently applied in other fields, including estimating the industrial specialization of regions (Hidalgo & Hausmann, Citation2009). maps the RCA of regions in some of the main non-creative services exports, namely financial and insurance, business and professional, R&D and patenting, and construction services. Financial services are clearly the most concentrated – in Inner London and Eastern Scotland (Edinburgh). Similarly, we find evidence of RCA for business and professional services primarily in urban regions, as inner London, South Yorkshire (Sheffield), West Yorkshire (Leeds), the North East (Newcastle), the West Midlands (Birmingham) and Bristol. In contrast, regions with high RCA in the export of R&D and patenting services are located across the UK and Northern Ireland. On the contrary, the distribution of RCA in the exports of construction services is quite heterogeneous, but mainly focused in non-urban regions, such as Shetland and Orkney, Northern Scotland, Northern Ireland and much of rural England.
Figure 3. UK regions revealed comparative advantage (RCA) in exports of services, 2011–17.
Note: Statistics are elaborated using data from the Inquiry in International Trade in Services (ITIS) database.
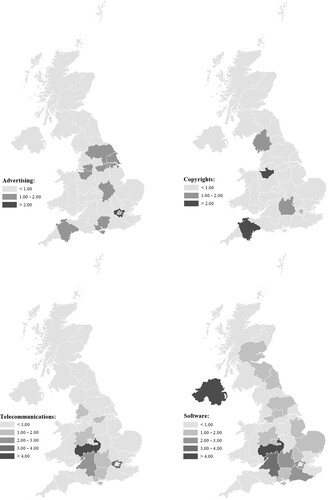
Patterns of regional specialization in creative service exports are instead given in . These show pronounced but relatively distinct geographies. Only four regions have a high RCA in copyrights: Cheshire, possibly due to a strong computer games sector, Devon, Cumbria and Inner London. For advertising, Inner and Outer London have strong RCA, as do Lancashire, Leicestershire, Rutland and Northamptonshire, Hampshire and the Isle of Wight, and Devon. On the contrary, many regions register an RCA in the exports of software services, widely dispersed across the country, including Northern Ireland, Herefordshire, Worcestershire and Warwickshire, and much of the South East (excluding London) and Eastern Scotland. Finally, regions with a high RCA for the exports of telecommunication services include the stretch of Western England running north from Hampshire and the Isle of Wight to Shropshire and Staffordshire, Lancashire and South Yorkshire (Sheffield).
Figure 4. UK regions revealed comparative advantage (RCA) in exports of creative services, 2011–17.
Note: Statistics are elaborated using data from the Inquiry in International Trade in Services (ITIS) database.
Second, we measure the number of occurrences region r has a joint comparative advantage both in the export of product i and j, relative to all other regions and products combinations. We indicate the number of co-occurrences between the RCA of exports of creative services i and of other services or manufacturing product j across NUTS-2 regions r as . By applying this count of joint RCA occurrences to all possible pairs of products and services exported, we obtained a square symmetrical matrix of co-occurrences (C), whose generic cell
reports the number of times these products and services have jointly an RCA in the same regions. This matrix of RCA co-occurrences was then used to derive a measure of relatedness between creative services, other services and manufacturing exports using the cosine index
which measures the angular separation between the vectors representing the co-occurrences of RCA for creative services i and for non-creative services or manufacturing product j exported. As the simple correlation coefficient, the cosine index provides a measure of the similarity between two exported products and services, in terms of their mutual relationships with all the other exports, with the advantage of being symmetric. The final measure
is greater the more the two exported products or services i and j have an RCA co-occurrence in the same regions.
The cosine index
gives us a bilateral measure of relatedness between two exported products or services i and j. Being agnostic about the source of relatedness could undermine the validity of the analysis by generating ‘false positives’ where co-occurrences arise for reasons other than relatedness. However, a vast empirical literature has shown the robustness of this methodology in identifying linkages and relatedness between occupations (Diodato et al., Citation2018; Jara-Figueroa et al., Citation2018), products exported (Hidalgo et al., Citation2007), tasks (Teece et al., Citation1994), industries (Corradini & Vanino, Citation2021; Neffke et al., Citation2011) and patents (Kogler et al., Citation2013; Whittle & Kogler, Citation2020). All these studies and evidence corroborate the so-called ‘principle of relatedness’, showing how many different, but related, measures of relatedness applied to different contexts are all valid to describe the strength of linkages between economic activities as a function of the number of related activities present across locations, with pros and cons linked to the different spatial scales, type of economic activities, and the variety of institutional regimes (Hidalgo et al., Citation2018). In addition, by focusing on co-location of RCAs based only on exports of tradable goods and services, rather than simple employment, we limit the concerns related to outliers emerging from the co-location of ancillary non-tradable economic activities, which are evenly distributed across the country and co-locate for reasons other than relatedness. Finally, to make sure that our results are not driven by the uniqueness of the relatedness measure employed in this study, we replicate our analysis using alternative measures, such as the Teece et al. (Citation1994) index of industrial relatedness and the Neffke et al. (Citation2011) measure of revealed relatedness.Footnote5
We are then able to consider the relatedness between creative, other services and manufacturing exports across the whole economy in and and . Essentially each of these shows the two sectors which have the highest export relationship, that is, where exports in an industry tend to happen in the same place as exports in another industry. While we are agnostic about the precise mechanisms driving this relatedness, and there is a chance that false positives may arise, these relationships are likely to be driven by economic relatedness. As mentioned earlier in the text, services and manufacturing have become growingly intertwined over time. Manufacturing firms not only use services as inputs in their production process but also increasingly provide services. Moreover, service industries growingly use the output of manufacturing industries to provide their activities more efficiently. This is reflected in the geography of exports. In addition, many industries share nowadays very similar pool of skills and human capital.
Figure 5. Average relatedness indexes between UK manufacturing, creative and other service exports, 2011–17.
Note: Statistics are elaborated using data from the Annual Business Survey (ABS) and Inquiry in International Trade in Services (ITIS) databases. In light grey are the creative services: C1, Advertising; C2, Public relations; C3, Copyrights; C4, Telecommunications; C5, Software; C6, Publishing; C7, News agency; C8, Information services; C9, Audio-visuals; C10, Heritage and recreational services; and C11, Architectural services. In dark grey are other services sectors: S1, Agri and manufacturing supporting services; S2, Business and professional services; S3, R&D and patenting services; S4, Postal services; S5, Construction services; S6, Financial and insurance services; S7, Trading services; S8, Personal services; S9, Technical and scientific services; and S10, Other services. In mid-grey are the manufacturing services: M1, Food manufacturing; M2, Textiles; M3, Wooden products; M4, Chemicals; M5, Metals; M6, Computers; M7, Electric equipment; M8, Machineries; M9, Transport equipment; and M10, Other manufacturing. Edges represent linkages between manufacturing, creative and other service exports in the top quartile of the relatedness distribution. The location of nodes is determined using an LGL algorithm.
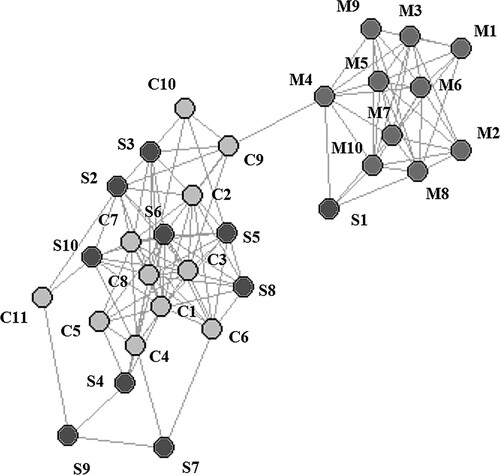
Table 1. Top 10 relatedness indexes between manufacturing and services exports.
Table 2. Top 10 relatedness indexes between creative, other services and manufacturing exports.
The strongest relatedness between exports is between a creative and another service, specifically between finance and insurance and news agency services. The finance and insurance sector is one of the main drivers of the economy, in which the UK is an international leader, exporting services beyond Europe. News agency services instead include the provision of news, photographs and feature articles to the media, in which the UK has a long-lasting tradition and comparative advantage. The two sectors could be strongly related due to their mutual reliance in the production process, as well as the sharing of human capital and other capabilities for rapid information gathering and processing. Most of the other strongest relatedness involve industry pairs within the same broad sector, as metals and chemical in manufacturing, which have been shown to be increasingly linked from a technological point of view (Kogler et al., Citation2013), construction and finance within services, interlinked in real estate developments, or architecture and heritage within creative services. However, we see that architecture creative services are also strongly related with construction services, as expected, highlighting the strongest link between creative and other services. Considering the links between manufacturing and services, we notice a strong relatedness between manufacture supporting services and several manufacturing exports, important evidence of the growing trend in manufacturing industries discussed above consisting in intertwining the sale of manufacturing goods together with the related post-sale assistance and supporting services for customers.
focuses instead on the specific relatedness links between creative services and other industries exports. Public relations and News agency services tend to be highly related with several industries, both in creative and in other services. For instance, Public relations and Heritage exported services are strongly related, as both are based on the use of very similar set of skills, as the organization of events, management and dissemination of information, design and other artistic capabilities. Also audio-visuals and advertising are highly related to other services. This can be explained by the fact that advertising services are generally used by consumer-oriented services to be better placed in the sales market (ECSIP Consortium, Citation2014). This is also in line with previous research that has highlighted co-location patterns and knowledge spillovers between advertising and these creative sectors in the UK (Chapain et al., Citation2010).
shows the structure of the network of relatedness between UK manufacturing, creative and other service exports, using a large graph layout (LGL) algorithm identifying disconnected clusters in the data, and laying them out radially starting from a seed node, where for clarity the reported edges represent only relatedness linkages in top quartile of the distribution. Our analysis suggests that creative services are mostly linked with other services exports, although we identify a close relatedness between architecture, audio-visual and heritage creative services with other manufacturing industries exports, even though at a lower level than within broad services sector industry pairs. However, these findings indicate how the exports of manufacturing goods and creative services could be growingly intertwined and could be correlated with patterns of re-specialization of regions from manufacturing to services hubs. As a result, these findings could form an evidence base to develop regional diversification strategies from mature manufacturing industries and services to the exports of related globally competitive creative services.
While the analysis above considers the relatedness between creative services and other services and manufacturing exports for Great Britain as a whole on an industries pair-by-pair basis, we can also identify how creative services overall are linked to the industrial structure of individual regions across the country. This would help us to understand how creative services exports build upon the existing industrial specialization of regions in other services and manufacturing exports beyond the specificity of each industries pair, identifying in this way which regions have the capabilities, skills and knowledge to foster creative services exports. To do so, we calculated for each region r the overall density of relatedness between creative services exports and all other manufacturing and other services exports. Following Hidalgo et al. (Citation2007) and Boschma et al. (Citation2015), the relatedness density of each given creative service exports i in region r is derived from the relatedness of each exported creative service i to all other exports j in which the region has relative comparative advantage, divided by the sum of the relatedness of creative service exports i to all the other exports j in Great Britain:
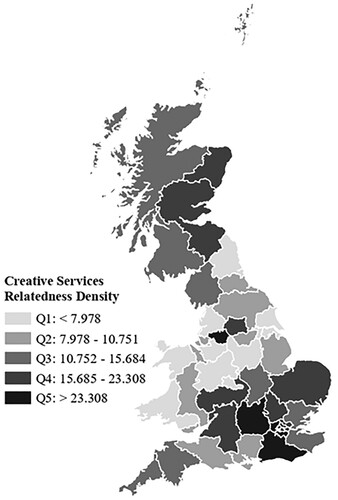
reports the average relatedness density of creative services exports across regions in Great Britain, considering the relatedness between creative service exports and all other exports in which each region has a comparative advantage. It is possible to notice that creative services exports are strongly related with the rest of the regional industrial structure, particularly in urban areas (London, Manchester, Edinburgh, Leeds) and in hubs of knowledge creation (East Anglia, Oxfordshire, Surrey, Sussex and Warwickshire – although not the wider West Midlands), where universities and knowledge intensive industries are mostly clustered. These industries could provide the knowledge spillovers, skills and capabilities needed for creative services to develop and grow, allowing the hosting regions to become international hubs for creative services. Existing comparative advantage in manufacturing and other services exports could play a key role in creating the right environment for regional branching in related creative services, allowing regions to diversify away from mature industries and specialize in new creative and knowledge intensive services sectors which are becoming increasingly important in the UK international trade.
Figure 6. Average relatedness density of creative services across UK regions, 2011–17.
Note: Statistics are elaborated using data from the Annual Business Survey (ABS) and Inquiry in International Trade in Services (ITIS) databases.
5. CREATIVE SERVICES, RELATEDNESS DENSITY AND SPECIALIZATION
Next, we analyse whether the relatedness between creative, other services and manufacturing exports plays a role in shaping the emergence of new comparative advantages, particularly in the industrial branching of regions towards knowledge-intensive, high added-value creative services. Previous studies have analysed how the relatedness between new and existing sectors could facilitate regional diversification and industrial branching (Balland et al., Citation2019; Corradini & Vanino, Citation2021; Drivas, Citation2022; Xiao et al., Citation2018). Following these studies, our final aim is to detect whether the relatedness density of an industry with the rest of the regional industrial portfolio correlates with the emergence of a new comparative advantage in the region. More specifically, we would like to test whether this relationship is stronger in the case of creative services, and to detect whether creative services need stronger ties with specific existing industries to bloom.
To achieve this, we employ regression analysis to estimate the relationship between relatedness density and regional diversification, while controlling for other possible confounding factors using the following model:
In this model, we predict the emergence of a comparative advantage
in the export of industry i by region r in year t, based on the relatedness density of that industry
with the rest of the industrial portfolio of region r in the previous year t – 1. To correctly estimate this relationship, we control for the total value of exports from that industry in the previous year
, as well as for any other time-invariant characteristics of industry i in region r by including industry–region fixed effects
. In addition, we control for region or industry specific shocks which might explain the emergence of comparative advantages, including region (
) and industry (
) specific time trends.
presents the results of this estimation and of additional robustness and heterogeneity tests. We start in column 1 simply by testing the validity of the relationship between relatedness density and the emergence of a regional comparative advantage for all sectors. Our results are in line with previous studies, identifying that overall relatedness density is positively related with a higher probability that a region specializes in a new exporting sector (Balland et al., Citation2019; Drivas, Citation2022). In addition, the inclusion of strict fixed effects and region and industry time trends allows us to explain a much larger proportion of the dependent variable's variance in respect to previous related studies, limiting the impact of omitted variable bias. Then, in column 2, we focus specifically on creative services exports, to understand whether specialization in these industries is relying more or less on linkages with the rest of the industrial structure of a region than in the general case. Again, we find a positive and significant relationship between relatedness density and the emergence of a comparative advantage in creative services. Our estimate suggests that a 10 unit increase in the relatedness density of a creative service exports with the rest of the goods and services exported by a region would increase the probability of developing a new comparative advantage in the export of that creative service by 3.4%. As a rule of thumb, a 10-unit increase in creative services relatedness density would be equivalent to creative services exports in North Yorkshire (with a relatedness density of 10.38 in the 40th percentile of the distribution) being related to all other exports in the region as creative services exports are in Warwickshire (20.31, in the 70th percentile). The magnitude of this relationship for creative services is more than double, and statistically different from, the coefficient estimated in the general case. This is a significant result, highlighting how important the relatedness with other surrounding industries is for creative services to thrive in a region.
Table 3. Relationship between relatedness density and regional comparative advantage of creative services export.
However, as previously discussed, we are interested in understanding not only with which other sectors creative services are particularly related, but also if these specific industry-to-industry relationships matter to explain the specialization of regions in creative services. Thus, in column 3 we dissect relatedness density for creative services industries in its three components: relatedness density with other creative services, with other services and with manufacturing industries. Our results indicate that the relatedness density with other services industries in the region is the only significant to explain a higher probability of specializing in creative services, as a 10-unit increase in the relatedness density with other services would increase the probability of developing a comparative advantage in the export of creative services by 7%. This is in line with our previous relatedness analysis in , that has shown a stronger relatedness between creative services and other services, rather than with other creative services or manufacturing exports. Thus, it appears that creative services benefit mostly from spillovers generated from nearby other services industries, possibly in terms of labour skills pooling and the possibility of synergies around the sale of services abroad, as UK creative and non-services could be in high demand in the same markets and face similar restrictions to trade.
Finally, in columns 4 and 5 we study the spatial heterogeneity of this relationship, differentiating between regions in the South East of England (including London) and the rest of Great Britain. We split the country in this way following the relatedness density analysis reported previously in , showing a spatial clustering of high levels of relatedness density for creative services in the South East of England. The results of our estimations show a significant and positive relationship between relatedness density and specialization in creative services exports only for regions outside the South East of England, where usually the relatedness density of creative services with the rest of the local economy is weaker. This evidence could be linked to two different factors. First, as seen in , this might be due to a crowding effect, as many regions in the South East have already a comparative advantage in creative services, and thus it might be more difficult to develop further specialization in these sectors. Second, this might be evidence of a non-linear relationship between relatedness density and specialization in the case of creative services, where a stronger relatedness density with the rest of the local economy could be particularly important for the specialization in creative services, in particular in regions where the existing industrial base is not strongly related to creative services. These regions will need thus to first create a more conductive environment to foster creative services exports, developing an industrial base which is related to creative services, and from which these services could benefit from potential positive externalities.
6. CONCLUSIONS
This paper has presented new evidence on exports of creative services from the UK, geographical clusters, and relatedness between the exports of creative, non-creative services and manufacturing goods. Creative services have become growingly important in the UK, but there has been some volatility with exports changed significantly in the aftermath of the crisis. While in 2011 only one creative service (architecture) was in the top ten of the most exported services, by 2017 copyrights, advertising, software and telecommunications had all climbed positions in the list, being included amongst the key UK service export industries. Over the last decade, international trade in UK advertising has increased by more than 200%. As for services, the largest destination of creative service exports is the United States, but much of these exports go to the EU.
The geographical distribution of creative services exports differs considerably from those of manufacturing and non-creative services exports. While manufacturing exports are more evenly distributed across space and non-creative service exports tend to focus around urban areas, creative services exports are the ones more geographically clustered in a few areas, mainly London, the M4 corridor between London and Bristol, and Greater Manchester. There is pronounced spatial variation in these exports, with the geography of RCAs differing across each industry but, in general, London is as important focal point for creative service exports.
Findings from co-occurrence analysis suggest that a few creative services sectors seem to have high levels of relatedness with other creative, non-creative services and manufacturing industries, interpreted as a sign of the strength of production relationship in terms of knowledge, inputs or complementarities. The strength of these relationships between creative services and the rest of the local industrial structure is particularly important for the emergence of new specializations in creative services exports, highlighting how important the relatedness with other surrounding industries is for creative services to thrive in a region, in particular the closeness with clusters of other non-creative services in regions where the creative services are not strongly developed yet.
Our findings provide new evidence of the UK role as a global hub for creative services. Future developments in ICTs and, particularly, innovation in digital services, in addition to recent government investments in the promotion of CIs exports are likely to further boost trade growth in this UK sector. Indeed, the UK CITIB has been recently launched as part of the government's Modern Industrial Strategy with the aim of increasing the value of exports of creative services and goods by 50% between 2018 and 2023, giving priority to the export markets of China, the United States, Europe, the Middle East and Japan (CITIB, Citation2019). Support to international trade is particularly important for the CIs as these are comprised of a large variety of subsectors with specific needs and many small and micro-businesses. In this regard, this work provides some first evidence of the relationships between creative, non-creative services and manufacturing industries, which can help better understand trade dynamics and interactions of different creative subsectors in order to contribute to their international promotion.
Our research opens a number of areas for future research. First, our work has considered the UK, a country with strong strengths in creative services but also pronounced regional disparities. Future comparative work would help understand the extent to which these results are UK specific. Second, while there are multiple studies which consider the mechanisms underpinning relatedness, none is specific to the CIs. Future work could address this important gap. In doing so it could address a third problem inherent in the literature on relatedness, as we are assuming that (1) relationships at a local level are based on some productive relationship rather than mere happenstance, and (2) that relationships are only between exporters, although it is likely that exporters might use related services from non-exporting firms.Footnote6 These complex relationships are likely to be revealed through case-specific qualitative research.
At the time of writing, the UK's trade in creative services faces two major challenges – Brexit and the COVID pandemic. Brexit means that there is considerable uncertainty about the UK's future trade regimes. The EU is a key trading partner, with approximately 30% of creative service exports going to the EU. Trade in services under the WTO GATS terms (i.e., no-deal scenario) would mean reduced access to EU markets for UK service producers, as the WTO has made far less progress than the EU in terms of service liberalization (Ilze et al., Citation2019). Therefore, in addition to future additional government efforts to promote international exports of creative services, ensuring a favourable trade in services deal with the EU is key to the future global competitiveness of the sector (European Union Committee, Citation2017). These problems will be compounded by the aftermath of the COVID pandemic. It is far from clear what the long-term impact of the pandemic will be, yet economic growth is probably the best way to address the fiscal problems which it has created. For the UK, creative services are an important potential source of this growth. It may be that the technological shock of the pandemic, which forced the uptake of new digital technologies, provides an opportunity to increase trade in creative services still further. The question is the extent to which Brexit will hinder the ability of creative service exporters and so stifle the recovery.
Supplemental Material
Download PDF (30.2 KB)ACKNOWLEDGEMENTS
The authors are grateful for the comments received at the GEOINNO 2020 Conference in Stavanger.
DISCLOSURE STATEMENT
No potential conflict of interest was reported by the authors.
Additional information
Funding
Notes
1. In 2017, the world's top services exporter was the United States, representing 15% of global exports, while the UK, Germany and France jointly captured 17% of the world market. The top five developing economies were China, India, Singapore, Hong Kong and the Republic of Korea, which held a world market share of almost 15%, the same as all other developing economies combined (McKinsey Global Institute, Citation2019; UNCTAD, Citation2018b).
2. The ITIS dataset does not provide information about whether services sold to non-UK based entities are then used abroad or in the UK market, for instance, to support non-UK based entities in their activities in the UK.
3. We define regions using the NUTS-2 nomenclature. We use this level following previous studies on interregional trade (Thissen et al., Citation2019), relatedness and regional specialization (Balland et al., Citation2019; Drivas, Citation2022; Innocenti & Lazzeretti, Citation2019; Xiao et al., Citation2018), and to assure the representativeness of the data at the region and industry levels. Northern Ireland was excluded from the analysis due to lack of data.
4. Data for manufacturing industries are based on the ABS database reporting the turnover of exporting firms in each industry, while for services industries we use the ITIS database providing information on the value of exports of firms for each service category. These two sources of data are not directly comparable. However, they can be used in order to first identify the comparative advantages of regions in each of the categories, and to then use these to analyse co-occurrence patterns between manufacturing and services exports. As an alternative approach, we used data provided by HM Revenue & Customs (HMRC) on the value of manufacturing exports per region and broad product category. However, the product classification used by HMRC is of limited application in this analysis because it makes meticulous distinctions between products of marginal interest from a UK manufacturing perspective (e.g., crude materials, mineral fuels, lubricants, animal and vegetable oils), while aggregating together products at higher added value usually produced by UK manufactures (e.g., no distinction between machinery, transport equipment, computers and other electric equipment).
5. The use of different relatedness measures yields consistent results, which are available from the authors upon request.
6. We are grateful to an anonymous reviewer for this point.
REFERENCES
- Abbasi, M., Vassilopoulou, P., & Stergioulas, L. (2017). Technology roadmap for the creative industries. Creative Industries Journal, 10(1), 40–58. https://doi.org/10.1080/17510694.2016.1247627
- Abreu, M., Grinevich, V., Kitson, M., & Savona, M. (2008). Taking services seriously: How policy can stimulate the ‘hidden innovation’ in the UK’s services economy. National Endowment for Science, Technology and the Arts.
- Bahar, D., Hausmann, R., & Hidalgo, C. A. (2014). Neighbors and the evolution of the comparative advantage of nations: Evidence of international knowledge diffusion? Journal of International Economics, 92(1), 111–123. https://doi.org/10.1016/j.jinteco.2013.11.001
- Baines, T., Ziaee Bigdeli, A., Bustinza, O. F., Shi, V. G., Baldwin, J., & Ridgway, K. (2017). Servitization: Revisiting the state-of-the-art and research priorities. International Journal of Operations & Production Management, 37(2), 256–278. https://doi.org/10.1108/IJOPM-06-2015-0312
- Bakhshi, H., McVittie, E., & Simmie, J. (2008). Creating innovation: Do the creative industries support innovation in the wider economy? National Endowment for Science, Technology and the Arts (NESTA).
- Balassa, B. (1965). Trade liberalisation and ‘revealed’ comparative advantage. The Manchester School, 33(2), 99–123. https://doi.org/10.1111/j.1467-9957.1965.tb00050.x
- Balland, P. A., Boschma, R., Crespo, J., & Rigby, D. L. (2019). Smart specialization policy in the European Union: Relatedness, knowledge complexity and regional diversification. Regional Studies, 53(9), 1252–1268. https://doi.org/10.1080/00343404.2018.1437900
- Berg, S., & Hassink, R. (2014). Creative industries from an evolutionary perspective: A critical literature review. Geography Compass, 8(9), 653–664. https://doi.org/10.1111/gec3.12156
- Boix, R., De-Miguel-Molina, B., & Hervas-Oliver, J. L. (2013). Creative service business and regional performance: Evidence for the European regions. Service Business, 7(3), 381–398. https://doi.org/10.1007/s11628-012-0165-7
- Boix-Domenech, R., & Soler-Marco, V. (2017). Creative service industries and regional productivity. Papers in Regional Science, 96(2), 261–280. https://doi.org/10.1111/pirs.12187
- Boschma, R., Balland, P. A., & Kogler, D. F. (2015). Relatedness and technological change in cities: The rise and fall of technological knowledge in US metropolitan areas from 1981 to 2010. Industrial and Corporate Change, 24(1), 223–250. https://doi.org/10.1093/icc/dtu012
- Boschma, R., & Frenken, K. (2011). The emerging empirics of evolutionary economic geography. Journal of Economic Geography, 11(2), 295–307. https://doi.org/10.1093/jeg/lbq053
- Bryce, D. J., & Winter, S. (2009). A general interindustry relatedness index. Management Science, 55(9), 1570–1585. https://doi.org/10.1287/mnsc.1090.1040
- Breschi, S., Lissoni, F., & Malerba, F. (2003). Knowledge-relatedness in firm technological diversification. Research Policy, 32(1), 69–87. https://doi.org/10.1016/S0048-7333(02)00004-5
- British Council. (2019). Soft power of the creative industries. https://www.britishcouncil.org/research-policy-insight/insight-articles/soft-power-creative
- Casadei, P., & Lee, N. (2020). Global cities, creative industries and their representation on social media: A micro-data analysis of twitter data on the fashion industry. Environment and Planning A: Economy and Space, 52(2), 1195–1220. https://doi.org/10.1177/0308518X20901585
- Chapain, C., Cooke, P., De Propris, L., MacNeill, S., & Mateos-Garcia, J. (2010). Creative clusters and innovation: Putting creativity on the map. National Endowment for Science, Technology and the Arts (NESTA).
- Cohendet, P., Grandadam, D., Simon, L., & Capdevila, I. (2014). Epistemic communities, localization and the dynamics of knowledge creation. Journal of Economic Geography, 14(5), 929–954. https://doi.org/10.1093/jeg/lbu018
- Corradini, C., & Vanino, E. (2021). Path dependency, regional variety and the dynamics of new firm creation in rooted and pioneering industries. Journal of Economic Geography, 22(3), 631–651. https://doi.org/10.1093/jeg/lbab021
- Creative Industries Trade and Investment Board (CITIB). (2019). International strategy for the UK creative industries. https://www.thecreativeindustries.co.uk/media/529975/cic_3yr_export_strategy_v3_singles.pdf
- De Backer, K., Desnoyers-James, I., & Moussiegt, L. (2015). Manufacturing or services: That is not the question (Science, Technology and Innovation Policy Paper No. 19). OECD Publ.
- De Backer, K., & Flaig, D. (2017). The future of global value chains: Business as usual or ‘a new normal’? (Science, Technology and Industry Policy Paper No. 41). OECD Publ.
- De Propris, L., Chapain, C., Cooke, P., MacNeill, S., & Mateos-Garcia, J. (2009). The geography of creativity. National Endowment for Science, Technology and the Arts (NESTA).
- Department for Culture, Media & Sport (DCMS). (1998). Creative industries mapping document 1998. https://www.gov.uk/government/publications/creative-industries-mapping-documents-1998
- Department for Culture Media and Sport (DCMS). (2016). Creative industries: Focus on exports of services.
- Di Novo, S., Fazio, G., & Vermulen, W. (2020). 12 Facts about UK’s international trade in creative goods and services. Creative Industries Policy & Evidence Centre (PEC), National Endowment for Science, Technology and the Arts (NESTA).
- Diodato, D., Neffke, F., & O’Clery, N. (2018). Why do industries coagglomerate? How Marshallian externalities differ by industry and have evolved over time. Journal of Urban Economics, 106, 1–26. https://doi.org/10.1016/j.jue.2018.05.002
- Drivas, K. (2022). The role of technology and relatedness in regional trademark activity. Regional Studies, 56(2), 242–255. https://doi.org/10.1080/00343404.2020.1808883
- ECSIP Consortium. (2014). Study on the relation between industry and services in terms of productivity and value creation. European Commission. https://ec.europa.eu/growth/content/relation-between-industry-and-services-terms-productivity-and-value-creation_en
- European Union Committee. (2017). Brexit: Trade in non-financial services. https://publications.parliament.uk/pa/ld201617/ldselect/ldeucom/135/13502.html
- Fazio, G. (2021). A review of creative trade in the economics literature. Creative Industries Policy and Evidence Centre and University of Manchester.
- French, S. (2017). Revealed comparative advantage: What is it good for? Journal of International Economics, 106, 83–103. https://doi.org/10.1016/j.jinteco.2017.02.002
- Gouvea, R., & Vora, G. (2016). Global trade in creative services: An empirical exploration. Creative Industries Journal, 9(1), 66–93. https://doi.org/10.1080/17510694.2016.1206361
- Greater London Authority (GLA). (2018). London’s architectural sector – Update 2018 (Working Paper No. 93).
- Hajkowicz, S. (2015). Why is the creative economy growing so strongly? The potential of the creative economy. An economic sector to support the realization of inclusive economic opportunities and social cohesion. World Economic Forum (WEF).
- Hidalgo, C. A., Balland, P. A., Boschma, R., Delgado, M., Feldman, M., Frenken, K., Glaeser, E., He, C., Kogler, D. F., Morrison, A., Neffke, F., Rigby, D., Stern, S., Zheng, S., & Zhu, S. (2018). The principle of relatedness. In A. J. Morales, C. Gershenson, D. Braha, A. A. Minai, & Y. Bar-Yam (Eds.), Unifying themes in complex systems IX (pp. 451–457). Springer.
- Hidalgo, C. A., & Hausmann, R. (2009). The building blocks of economic complexity. Proceedings of the National Academy of Sciences, 106(26), 10570–10575. https://doi.org/10.1073/pnas.0900943106
- Hidalgo, C. A., Klinger, B., Barabasi, A. L., & Hausmann, R. (2007). The product space conditions the development of nations. Science, 317(5837), 482–487. https://doi.org/10.1126/science.1144581
- Higgs, P., & Cunningham, S. (2008). Creative industries mapping: Where have we come from and where are we going? Creative Industries Journal, 1(1), 7–30. https://doi.org/10.1386/cij.1.1.7_1
- Hill, T. P. (1977). On goods and services. Review of Income and Wealth, 23(4), 315–338. https://doi.org/10.1111/j.1475-4991.1977.tb00021.x
- Howkins, J. (2002). The creative economy. Penguin Global.
- Ilze, J., Ward, M., & Harari, D. (2019). Trade in services and Brexit. House of Commons Library.
- Innocenti, N., & Lazzeretti, L. (2019). Do the creative industries support growth and innovation in the wider economy: Industry relatedness and growth in Italy. Industry and Innovation, 26(10), 1152–1173. https://doi.org/10.1080/13662716.2018.1561360
- Jaffe, A. B. (1989). Real effects of academic research. American Economic Review, 79(5), 957–970.
- Jara-Figueroa, C., Jun, B., Glaeser, E. L., & Hidalgo, C. A. (2018). The role of industry-specific, occupation-specific, and location-specific knowledge in the growth and survival of new firms. Proceedings of the National Academy of Sciences, 115(50), 12646–12653. https://doi.org/10.1073/pnas.1800475115
- Kemeny, T., Nathan, M., & O’Brien, D. (2020). Creative differences? Measuring creative economy employment in the US and the UK. Regional Studies, 54(3), 377–387. https://doi.org/10.1080/00343404.2019.1625484
- Klement, B., & Strambach, S. (2019a). How do new music genres emerge? Diversification processes in symbolic knowledge bases. Regional Studies, 53(10), 1447–1458. https://doi.org/10.1080/00343404.2019.1580817
- Klement, B., & Strambach, S. (2019b). Innovation in creative industries: Does (related) variety matter for the creativity of urban music scenes? Economic Geography, 95(4), 385–417. https://doi.org/10.1080/00130095.2018.1549944
- Kogler, F. D., Rigby, D. L., & Tucker, I. (2013). Mapping knowledge space and technological relatedness in US cities. European Planning Studies, 21(9), 1374–1391. https://doi.org/10.1080/09654313.2012.755832
- Lee, N. (2014). The creative industries and urban economic growth in the UK. Environment and Planning A: Economy and Space, 46(2), 455–470. https://doi.org/10.1068/a4472
- Lee, N. (2020). Relatedness between the creative industries and the wider economy: A primer (Discussion Paper No. 2020/02). Creative Industries Policy and Evidence Centre.
- Mateos-Garcia, J., & Bakhshi, H. (2016). The geography of creativity in the UK. Creative clusters, creative people and creative networks. National Endowment for Science, Technology and the Arts (NESTA).
- McKinsey Global Institute. (2019). Globalization in transition: The future of trade and value chains. https://www.mckinsey.com/~/media/mckinsey/featured%20insights/innovation/globalization%20in%20transition%20the%20future%20of%20trade%20and%20value%20chains/mgiglobalization%20in%20transition-the-future-of-trade-and-value-chains-full-report.ashx
- Miles, I. (1993). Services in the new industrial economy. Futures, 25(6), 653–672. https://doi.org/10.1016/0016-3287(93)90106-4
- Miroudot, S., & Cadestin, C. (2017). Services in global value chains: From inputs to value-creating activities (Trade Policy Papers No. 197). OECD Publ. https://doi.org/10.1787/465f0d8b-en
- Neffke, F., Henning, M., & Boschma, R. (2011). How do regions diversify over time? Industry relatedness and the development of new growth paths in regions. Economic Geography, 87(3), 237–265. https://doi.org/10.1111/j.1944-8287.2011.01121.x
- Office for National Statistics (ONS). (2018). Estimating the value of service exports abroad from different parts of the UK: 2011 to 2016. https://www.ons.gov.uk/businessindustryandtrade/internationaltrade/articles/estimatingthevalueofserviceexportsabroadfromdifferentpartsoftheuk/24october2018
- Office for National Statistics (ONS). (2021a). International trade in services, 1996–2019: Secure access (Data Collection, 10th Edition. UK Data Service. SN: 6711). https://doi.org/10.5255/UKDA-SN-6711-11
- Office for National Statistics (ONS). (2021b). Annual Business Survey, 2005–2019: Secure access (Data Collection. 15th Edition. UK Data Service. SN: 7451). https://doi.org/10.5255/UKDA-SN-7451-15.
- Royal Institute of British Architects (RIBA). (2018). Boosting the UK’s architectural exports. https://www.architecture.com/knowledge-and-resources/resources-landing-page/riba-policy-note-boosting-the-uks-architectural-exports
- Schöllmann, W. (2015). Economic significance of trade in services. Background to negotiations on a Trade in Services Agreement (Tisa). European Parliamentary Research Service (EPRS).
- Teece, D., Rumelt, R., Dosi, G., & Winter, S. (1994). Understanding corporate coherence: Theory and evidence. Journal of Economic Behaviour and Organization, 23(1), 1–30. https://doi.org/10.1016/0167-2681(94)90094-9
- Tether, B. (2019). Mind the gap: Regional inequality in the UK's creative industries. Creative Industries Policy and Evidence Centre and University of Manchester.
- Thissen, M., Ivanova, O., Mandras, G., & Husby, T. (2019). European NUTS 2 regions: Construction of interregional trade-linked supply and use tables with consistent transport flows (Working Papers on Territorial Modelling and Analysis No. 01/2019, JRC115439). European Commission, JRC (Seville).
- United Nations Conference on Trade and Development (UNCTAD). (2008). Creative Economy Report 2008: The challenge of assessing the creative economy towards informed policy-making. https://unctad.org/en/Docs/ditc2082cer_en.pdf
- United Nations Conference on Trade and Development (UNCTAD). (2010). Creative economy: A feasible development option. https://unctad.org/en/docs/ditctab20103_en.pdf
- United Nations Conference on Trade and Development (UNCTAD). (2017). The role of the services economy and trade in structural transformation and inclusive development. https://unctad.org/meetings/En/SessionalDocuments/c1mem4d14_en.pdf
- United Nations Conference on Trade and Development (UNCTAD). (2018a). Creative economy outlook. Trends in international trade in creative industries. https://unctad.org/en/PublicationsLibrary/ditcted2018d3_en.pdf
- United Nations Conference on Trade and Development (UNCTAD). (2018b). Handbook of statistics. https://unctad.org/en/PublicationsLibrary/tdstat43_ en.pdf
- Wernerheim, C. M. (2010). The tendency of advanced services to co-locate and the implications for regional government policy. The Service Industries Journal, 30(5), 731–748. https://doi.org/10.1080/02642060802253900
- Whittle, A., & Kogler, D. F. (2020). Related to what? Reviewing the literature on technological relatedness: Where we are now and where can we go? Papers in Regional Science, 99(1), 97–113. https://doi.org/10.1111/pirs.12481
- World Economic Forum (WEF). (2018). Creative disruption: The impact of emerging technologies on the creative economy (White Paper).
- World Trade Organization (WTO). (2019). World trade report 2019. The future of services trade. https://www.wto.org/english/res_e/booksp_e/01_wtr19_0_e.pdf
- Xiao, J., Boschma, R., & Andersson, M. (2018). Industrial diversification in Europe: The differentiated role of relatedness. Economic Geography, 94(5), 514–549. https://doi.org/10.1080/00130095.2018.1444989