
 ?Mathematical formulae have been encoded as MathML and are displayed in this HTML version using MathJax in order to improve their display. Uncheck the box to turn MathJax off. This feature requires Javascript. Click on a formula to zoom.
ABSTRACT
We use a triangulation approach combining data on mergers and acquisitions and the labour market with 66 interviews to tease out a decade of changes (2007–17) in corporate control and employment in financial services across 47 major US metropolitan areas. Our results show that while corporate control is rapidly shifting and concentrating within a financial-cum-technological axis of first-tier cities, which we coin the Northeastern Corridor–Bay Area axis, with New York and San Francisco in the lead, significant employment growth took place in second- and third-tier cities, such as Jacksonville, Florida, signalling a changing spatial division of labour in US finance.
1. INTRODUCTION
Financial centres have been studied by financial historians as well as financial geographers (Cassis & Wójcik, Citation2018). Interest in financial centres is underpinned by their central position in capitalist power structures (Dixon, Citation2011). For centuries, financial centres have been pivotal in shaping the rise and fall of cities, regions, and nation-states. Financial relations between New York and London, for example, were instrumental in the Allies’ victory in the First World War (Carter, Citation2020) and, 90 years later, brought global financial stability to its knees (Lee et al., Citation2009).
International financial centres have attracted a growing body of scholarship studying their evolution, competitiveness, networks, and hierarchy on their own and as part of global and world cities (Sassen, Citation2001; Taylor & Derudder, Citation2016). There is also a substantial scholarship dedicated to the study of financial centres at the subnational level (e.g., Lai, Citation2012, on China; Parr & Budd, Citation2000, on the UK). In the US context, although the place of New York in global finance is well documented, the domestic make-up of US financial centres has received less scholarly attention (e.g., Kreston, Citation2014).
The most popular measure of financial centre competitiveness – the global financial centres index (GFCI) – ranked 119 financial centres globally, seven of which were found in the United States, with six in the top 20: New York first, Los Angeles fifth, San Francisco seventh, Chicago 13th, Boston 14th and Washington, DC, 15th. San Diego, the last US financial centre included in the ranking, was ranked 83rd (Z/Yen, Citation2022). In only a year Los Angeles climbed by six and Chicago by seven positions, showing that volatility is a design feature of the GFCI, meant to attract media headlines. This is ensured by the use of a survey of expert opinion, which basically acts as a measure of (shifting) sentiment and fails to capture the inertia prevalent in financial centre development, not to mention their interconnected and complementary rather than purely competitive nature (Wójcik, Citation2013).
Indeed, the tasks and functions of financial services firms are increasingly unbundled and distributed between cities that offer distinct cost advantages for labour, land and infrastructure, unique advantages in terms of tax and regulation, as well as specific workers’ skills and expertise. This geographical unbundling, using a term borrowed from Baldwin’s work on globalization (e.g., Baldwin, Citation2016), has been theorized as part of the spatial division of labour (Massey, Citation1995), and global financial networks (Coe et al., Citation2014), and further documented at the level of the firm (Urban et al., Citation2021), as well as at the industry level (e.g., Dörry, Citation2016, in asset management).
Although the evidence suggests that New York retains a leading position in command and control in financial services provision – for instance, in the case of asset management, New York has in fact experienced a marked increase in global power in the decade following the 2008–09 financial crisis (Haberly et al., Citation2019) – there is growing anecdotal evidence that New York may be facing increasing domestic competition from second- and third-tier cities in the provision of financial skills and expertise (Dixon & Monk, Citation2014; Tett, Citation2018; Urban, Citation2019).
Following the 2008–09 financial crisis, a tightened regulatory environment coupled with increasing scrutiny by clients and their pushback on fees have put financial services firms’ margins under pressure so that the cost of operating large infrastructure and workforces in central business districts of global financial centres such as New York, San Francisco or Boston has become increasingly prohibitive. However, the advantages of retaining control functions in proximity to service providers, supervisors and regulators, exchange platforms, and other actors, as well as some front office operations in proximity to clients, and to non-commodified and/or non-codified knowledge, remain firmly in place (Gertler, Citation2003; Storper & Venables, Citation2004).
In this paper we propose to tease out the implications of these centrifugal and centripetal forces for financial centre development and evolution. Specifically, we examine the footprint of recent changes in the corporate control and employment of the US financial sector, and the implications of these changes and their complex interrelationship for the financial, regional and urban geography of the United States. We use a triangulation approach combining labour market statistics, a unique geocoded mergers and acquisitions (M&A) dataset, as well as 66 interviews to assess employment and corporate control trends in the finance, insurance and real estate sector across 47 large US cities between 2007 and 2017.
The remainder of the paper is structured as follows. We next review scholarship providing spatial perspectives on labour markets and corporate control, in particular in finance. The third section describes our methods and dataset before unpacking our empirical results in the fourth section. The fifth section concludes.
2. REGIONAL PERSPECTIVES ON CORPORATE CONTROL AND LABOUR MARKETS IN FINANCE
Geographical literature on corporate control and labour markets has a long tradition and much of it has been applied to the financial sector. Hoover and Vernon (Citation1959) and Gottmann (Citation1961) describe the growth of financial functions and jobs as part of the office industry and ‘white-collar revolution’ in New York metropolis and megalopolis, respectively. In general cross-industry terms, Hymer (Citation1972) relates the centralization of control within growing multinational companies to the concentration of control functions in world’s major cities, an idea further developed by Friedmann (Citation1986) in the world city hypothesis.
Building on Hymer’s idea, Pred (Citation1977) explains the growth of post-industrial metropolitan complexes, and the increasing concentration of corporate headquarters as a process of cumulative causation. Importantly to our paper, he notes the role of M&As as a transfer of headquarter functions and a factor contributing to large-city rank stability in the US manufacturing:
Much organizational expansion and functional diversification occurs via the integration (by merger or acquisition) of small-city based firms into major corporations based in large metropolitan complexes. Therefore, one would also expect the city-system interdependencies arising from the intraorganizational ties between head offices and other subordinate units to be increasingly concentrated at large metropolitan complexes. The shift of administrative functions from smaller to larger centres following merger or acquisition has been documented for the Netherlands, Sweden and elsewhere.
In one of the first empirical studies mapping corporate control shifts in the US financial sector between the 1920s and 1971, Borchert (Citation1978) shows a major but declining concentration of control. While in the 1920s Northeast and New York City hosted the headquarters of banks accounting for 65% and 40% of total US bank assets, respectively, by 1971 these respective shares fell to 50% and 33%. A higher concentration but a similar decline is documented for insurance and investment. The main centres that gained in terms of corporate control in that half-century were cities in the US West and South. Borchert explains these shifts with demographic and economic rise of these regions, but also with regulation, including the state banking laws, restricting banking operations across state borders. Elsewhere, in the UK, Daniels (Citation1983) documents the rise of financial and business services employment in provincial cities combined with the preponderance of external control and the risk of relocation.
Borchert’s results are a powerful reminder of the significance of politics and history in shaping corporate control patterns. These factors are given careful consideration in Massey’s (Citation1984) spatial division of labour, which extends the notion of corporate control beyond control over money and investment to control over means of production and labour. As such, corporate control is a social as much as an economic and political issue, linked inextricably with the division of labour. Ultimately, local economies are ‘a product of the combination of “layers”, of the successive imposition over the years of new rounds of investment, new forms of activity … roles the local economy has played within wider national and international spatial structures’ (Massey, Citation1995, p. 114).
Geographies of corporate control and labour are also intertwined in Sassen’s (Citation1991) work, which charts the rise of central corporate functions, their outsourcing and concentration in global cities. Financial and business services performing these functions are the main firms concentrated in global cities. The focus on financial and business services remains in the world city network analysis (e.g., Taylor, Citation2004), which emphasizes the role of connectivity as measured through data on corporate office networks. In addition, geographers have analysed the role of digitalization in extending the logic of unbundling and stretching the spatial division of labour in financial and business services (Bryson et al., Citation2013).
The notion of corporate control and its association with key cities has been criticized. Jones (Citation2002) shows the limits to which corporate headquarters can control their multinational operations in financial and business services. Allen (Citation2010) argues that power is not something a city can possess in a zero-sum game, but a relationship or power with rather than over other places. Smith (Citation2014) criticizes the ranking and labelling exercise involved in much global city and world city research. While a nuanced approach to corporate control is necessary, it is important in our view not to throw the baby out with the bathwater. Bassens and van Meeteren (Citation2015), for example, call for such nuance when describing world cities as ‘obligatory passage points’ for capital, echoing Friedmann’s (Citation1986) notion of ‘basing points of capital’.
Our paper proposes to advance these literatures by focusing on the M&As and employment changes in the US financial sector. M&As are the key transactions in the market for corporate control, and have been conceptualized and documented as such by economists and lawyers for over half a century (Manne, Citation1965). In an M&A two companies become one, with a new executive suite and decision-making structure. While this does not necessarily involve a complete centralization of decision-making, not referring to M&As as control shifts would be misleading. The main three groups of reasons why companies undertake M&As are market, efficiency and technology seeking (Motis, Citation2007). As such, they have profound implications for regional and urban development.
The intensity of M&As varies across space and time. In pathbreaking work on the causes and consequences of financial sector consolidation in the United States, Dymski (Citation1999) describes how the US regulation between the 1930s and the 1970s, with the Glass–Steagall Act in the lead, focused on stability and restricted inter-state banking. In the 1980s, US regulation started to gradually allow consolidation within banking and between banks and other financial institutions, in the name of competition and efficiency. Part of the rationale for regulatory change was also to allow financial market integration and geographical diversification by individual banks. An average of 1.7 banks disappeared through the M&As in the United States in the 1980s and the 1990s every day, more than 10,000 banks in total. Dymski’s work makes it clear that the pattern of decentralization documented by Borchert in the 1970s, was later reversed. This raises empirical questions. If the M&As in the financial sector had been slowed down by regulation and are more recent than in other sectors, how does their geographical footprint compare with that in manufacturing, including a shift from Rustbelt to Sunbelt? And how has it been influenced by tax and other local and regional policies?
Research on Europe underscores the significance of M&As in shaping the economic landscape. Boschma and Hartog (Citation2014) demonstrate that M&As were a key driving force of the spatial concentration of the Dutch banking industry between 1850 and 1993. Half of all exits in the Dutch banking sector in 1850–1993 were due to M&As. Amsterdam-based banks were most active in M&As, with the share of Amsterdam in the total number of banks rising. The authors contrast the process of spin-off creation as branching with M&As as de-branching, with both likely to lead to spatial clustering. They do not, however, consider whether what is being clustered is control or labour.
Recent research confirms that the frenzy of the financial sector M&A activity in the United States continued in the 2000s, some of it related to the housing boom (Akhigbe et al., Citation2004; Beccalli & Frantz, Citation2013; DeYoung et al., Citation2009). There is also a significant body of literature in financial economics dedicated to the determinants and firm-level implications of M&A activity (e.g., DeYoung et al., Citation2009; Erel et al., Citation2012), as well as financial geographical studies that look at the role of distance in cross-border (Zademach & Rodríguez-Pose, Citation2009) and domestic M&A transactions (Grote & Umber, Citation2006; Ragozzino, Citation2009). However, there are few academic studies dedicated to M&A activity in financial services in the decade that followed the 2008–09 financial crisis (Contel & Wójcik, Citation2019). Yet recent scholarship on subindustry trends suggests it may well deserve further scrutiny. In asset management new giants such as BlackRock have emerged from aggressive acquisition campaigns in the aftermaths of the financial crisis (Haberly et al., Citation2019), while the too-big-to-fail problem still plagues the banking sector (Ioannou et al., Citation2019).
Moving to research on employment, while we find a significant amount of economic geographic scholarship on the US financial and other advanced business services at the metropolitan level, most predate the 2008–09 financial crisis (e.g., Currid, Citation2006; Gong & Wheeler, Citation2002; Ó hUallacháin & Reid, Citation1996). Yet the financial sector has attracted a lot of speculative attention from commentators interested in the effect of offshoring and technological disruption on labour markets in financial services – in the United States alone, automation was forecasted to claim 200,000 banking jobs over the next 10 years (Noonan, Citation2019). Paucity of research may be due to data availability and methodological difficulties – something we address in more detail in the methods and data section.
To the best of our knowledge, no empirical studies in social sciences have hitherto offered to combine insights into employment and M&A activity in the financial sector. By simultaneously assessing labour and control shifts in financial services at the city level, we examine whether leading financial centres are seeing increasing agglomeration of corporate control functions and how these trends and patterns compare with those in the labour market. We do not hypothesize any simple relationship between control and employment shifts. While efficiency-seeking M&As can be expected to lead to job losses, market- or technology-seeking M&As might not. The development of FinTech as ‘a set of innovations and an economic sector that focus on the application of recently developed digital technologies to financial services’ (Wójcik, Citation2021a, p. 568) amplifies potential for job-cutting M&As. Where the job losses and gains take place depends on circumstances and is open to investigation. The relationship between M&As and employment shifts is complex and needs to be studied to explore this complexity.
3. METHODS AND DATA
We use mixed methods combining primary and secondary data sources. We started with a large global M&A dataset sourced from Dealogic as well as occupational employment statistics (OES) sourced from the Bureau of Labor Statistics (BLS). Dealogic is a leading provider of M&A data, frequently used in publications such as The Economist and the Financial Times. Our M&A dataset covers 11 years of domestic and cross-border M&A transactions, beginning 1 January 2007 and ending 31 December 2017. We define our sectoral focus as finance, insurance and real estate (FIRE). FIRE is a commonly used broad definition of the financial sector (e.g., Meyer, Citation2007). Its subsectors are closely interlinked in a network of input–output relationships (Wójcik, Citation2021b). Boundaries between them are often blurred, for example, in mortgage markets (between banks and real estate companies), and in investments (where banks, insurance, real estate, and specialized investment companies are all involved). Where relevant, we mention subsectoral developments in the analysis.
We focus on 47 metropolitan statistical areas (MSAs) with a population of 1 million or more. In keeping with the literature on corporate control, this helps us concentrate on the urban scale of analysis, while covering over 60% of total FIRE employment in the United States, and an absolute majority of M&As in the sector. Because we are interested in studying spatial patterns of FIRE M&A activity, we retrieved the headquarter locations of all the target-acquirer pairs involving a US FIRE company on both sides of the deal, that is, as a target and an acquirer. As Dealogic does not offer reliable data on corporate headquarter locations, we collected and verified thousands of locations in the database manually. For that reason, we chose to restrict our sample to deals worth US$10 million or more. Otherwise, data collection and cleaning would require years rather than months. Our final sample covers 2616 deals worth a total of US$1.03 trillion.
To probe inter-metropolitan corporate control shifts systematically, we propose a simple proxy measure of net corporate control gains and losses – – as expressed in equation (1) below. Taking New York as an example, our measure is calculated by adding up the value of non-local firms acquired by New York firms and subtracting from it the value of New York firms acquired by non-local firms.
offers a proxy for city-level gains and losses in corporate control in the sector. We note that while our proxy measure provides insights on the flows of corporate control (i.e., how corporate control shifts through time and space between FIRE firms involved in M&A transactions), it does not measure the stocks of corporate control (i.e., the spatial distribution of all FIRE firms’ headquarters at a given point in time).
To study trends in FIRE employment, we manually constructed a group of 23 FIRE occupations from the BLS’s OES main dataset. In 2017, the OES recorded a total 142.5 million jobs distributed among 825 occupations. Our 23 FIRE occupations accounted for 4.39 million nationally of which 2.64 million were found in our sample of 47 large cities. In contrast to sectoral employment data, which aggregate jobs at a firm level and match those to specific sectors or industries (for instance, see BLS’s North American Industry Classification System dataset), the OES data offer high levels of granularity on the composition of labour markets at a metropolitan level. However, it also comes with significant methodological challenges when conducting longitudinal and/or panel analysis. Indeed, occupational classifications as well as MSA boundaries can change through time and require in-depth manual validation and reconciliation (i.e., matching occupations that have been reclassified and/or relabelled as well as reconstructing MSAs’ boundaries to adjust for growth or shrinkage of their catchment area). Given these complexities and time constraints, we have adjusted data for changes in occupational classification and MSA boundaries and constructed a panel with 2162 datapoints covering 23 FIRE occupations across 47 MSAs for 2007 and 2017.
Qualitatively, we conducted 66 interviews with a range of FIRE professionals, consultants, local and regional economic development agencies, regulators, and policymakers in New York, Wilmington (Delaware), Washington, DC, San Francisco, Salt Lake City, and Jacksonville (Florida) in March–April 2019. The first step of our sampling strategy was to use the OES data to select the six cities. The OES and M&A dataset as well as further online research, including corporate websites and LinkedIn, were used to identify key firms and organizations that we reached out to for in-person interviews. In each case, we focused on people with strategic insight and long experience in the industry. The response rate was below 10%, highlighting the challenge of securing expert interviews at this level in the sector. The quantitative material collected prior to interviews helped inform questions for semi-structured interviews, which all included questions concerning the market structure, consolidation, location factors, and the role of M&As.
All interviews were recorded and transcribed. Methodologically, we used triangulation and analysed our quantitative and qualitative data iteratively. This allowed us to fill gaps in both the quantitative and qualitative materials as well as improve the robustness of our analysis (Nielsen et al., Citation2020). In the presentation of our results, quantitative analysis leads, and qualitative evidence follows, with representative quotations selected to illustrate broader patterns and trends. In the results section, we primarily draw insights and direct quotations from the interviews we conducted in New York, the San Francisco Bay Area and Jacksonville as we found that, from a mixed-methods perspective, the three cities offered the most compelling yet contrasting examples of labour and corporate control shifts in FIRE across large US cities. For further details on the interview materials and references for in-text quotations, see Table A1 in Appendix A in the supplemental data online.
4. RESULTS
4.1. Corporate control shifts: inter-metropolitan M&As and the Northeastern Corridor–Bay Area
Our dataset shows that inter-metropolitan deals constituted the most dynamic segment of the US FIRE M&As. Specifically, 61% of the total number of deals closed between 2007 and 2017 were domestic deals. Amongst them, two-thirds were inter-metropolitan, while a third consisted of intra-metropolitan deals. The remaining 39% of the deals were cross-border, three-quarters of which were outward deals – with US FIRE firms acquiring foreign FIRE firms – and a quarter were inward deals. New York and San Francisco intra-metropolitan deals were the most and second most intense relations in our dataset accounting for nearly US$87 billion worth of transactions (9% of the total). This underscores the importance of the two financial centres, both domestically and internationally. The most significant domestic inter-metropolitan activity took place between firms located in New York, Philadelphia, Charlotte and San Francisco. London and Tokyo were the two major centres involved in cross-border deals with US FIRE firms.
Time-series show that the 2008–09 financial crisis had a marked negative effect on cross-border deals as both deal numbers and values contracted after the crisis. Specifically, we find that while pre-crisis foreign FIRE firms were net acquirers of US FIRE firms, the trend was reversed post-crisis. This finding is consistent with foreign firms’ pre-crisis appetite for US financial activity, including subprime mortgage companies and purchases by European banks trying to develop their investment banking units in the US and globally, ultimately contributing to the bubble. Post-crisis, however, US FIRE firms engaged in a flurry of opportunistic acquisitions of distressed foreign FIRE firms, particularly European banks – a trend largely supported by the uneven political and regulatory response observed on the two sides of the Atlantic (Wójcik et al., Citation2022). We also find that US domestic deals were less affected by the crisis. Although the overall deal value contracted year on year between 2007 and 2010, it then recovered rather swiftly with the number of deals markedly increasing, even surpassing the peak observed in 2007. Overall, we find that this resurgence in domestic M&As was primarily driven by a reshuffling of corporate control between major US financial centres (for more data on these trends, see Figure A1 in Appendix A in the supplemental data online).
One notable and surprising finding is that both extremities of the distribution of our NetAcquisitions proxy measure (for full results, see Figure A2 in Appendix A in the supplemental data online), feature major financial centres. Specifically, New York and San Francisco registered the largest net increase in corporate control (+US$76 billion and +US$37 billion, respectively), while Philadelphia and Los Angeles exhibited the largest net losses (–US$52 billion and –US$22 billion, respectively). As shown in , domestically we observe very intense M&A activity within the Northeastern corridor as well as significant East to West Coast and West to East Coast deal flows.
Figure 1. Top 10 domestic mergers and acquisitions (M&A) flows, 2007–17.
Note: Arrows lead from acquirers to targets.
Source: Authors’ calculations based on Dealogic data.
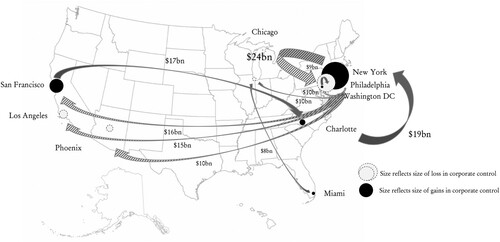
New York led the way with substantial acquisitions of firms in Philadelphia (including American Financial Realty Trust acquired by Gramercy Capital Corp. in 2007), as well as on the West Coast, in San Francisco (including Blackrock buying Barclays Global Investors in 2009), Los Angeles (e.g., IMB Holding Company bank purchased by CIT Group in 2014) and Phoenix (led by American Realty Capital Properties buying Cole Real Estate Investments in 2013). San Francisco was a large acquirer of firms in Charlotte (including Wells Fargo buying Wachovia bank in 2008), which in turn was a significant acquirer of firms in New York (with Bank of America buying Merrill Lynch in 2008). Finally, we note significant South–North flows as Miami and Washington made major acquisitions in Chicago (including Miami-based Fairholme Capital Management buying General Growth Properties in 2010) and Philadelphia (with DC-based Capital One buying ING Bank FSB in 2011). From the biggest deals for each city-pair we can see that the most geographically consequential activity took place in banking, and second, in real estate and asset management, rather than in insurance. This is understandable considering that the biggest financial event during the sample period was the subprime crisis, which involved above all banking and real estate.
On the East Coast we find a considerable amount of interest to acquire proximate FIRE firms with corporate control predominantly flowing North – the acquirer-target relationship between New York and Philadelphia was in fact the third most intense M&A relation captured in our global dataset. On the other hand, our results suggest that FIRE firms located in West Coast financial centres had relatively little interest in each other and preferred to transact with East Coast firms. Overall, we see the formation of a significant East Coast–West Coast axis, within which intensifying Northeastern Corridor–Bay Area relations reflect an increasing fluidity between finance and technology.
One should note that although we see signs of convergence, the corporate and financial ecosystems of the Silicon Valley and that of the financial centres of the Northeastern corridor remain distinct. As a Bay Area FinTech founder summed it up: ‘the private market ecosystem is fundamentally important to Silicon Valley’s rise as a prominent financial centre. Combining innovation, entrepreneurship, private capital, and financial knowhow. It is arguably very different from New York’ (IP_19). Another respondent added: ‘it (the Bay Area) probably has a diminishing role when you think of it as a global financial hub in terms of the size of the financial flows’ (IP_15). Indeed, New York’s ecosystem is steeped in a history of facilitating global, and predominantly public, capital market transactions through large banks and securities exchanges.
More recently, Charlotte has also established itself as a prominent banking centre in the United States (now hosting the headquarters of Bank of America Merrill Lynch). With that being said, the Northeastern Corridor–Bay Area axis has become a critical vector in bridging finance and technology know-how. New York, which now hosts its own Silicon Alley, has seen a whopping 80% increase in technology occupations between 2009 and 2019 reaching 142,600 jobs (DiNapoli & Bleiwas, Citation2019). This has brought new challenges for FIRE firms in attracting and retaining talent: ‘When you’re competing with Google and Apple … working for a bank is nowhere near as interesting’ (IP_37). As talent flows from FIRE to technology firms, the latter are also increasingly competent in, and show appetite for, applying their know-how in developing FIRE products and services: ‘What we’ve seen over the last five years is the [financial] knowledge from New York is migrating to the Silicon Valley software community’ (IP_17).
4.2. Employment shifts: reshoring and nearshoring
Between 2007 and 2017, national employment growth (6.1%) for all occupations significantly outpaced national employment growth for FIRE occupations (3.59%), as well as the average growth for FIRE occupations across our sample of 47 MSAs (3.74%). This finding may reflect several factors including the cyclical effects of the financial crisis, structural changes in its aftermath (including re-regulation and technological disruption such as FinTech), as well as the offshoring of US FIRE firms’ labour force towards lower cost countries.
Nationally, we find that employment growth was most significant in FIRE occupations that command higher wage premia. Specifically, ‘securities, commodities, and financial services sales agents’, ‘financial managers’ and ‘personal financial advisors’ totalled a net increase of just under 275,000 new jobs. On the other hand, employment in back-office jobs that command wage discounts contracted the most. Amongst the hardest hit FIRE occupations, we find ‘loan officers’, ‘tellers’ and ‘bill and account collectors’, which together accounted for a net loss of about 305,000 jobs nationally. For example, in 2017 there were 20% fewer ‘tellers’ than in 2007, a net job loss of nearly 117,000. ‘Tellers’ occupation is described as ‘Receive and pay out money. Keep records of money and negotiable instruments involved in a financial institution’s various transactions’ (BLS, Citation2019). It is the FIRE occupation that commands the largest pay discount relative to all occupations at nearly –US$22,000/year when adjusted to regional purchasing power. Our finding is consistent with a general trend of automation and offshoring of lower skilled back-office jobs in financial services (Grote & Täube, Citation2006). Conversely, the upgrading of the national FIRE labour force we observe could be driven by a reshoring and nearshoring trend in the sector. As a Jacksonville-based respondent noted:
Deutsche Bank in 2008 they moved 1,000 employees here [Jacksonville]. They called it a global tech and ops shop … very back office minded. They had done a lot of expansion in India, and then this was a nearshoring project looking for the next location for growth. And they’re about 2,200 today. It went from being tech and ops back office to a trading floor. Looks like the one in New York, feels different on the outside … Macquarie, they were looking at 5 countries and 17 cities. They were in Gurgaon in India. The regulators had reached a comfort level, they were at about 500/600 people and that was kind of the max that the regulators were comfortable with them growing at. They needed to grow, and ultimately decided to bring it nearshore back to the US and did not want to do it in the New York market … everything was about cost and salary.
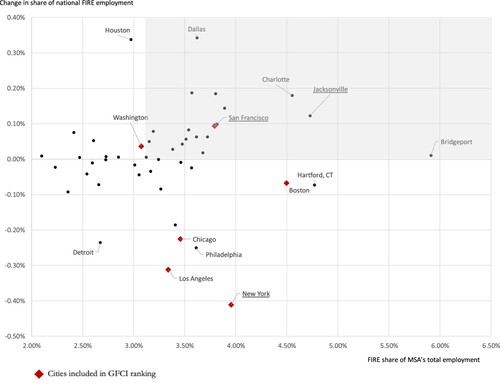
shows the level of FIRE specialization in 47 MSAs, which corresponds to the share of total occupations claimed by FIRE occupations in 2017 (x-axis), and MSAs’ national share change for FIRE occupations between 2007 and 2017 (y-axis). Most cities that feature in GFCI’s ranking of the world’s most competitive financial centres feature a higher degree of specialization for FIRE occupation than the national share (3.08% as of 2017). This is true for Boston, New York, San Francisco, Chicago and Los Angeles, but not Washington, DC, or San Diego. We also find highly FIRE-specialized smaller cities including Bridgeport, Hartford, Connecticut, as a long-established hub of the insurance industry (Borchert, Citation1978), as well as Jacksonville and Charlotte. Generally, we do not find that concentration of FIRE employment has increased spatially. Indeed, FIRE employment across our 47 MSAs accounted for 60% of national FIRE employment in 2007 and 60.1% in 2017. Looking at the top 10 MSAs in terms of FIRE employment, their share of national FIRE employment has hardly changed, from 32.6% in 2007 to 32.1% in 2017. One of our interview partners reflects on this relative stability in the concentration of FIRE employment:
Figure 2. Finance, insurance and real estate (FIRE): specialization, 2017; and employment shifts, 2007–17.
Note: The highlighted quadrant includes cities with above average FIRE employment specialization, which have gained shares of national FIRE employment. The boundaries of the following metropolitan statistical areas (MSAs) have changed between 2007 and 2017: Dallas–Fort Worth–Arlington, TX; Virginia Beach–Norfolk–Newport News, VA–NC; Grand Rapids–Wyoming, MI; Washington–Arlington–Alexandria, DC–VA–MD–WV; Atlanta–Sandy Springs–Roswell, GA; Minneapolis–St. Paul–Bloomington, MN–WI; Charlotte–Concord–Gastonia, NC–SC; Columbus, OH; Indianapolis–Carmel–Anderson, IN; Nashville–Davidson–Murfreesboro–Franklin, TN; Memphis, TN–MS–AR; New Orleans–Metairie, LA; Rochester, NY; Houston–The Woodlands–Sugar Land, TX; Salt Lake City, UT; St. Louis, MO–IL; Cincinnati, OH–KY–IN; and Kansas City, MO–KS.
Source: Authors’ calculations based on Bureau of Labor Statistics (BLS) data.
There’s a good 20–25 metros that I can think of that have been and continue to be strong financial service areas, and then we’re seeing more and more companies migrating middle office activities. Going from Manhattan, San Francisco or Boston, to tier two, these would be a million, two million to three million population areas.
The results become most interesting when looking jointly at specialization and changes in national share of employment. Indeed, we find that some internationally leading US financial centres have experienced a decline in their share of national FIRE employment. The sharpest decline was experienced by New York, followed by Los Angeles, Chicago and Boston. Only San Francisco increased its share of national employment over the period. One of the real surprises is Jacksonville, which features not only a marked specialization in FIRE occupations but also a significant share gain in national FIRE employment. Although Bridgeport (Bridgeport–Stamford–Norwalk, Connecticut) and Charlotte (Charlotte–Concord–Gastonia, North Carolina–South Carolina) also show significant results, they are somewhat less surprising since the former is an established offshoot of the New York city hedge fund industry, and the latter is a well-established second-tier banking centre. Hereafter, we focus our attention on New York, San Francisco and Jacksonville for their significance in our quantitative results, which we complement with the interview data collected in these cities.
Overall, New York FIRE occupations contracted slightly, losing 5160 jobs in total. In 2017, New York’s top three occupations were ‘securities, commodities, and financial services sales agents’, ‘financial analysts’ and ‘financial managers’ totalling 41% of the city’s FIRE occupations. All three occupations command high-wage premiums of US$20,000 and more (on average, relative to all occupations and adjusted for regional purchasing power). The first two were also amongst the fastest growing in New York adding close to 40,000 jobs over the period 2007–17, with securities jobs accounting for more than half of the increase. As mentioned above, New York is a long-standing world leader in capital markets and in the securities industry, which was shown to be quite resilient to the 2008–09 financial crisis (Wójcik & Cojoianu, Citation2018). Transactional real estate occupations were amongst the hardest hit between 2007 and 2017, with a contraction of over 12,000 jobs in ‘real estate sales agents’ and ‘real estate brokers’. Generally, we note that the occupations that suffered the largest job losses in New York are back-office related. Specifically, over two-thirds of the jobs lost in New York, 41,900 jobs in total, were lost in the following 10 occupations: ‘insurance claims and policy processing clerks’, ‘loan interviewers and clerks’, ‘credit authorizers’, ‘checkers and clerks’, ‘loan officers’, ‘tellers’, ‘bill and account collectors’, ‘new accounts clerks’, ‘financial managers’ and ‘brokerage clerks’.
In contrast to New York, San Francisco’s FIRE labour market added 7070 new jobs between 2007 and 2017. What makes this figure even more impressive is the fact that for the sake of consistency, we did not merge the San Francisco MSA with that of San Jose, so it excludes much of Silicon Valley. In 2017, its FIRE employment mix was dominated by the same three high-wage premium occupations as that of New York, only in a slightly different order and exhibiting less specialization. In order of importance, we find ‘financial managers’, ‘financial analysts’ and ‘securities, commodities and financial services sales agents’, together accounting for 34% of the city’s FIRE occupations. Here the story contrasts with the East Coast as transactional real estate occupations marginally increased (+320 jobs for ‘real estate sales agents’ and ‘real estate brokers’). Amongst the occupations that saw the largest number of new jobs created we find, not unlike in New York, ‘financial analysts’ (+4540 jobs) but also ‘personal financial advisors’ (+1790 jobs). The resilience of real estate occupations and significant growth of those in wealth management can be explained by the unprecedented levels of personal wealth creation in the Bay Area’s privately funded entrepreneurial ecosystem: ‘a lot of wealth has been created just by Sales Force, Facebook, PayPal, Apple, Google and real estate prices’ (IP_16). On the other hand, we note that the pattern of back-office job losses is less apparent than in New York, although ‘tellers’ was also the hardest hit occupation.
Relative to New York and San Francisco, Jacksonville exhibits a more diversified FIRE labour force and its top FIRE occupations are more back-office oriented. The top three include ‘bill and account collectors’, ‘loan interviewers’ and ‘clerks and billing and posting clerks’, which together account for 27% of the city’s FIRE labour force. All three are at the lower end of the wage distribution for FIRE occupations, commanding a pay discount between US$0 and US$20,000 (relative to all other occupations and adjusted for regional purchasing power). Although Jacksonville’s labour force remains more diversified and back-office oriented, the trends observed across both our quantitative and interview data suggest the city is upgrading its labour force towards middle-office functions. Most notably, we find the two high-wage premium occupations ‘securities, commodities, and financial services sales agents’ and ‘personal financial advisors’ in third and fourth places in terms of total job gains between 2007 and 2017, 1390 and 860, respectively. As one respondent noted: ‘It went from a back-office to ‘we can do trading’ (IP_25). These results may reflect nearshoring as well as reshoring of higher skills occupations. For instance, one interview partner noted: ‘It’s been back office, but it’s now moved, upscaled into middle office. We’re seeing … middle office functions migrating from high-cost areas’ (IP_09). Another interview partner added: ‘Jacksonville is a great nearshoring option. I think we found client facing roles put in India are not effective’ (IP_33).
4.3. Towards a typology of financial centre evolution
Having analysed corporate control and employment shifts, we put them together in . By doing so, we do not suggest that corporate control shifts, as proxied by net acquisitions, necessarily drive labour shifts, as proxied by changes in the share of national FIRE employment. Neither do we expect, a priori, any specific correlation between these proxies. As discussed above, the relationship between labour and corporate control markets is complex, so what we present here is a typology of financial centre evolution based on a city’s position in each corporate control and labour shift quadrant. Though simple, this typology sheds light on the complex relationship in question.
Figure 3. Finance, insurance and real estate (FIRE) labour and control shifts, 2007–17, a typology of financial centre evolution.
Source: Authors’ calculations based on Bureau of Labor Statistics (BLS) and Dealogic data.
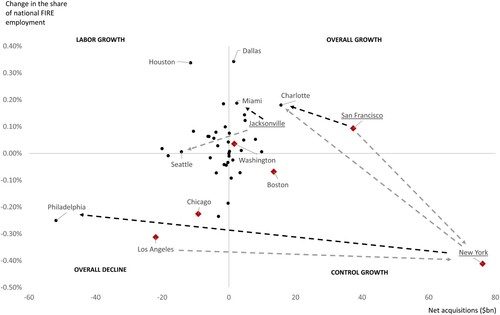
Financial centres that experienced a decline in their national share of employment and a negative dollar amount in net acquisitions are found in the bottom left quadrant and are categorized as declining financial centres. One notable example is Los Angeles. The signs of economic decline of Los Angeles have been documented by Storper et al. (Citation2015). Los Angeles loss in FIRE corporate control is primarily attributed to acquisitions made by New York-based FIRE firms, underscoring once again the general appetite of New York firms to capture FIRE revenues and/or know-how on the West Coast. Philadelphia, the largest net target in FIRE M&As, also suffered an absolute loss of approximately 7000 FIRE jobs. Chicago lost approximately 4000 FIRE jobs. While the long historical decline of Philadelphia as a financial centre was documented by Borchert (Citation1978), our findings on Chicago and Los Angeles contradict a positive view of these cities and their trends in the GFCI, particularly in relation to San Francisco.
Second, financial centres that experienced an increase in their national share of employment and a positive dollar amount in net acquisitions are found in the top-right quadrant and categorized as growing financial centres. This category includes San Francisco and Jacksonville. The Northeastern Corridor–Bay Area axis is again useful here in underscoring the intense acquirer-target relationships that link San Francisco with Charlotte (US$17.5 billion in acquisitions), New York with San Francisco (US$16 billion), San Francisco with Washington, DC (US$7 billion), and San Francisco with New York (US$4 billion). Jacksonville is unsurprisingly a smaller hub for FIRE M&A, with US$5.4 billion of outward acquisitions, almost all conducted in Miami, and a mere US$0.6 billion of inward deals, two-thirds of which come from Seattle. Our interview partners stressed that when Jacksonville FIRE firms were targeted in M&A transactions (some of which may well fall below our US$10 million deal value threshold) they often managed to keep if not grow their local workforce: ‘we have done well where, a lot of other places would not have done well. We’ve benefited more than we have actually lost in those transactions of having more (jobs) growth after that acquisition’ (IP_37).
Third, financial centres that experienced an increase in their national share of employment and a negative dollar amount in net acquisitions are found in the upper-left quadrant and fall in the ‘labor growth’ category. Houston is the most notable example here, with a growth in FIRE jobs of 17,000 (second to none but Dallas’s 19,000), undoubtedly related to the demographic and economic growth of the metropolis and the state, combined with low taxation. We might see more cities heading in this direction, particularly in the growing cities of the US South, if corporate control in the first-tier centres is to increase while back- and middle-office labour force is nearshored to second- and third-tier cities. As a site selector stressed when discussing location factors:
talent is really big because unemployment is so low in the United States. In Charlotte, Nashville, Tampa, Jacksonville, Salt Lake City, Phoenix, Dallas I have found that more often than not, when a company buys a company here and they’ re somewhere else, if they do their homework, they end up expanding here, not wherever they are.
[for] 16,000 or so financial advisors, we probably have 200,000 people in the back office … if we were to replace the 16,000 financial advisors, say cut them in half, replace that with technology, I would only see more growth in the back-end technology space.
Fourth, financial centres that experienced a decrease in their national share of employment and a positive dollar amount in net acquisitions are found in the bottom-right quadrant and categorized as ‘control centres’. New York epitomizes this pattern. ‘New York may be the centre of the universe for managers’ (IP_36). Although New York’s MSA recorded larger losses than Los Angeles in its national share of FIRE employment, the city’s FIRE firms made outward acquisitions worth US$205 billion, exceeding the value of targeted New York-based FIRE firms by outsiders by US$76 billion, making the city by far the largest net acquirer in our sample. There are good reasons to expect the managerial position of New York to grow further. With the intensification of back- and middle-office functions described above coupled with the real estate costs and the costs of living in New York (for comparative statistics, see Figure A3 in Appendix A in the supplemental data online), only occupations that command significant wage premium stand a chance to attract and retain workers in New York – something we observed and described above.
It is worth comparing these patterns with the large variation of corporate and individual income taxes by state. Florida and Texas have no state-level individual income tax, compared with flat tax rates of 3.07% in Pennsylvania, 4.95% in Illinois and 4.99% in North Carolina; with marginal rates of 10.9% in New York and 13.3% in California. Marginal corporate income tax is 9.99% in Pennsylvania, 9.5% in Illinois, 8.84% in California, 7.25% in New York, 5.5% in Florida and 2.5% in North Carolina, while Texas has a gross receipts tax instead of 0.331–0.75% (Tax Foundation, Citation2022). The growth in Dallas, Charlotte, Houston, Jacksonville and Miami in contrast to decline in Chicago, Los Angeles and Philadelphia must be seen in the light of this geography of taxation. As one of our interview partners commented on high-income earners venturing down to Jacksonville: ‘That’s a 10% raise for a typical New Yorker right there’ (IP_37). At the same time, the corporate control growth of New York and the overall growth of San Francisco need to be seen as happening despite the tax disadvantages.
Finally, we compare our results with those from the research on the world city network. Derudder et al. (Citation2011) show a mixed picture for San Francisco between 2007 and 2008. While the city recorded the largest positive percentage increase in tier 1 bank capital, ahead of New York, it also suffered the largest pre-tax losses. Both results were driven by Wells Fargo’s acquisition of loss-maker Wachovia, making Wells Fargo a strategically important firm in global finance (Taylor et al., Citation2014). Based on 2012 world city network data (Taylor & Derudder, Citation2016), in financial services San Francisco features among the top 20 centres in the world (next to New York and Houston). In global network connectivity for all financial and business services, however, San Francisco still lags not only New York, but also Chicago and Los Angeles. In this context, we present more up-to-date results, but we also complement network analysis by studying attributes of places and their dynamics. As Van Meeteren and Bassens (Citation2016) put it:
Scrutinizing the WCA [world city archipelago] with a singular focus on networks can veil dynamics that lead to internal stratification and hierarchy between world cities and their constitutive outside. Alternatively, these veiled dimensions are better grasped by territorial, scalar and place-based abstractions.
5. CONCLUSIONS
In this paper, we have marshalled a combination of data on M&As and employment for 2007 and 2017, augmented with insights from 66 interviews, to examine the recent evolution of US financial centres. Our analysis uncovers a major concentration of the FIRE sector M&A activity in the Northeastern Corridor and the Bay Area and between them, with New York and San Francisco as the leading net acquirers of financial firms domestically, accompanied with major cross-border M&A connections. This confirms the position of New York at the apex of the US financial centre hierarchy and the rise of San Francisco Bay Area to the second place in the hierarchy, with a relative decline of Chicago, Philadelphia, Boston and Los Angeles. In addition to corporate control, our results show significant shifts in FIRE labour markets. Although the overall concentration of FIRE occupations in large cities has not changed, absolute and relative FIRE job losses have concentrated in the declining second-tier centres of Chicago, Philadelphia, Boston and Los Angeles, but also in New York itself. In contrast, cities with fast growing populations and economies, such as Houston and Dallas, but also third-tier financial centres such as Jacksonville have significantly raised their shares in national FIRE employment, assisted among other factors by low taxation. Finally, we combine the analysis of labour and control shifts in a typology, which helps us divide cities into four stylized categories, from overall decline, through labour growth and control growth, to overall growth.
Beyond mapping shifts in US finance and offering analytical tools for measuring net changes in corporate control and categorizing relationships between control and labour/employment, which can be used by future research in other temporal and spatial contexts, our contribution lies in highlighting the changing and complex interplay of factors that affect financial centre development. The emergence of the New York–San Francisco Bay Area as a central axis of US finance, speaks clearly to the rising role of financial technology for financial centres. The three decades before 2008 were characterized by the growth of the securities industry (led by investment banks), increasingly dominant as a FIRE subsector in leading centres, with New York in the lead (Wójcik, Citation2011), and the gradual nearshoring and offshoring of back- and middle-office FIRE jobs to smaller centres with cheaper but skilled labour. What emerges from our findings, in conjunction with other recent research, is that since the crisis the continued focus of the leading centres on the securities industry, led increasingly by asset management rather than investment banking (Wójcik & Cojoianu, Citation2018; Haberly et al., Citation2019), is combined with rapidly rising demand for technology-related skills and capabilities.
Though regional and urban policy aspects of financial centre development have not been the focus of our paper, our results highlight patterns and trends important for policymakers. First, growing concentration of employment in FIRE is not inevitable, and does not have to follow firm-level consolidation through M&As. In the language of Massey’s (Citation1995) typology of industrial organization, FIRE has moved some way from a cloning branch-plant structure (typified by bank branches each performing identical functions in a different location) to a part-process structure, with more specialized units along the value chain. Technology, which enabled this shift, offers opportunities for further unbundling of FIRE value chains through nearshoring and offshoring, but it also encourages reshoring, as the level of technological skills and infrastructure required grow quickly. In the process, selected tertiary centres, such as Jacksonville, can grow and upgrade their position in these chains. In this context, while New York and the Bay Area are the world leading FinTech hubs (Cojoianu et al., Citation2020), our interview partners in Jacksonville, Salt Lake City and even Wilmington, Delaware, stressed the need for these cities to develop FinTech capabilities (see also Urban et al., Citation2021). The growing trade tensions, economic protectionism, and geopolitical risks are also likely to limit offshoring, and strengthen incentives for nearshoring and reshoring. Finally, tax competition affecting the domestic maps of financial centres is likely to intensify in the wake of the COVID-19 pandemic and the rise of remote work.
All the above policy implications need further work, which can be extended in several directions. One suggestion would be to investigate changes in sectoral specialization, with more focus on distinctions between banking, insurance and real estate. Another is to incorporate data on the financial sector outputs in relation to inputs to analyse the changing productivity of financial centres. Future research should further investigate the effects of the convergence between technology and the financial sectors on the labour as well as corporate control markets, including convergence in the form of FinTech. For instance, it could relate changes in FIRE employment to those in FinTech and technology industries, as well as M&As between these sectors. Finally, while our study focuses on the domestic map of US financial centres, our findings have implications for understanding the global map of finance. This is because the rise of the New York–San Francisco Bay Area axis may be seen as a geographical manifestation of broader processes through which the US financial capitalism is reinventing itself for the future.
Supplemental Material
Download PDF (618.5 KB)ACKNOWLEDGEMENTS
All errors and omissions are the sole responsibility of the authors.
DISCLOSURE STATEMENT
No potential conflict of interest was reported by the authors.
Additional information
Funding
REFERENCES
- Akhigbe, A., Johnston, J., & Madura, J. (2004). Consolidation in the financial services industry: Are there industry gains for acquisitions of security firms? Journal of Economics and Finance, 28(1), 14–31. https://doi.org/10.1007/BF02761451
- Allen, J. (2010). Powerful city networks: More than connections, less than domination and control. Urban Studies, 47(13), 2895–2911. https://doi.org/10.1177/0042098010377364
- Baldwin, R. (2016). The great convergence: Information technology and the new globalization. Harvard University Press.
- Bassens, D., & van Meeteren, M. (2015). World cities under conditions of financialized globalization towards an augmented world city hypothesis. Progress in Human Geography, 39(6), 752–775. https://doi.org/10.1177/0309132514558441
- Beccalli, E., & Frantz, P. (2013). The determinants of mergers and acquisitions in banking. Journal of Financial Services Research, 43(3), 265–291. https://doi.org/10.1007/s10693-012-0138-y
- Borchert, J. R. (1978). Major control points in American economic geography. Annals of the Association of American Geographers, 68(2), 214–232. https://doi.org/10.1111/j.1467-8306.1978.tb01192.x
- Boschma, R. A., & Hartog, M. (2014). Merger and acquisition activity as driver of spatial clustering: The spatial evolution of the Dutch banking industry, 1850–1993. Economic Geography, 90(3), 247–266. https://doi.org/10.1111/ecge.12054
- Bryson, J., Daniels, P., & Warf, B. (2013). Service worlds: People, organisations, technologies. Routledge.
- Bureau of Labor Statistics (BLS). (2019, May). Occupational employment and wages. https://www.bls.gov/Oes/current/oes433071.htm
- Carter, Z. D. (2020). The price of peace: Money, democracy and the life of John Maynard Keynes. Random House USA Inc.
- Cassis, Y., & Wójcik, D. (2018). International financial centres after the global financial crisis and Brexit. Oxford University Press.
- Coe, N. M., Lai, K. P. Y., & Wójcik, D. (2014). Integrating finance into global production networks. Regional Studies, 48(5), 761–777. https://doi.org/10.1080/00343404.2014.886772
- Cojoianu, T., Clark, G. L., Hoepner, A. G. F., Pažitka, V., & Wójcik, D. (2020). Fin vs. tech: Are trust and knowledge creation key ingredients in fintech start-up emergence and financing? Small Business Economics, 57(4), 1715–1731. https://doi.org/10.1007/s11187-020-00367-3
- Contel, F. B., & Wójcik, D. (2019). Brazil’s financial centers in the twenty-first century: Hierarchy, specialization, and concentration. The Professional Geographer, 71(4), 681–691. https://doi.org/10.1080/00330124.2019.1578980
- Currid, E. (2006). New York as a global creative hub: A competitive analysis of four theories on world cities. Economic Development Quarterly, 20(4), 330–350. https://doi.org/10.1177/0891242406292708
- Daniels, P. W. (1983). Business service offices in British provincial cities: Location and control. Environment and Planning A: Economy and Space, 15(8), 1101–1120. https://doi.org/10.1068/a151101
- Derudder, B., Hoyler, M., & Taylor, P. J. (2011). Goodbye Reykjavik: International banking centres and the global financial crisis. Area, 43(2), 173–182. https://doi.org/10.1111/j.1475-4762.2010.00968.x
- DeYoung, R., Evanoff, D. D., & Molyneux, P. (2009). Mergers and acquisitions of financial institutions: A review of the post-2000 literature. Journal of Financial Services Research, 36(2–3), 87–110. https://doi.org/10.1007/s10693-009-0066-7
- DiNapoli, T. P., & Bleiwas, K. (2019). New York City employment trends. https://www.osc.state.ny.us/files/reports/osdc/pdf/report-1-2020.pdf
- Dixon, A. D. (2011). Variegated capitalism and the geography of finance: Towards a common agenda. Progress in Human Geography, 35(2), 193–210. https://doi.org/10.1177/0309132510372006
- Dixon, A. D., & Monk, A. H. B. (2014). Frontier finance. Annals of the Association of American Geographers, 104(4), 852–868. https://doi.org/10.1080/00045608.2014.912543
- Dörry, S. (2016). The geographies of industrialised finance: Probing the global production networks of asset management. Geography Compass, 10(1), 3–14. https://doi.org/10.1111/gec3.12256
- Dymski, G. (1999). The Bank Merger Wave: The economic causes and social consequences of financial consolidation. ME Sharpe.
- Erel, I., Liao, R. C., & Weisbach, M. S. (2012). Determinants of cross-border mergers and acquisitions. Journal of Finance, 67(3), 1045–1082. https://doi.org/10.1111/j.1540-6261.2012.01741.x
- Federal Reserve Statistical Release. (2022). https://www.federalreserve.gov/releases/h41/current/
- Friedmann, J. (1986). The world city hypothesis. Development and Change, 17(1), 69–83. https://doi.org/10.1111/j.1467-7660.1986.tb00231.x
- Gertler, M. S. (2003). Tacit knowledge and the economic geography of context, or the undefinable tacitness of being (there). Journal of Economic Geography, 3(1), 75–99. https://doi.org/10.1093/jeg/3.1.75
- Gong, H., & Wheeler, J. (2002). The location and suburbanization of business and professional services in the Atlanta area. Growth and Change, 33(3), 341–369. https://doi.org/10.1111/1468-2257.00194
- Gottmann, J. (1961). Megalopolis: The urbanized Northeastern Seaboard of the United States. Twentieth Century Fund.
- Grote, M. H., & Täube, F. A. (2006). Offshoring the financial services industry: Implications for the evolution of Indian IT clusters. Environment and Planning A: Economy and Space, 38(7), 1287–1305. https://doi.org/10.1068/a37256
- Grote, M. H., & Umber, M. P. (2006). Home biased? A spatial analysis of the domestic merging behavior of US firms (Working Paper Series: Finance & Accounting, No. 161). https://www.econstor.eu/bitstream/10419/23427/1/1151.pdf
- Haberly, D., MacDonald-Korth, D., Urban, M. A., & Wójcik, D. (2019). Asset management as a digital platform industry: A global financial network perspective. Geoforum, 106(2019), 167–181. https://doi.org/10.1016/j.geoforum.2019.08.009
- Hoover, E. M., & Vernon, R. (1959). Anatomy of a metropolis. Harvard University Press.
- Hymer, S. (1972). The multinational corporation and the law of uneven development. In J. N. Bhagwati (Ed.), Economics and world order from the 1970s to the 1990s (pp. 113–140). Free Press.
- Ioannou, S., Wójcik, D., & Dymski, G. (2019). Too-big-to-fail: Why megabanks have not become smaller since the global financial crisis? Review of Political Economy, 31(3), 356–381. https://doi.org/10.1080/09538259.2019.1674001
- Jones, A. (2002). The ‘global city’ misconceived: The myth of ‘global management’ in transnational service firms. Geoforum, 33(3), 335–350. https://doi.org/10.1016/S0016-7185(02)00010-6
- Kreston, N. (2014). Connectivity, employment, and specialization of business services in U.S. cities. The Professional Geographer, 66(4), 589–598. https://doi.org/10.1080/00330124.2013.848762
- Lai, K. (2012). Differentiated markets: Shanghai, Beijing and Hong Kong in China’s financial centre network. Urban Studies, 49(6), 1275–1296. https://doi.org/10.1177/0042098011408143
- Lee, R., Clark, G. L., Pollard, J., & Leyshon, A. (2009). The remit of financial geography – before and after the crisis. Journal of Economic Geography, 9(5), 723–747. https://doi.org/10.1093/jeg/lbp035
- Manne, H. G. (1965). Mergers and the market for corporate control. Journal of Political Economy, 73(2), 110–120. https://doi.org/10.1086/259000
- Massey, D. (1984 and 1995). Spatial divisions of labour: Social structures and the geography of production. Macmillan.
- Meyer, S. P. (2007). Finance, insurance and real estate firms and the nature of agglomeration advantage across Canada and within metropolitan Toronto. Canadian Journal of Urban Research, 16(2), 149–181. https://www.jstor.org/stable/26189245
- Motis, J. (2007). Mergers and acquisitions motives (Working Papers No. 0730). University of Crete. https://economics.soc.uoc.gr/wpa/docs/0730.pdf
- Nielsen, B. B., Welch, C., Chidlow, A., Miller, S. R., Aguzzoli, R., Gardner, E., Karafyllia, M., & Pegoraro, D. (2020). Fifty years of methodological trends in JIBS: Why future IB research needs more triangulation. Journal of International Business Studies, 51(9), 1478–1499. https://doi.org/10.1057/s41267-020-00372-4
- Noonan, L. (2019). Tech forecast to destroy more than 200,000 US bank jobs. Financial Times. https://www.ft.com/content/baf3297a-e456-11e9-9743-db5a370481bc
- Ó hUallacháin, B., & Reid, N. (1996). Sectoral differences in the determinants of the location of foreign direct investment in American manufacturing. Papers in Regional Science, 75(2), 201–235. https://doi.org/10.1111/j.1435-5597.1996.tb00661.x
- Parr, J. B., & Budd, L. (2000). Financial services and the urban system: An exploration. Urban Studies, 37(3), 593–610. https://doi.org/10.1080/0042098002131
- Pred, A. R. (1977). City-systems in advanced economies. Hutchinson.
- Ragozzino, R. (2009). The effects of geographic distance on the foreign acquisition activity of U.S. firms. MIR: Management International Review, 49(4), 509–535. https://doi.org/10.1007/s11575-009-0006-7
- Sassen, S. (1991 and 2001). The global city. Princeton University Press.
- Smith, R. G. (2014). Beyond the global city concept and the myth of ‘command and control’. International Journal of Urban and Regional Research, 38(1), 98–115. https://doi.org/10.1111/1468-2427.12024
- Storper, M., Kemeny, T., Makarem, N., & Osman, T. (2015). The rise and fall of urban economies: Lessons from San Francisco and Los Angeles. Stanford University Press.
- Storper, M., & Venables, A. J. (2004). Buzz: Face-to-face contact and the urban economy. Journal of Economic Geography, 4(4), 351–370. https://doi.org/10.1093/jnlecg/lbh027
- Tax Foundation. (2022). https://taxfoundation.org/center/state-tax-policy/
- Taylor, P. J. (2004). World city network: A global urban analysis. Routledge.
- Taylor, P. J., & Derudder, B. (2016). World city network. Routledge.
- Taylor, P. J., Derudder, B., Faulconbridge, J. R., Hoyler, M., & Ni, P. (2014). Advanced producer service firms as strategic networks, global cities as strategic places. Economic Geography, 90(3), 267–291. https://doi.org/10.1111/ecge.12040
- Tett, G. (2018). AllianceBernstein’s Nashville move threatens New York and London. Financial Times. https://www.ft.com/content/e483a6ea-4e23-11e8-9471-a083af05aea7
- Urban, M. (2019). Producing investment returns at the margin of finance: A frontier talent proposition. Geoforum, 95, 102–111. https://doi.org/10.1016/j.geoforum.2018.06.021
- Urban, M., Pažitka, V., Ioannou, S., & Wójcik, D. (2021). The financial geography of resilience: A case-study of Goldman Sachs. Annals of the American Association of Geographers, 112(6), 1593–1613. https://doi.org/10.1080/24694452.2021.1994849
- Van Meeteren, M., & Bassens, D. (2016). World cities and the uneven geographies of financialization: Unveiling stratification and hierarchy in the world city archipelago. International Journal of Urban and Regional Research, 40(1), 62–81. https://doi.org/10.1111/1468-2427.12344
- Wójcik, D. (2011). Securitization and its footprint: The rise of the US securities industry centres 1998–2007. Journal of Economic Geography, 11(6), 925–947. https://doi.org/10.1093/jeg/lbq045
- Wójcik, D. (2013). The dark side of NY-LON: Financial centres and the global financial crisis. Urban Studies, 50(13), 2736–2752. https://doi.org/10.1177/0042098012474513
- Wójcik, D. (2021a). Financial geography I: Exploring FinTech – maps and concepts. Progress in Human Geography, 45(3), 566–576. https://doi.org/10.1177/0309132520952865
- Wójcik, D. (2021b). Financial and business services: A guide for the perplexed. In J. Knox-Hayes & D. Wójcik (Eds.), The Routledge handbook of financial geography (pp. 25–55). Routledge.
- Wójcik, D., & Cojoianu, T. F. (2018). Resilience of the US securities industry to the global financial crisis. Geoforum, 91, 182–194. https://doi.org/10.1016/j.geoforum.2018.02.035
- Wójcik, D., Keenan, L., Pažitka, V., Urban, M., & Wu, W. (2022). The changing landscape of international financial centres in the twenty-first century: Cross-border mergers and acquisitions in the global financial network. Economic Geography, 98(2), 97–118. https://doi.org/10.1080/00130095.2021.2010535
- Z/Yen. (2022). GFCI 31. https://www.longfinance.net/publications/long-finance-reports/global-financial-centres-index-31/
- Zademach, H.-M., & Rodríguez-Pose, A. (2009). Cross-border M&As and the changing economic geography of Europe. European Planning Studies, 17(5), 765–789. https://doi.org/10.1080/09654310902778276