
 ?Mathematical formulae have been encoded as MathML and are displayed in this HTML version using MathJax in order to improve their display. Uncheck the box to turn MathJax off. This feature requires Javascript. Click on a formula to zoom.
ABSTRACT
Cities relate to other cities in many ways, and much scholarly effort goes into uncovering those relationships. Building on the principle that strongly related cities will co-occur frequently in texts, we propose a novel method to classify those toponym co-occurrences using a lexicon-based text-mining method. Millions of webpages are analysed to retrieve how 293 Chinese cities are related in terms of six types: industry, information technology, finance, research, culture and government. Each class displays different network patterns, and this multiplexity is mapped and analysed. Further refinement of this lexicon-based approach can revolutionize the study of inter-urban relationships.
1. INTRODUCTION
People and firms interact in many ways with each other, and by no means are such interactions confined to city boundaries (e.g., Capello, Citation2000; Derudder & Taylor, Citation2018). At an aggregate level, cities are embedded in fine-grained systems of relationships, making them interdependent to such an extent that what happens in one place has an impact on people and firms in other connected cities. Over the last decades, five different schools of thought have emerged to try to make sense of such networks between cities (Peris et al., Citation2018).
A continuous, common challenge in this literature is understanding how such city networks can actually be measured, to then apply network analysis. As Neal (Citation2012, p. 2) observed, ‘whatever the relationships are and whatever they connect, networks have a specific and observable content that can be studied’. It is generally acknowledged that such city networks are multiplex in that they are comprised of ‘multidirectional flows of not only economic but also social, cultural, and environmental activities’ (Davoudi, Citation2008, p. 51). Each type of flow can be recognized as a layer of the network, which coexists and interacts with other layers, thereby creating network multiplexity, and making the system of cities function in a complex synergetic way.
A proper specification and measurement of network multiplexity can provide a more comprehensive profile of the complexity of our urban domain and can act as a guide for urban policy and practice (Derudder & Neal, Citation2018). While most studies focus on just a single layer of city networks, studies that do recognize multiplexity (e.g., Berroir et al., Citation2017; Burger et al., Citation2014a; Hu et al., Citation2020) show that patterns of specific types of networks are often markedly different from other types. Burger et al. (Citation2014b) show that judging the strength of functional coherence in a region depends highly on the scope and type of functional links upon which such an analysis rests. In other words: our understanding of networks between cities, whether on a global or regional scale, is very dependent upon the lens through which we assess these networks.
One could argue that to address multiplexity in city networks, it is a simple matter of combining data sets on particular flows of people and goods. And no doubt this is well possible for some countries or regions, using, for example, (micro-)data from travel surveys or nowadays point of interest (POI) data. But such datasets generally cover only large cities and do not facilitate precise cross-border comparisons due to different standards used, and since standards change regularly, the time period that can be covered is mostly limited. More importantly, these data only refer to tangible exchange or physical movements in space (e.g., commuting is commonly studied), leaving out non-physical flows, specifically, information flows.
Information flows refer to the exchange of knowledge, ideas and sentiments expressed by people living in different cities. Their shared information also represents an essential type of city relationship as it reflects how individuals think, communicate, behave and respond to people living in other cities. While information flows can be hardly captured by typical physical movements, it is often obtainable from texts, such as books, narratives and interviews.
Information flows can be extracted by content analysis. Very promising with regards to retrieving and exploring city networks is the summative content analysis method, particularly the collocation analysis (Mello, Citation2002). It involves summarizing the co-appearance of specific words or content in texts: the more words or phrases co-occur, the more they are related. A straightforward approach is to search for toponym co-occurrences, and that is based on the assumption that places or regions that are more strongly related will co-occur more often in a text corpus (Callon et al., Citation1983; Devriendt et al., Citation2011; Tobler & Wineburg, Citation1971). While some of these co-occurrences will capture actual interactions, other toponym co-occurrences should be considered partly as ‘symbolic’, as the collocation of words represents sometimes abstract and non-tangible interactions, which are then hard to interpret (Watts, Citation2004). Admittedly, any individual co-appearance of city names may be trivial, but the aggregated pattern holds great value as their accumulation can capture, generalize, and highlight the strength of hidden relatedness between cities.
Burger et al. (Citation2014b) stated that an important criterion to evaluate methods for identifying city networks is whether they are capable of dealing with multiplexity. So far, the toponym co-occurrence approach has mainly focused on establishing the strength of intercity relationships, but hardly on identifying different types of the relationships or their meaning (Meijers & Peris, Citation2019; Watts, Citation2004). The exact nature of the co-occurrence of place names remains unclear, therefore. Salvini and Fabrikant (Citation2016) and Hu et al. (Citation2017) are interesting exceptions, but can rely on classifications (shared links or tags) present in the underlying text corpus. However, being reliant on pre-existing classifications leaves little flexibility, while such classifications are often absent in unstructured texts. It seems fair to assume that this toponym co-occurrence method will only gain prominence if it is able to substantiate what relationships between cities are about. So far, the initial attempts by Meijers and Peris (Citation2019) to classify place name co-occurrences on webpages by using a supervised machine-learning algorithm trained to identify predefined categories were not yet very accurate. Such machine-learning-based methods may take a long time to reach the human ability to understand texts (Baeza-Yates et al., Citation2016). This paper aims to fill this gap by exploring how toponym co-occurrences in unstructured texts can be classified, thereby providing new insights in the multiplexity of urban systems.
The objective of this paper is to develop and apply a novel approach to classifying relationships between cities that are derived from toponym co-occurrences in texts. The ambition of implementing such an approach is to give further meaning to the idea that city networks are multiplex, or in other words, that the pattern of relations between cities varies according to the type of relationship that is being considered. This lexicon-based approach substantiates the normal toponym co-occurrence method by adding a classification method of the otherwise relatively abstract relationships. In essence, our approach involves collocation analysis: we pair the toponym co-occurrence with words that capture particular types of relationships. To give a simple example: if two city names co-occur with words such as ‘match’, ‘scored’ and ‘goal’, such a city relationship could be labelled as ‘sports’. This method therefore combines the deductive and summative content analysis methods as it uses a predefined collection of words and phrases to represent the topic of each text content (deductive content analysis), and counts the occurrence of these predefined words and phrases to identify content patterns (summative content analysis). As such, this lexicon-based method builds on the keyness concept (Scott, Citation1999), which aims to identify the aboutness of the text using a set of semantically related words. The underlying reasoning is that the content of a text can be interpreted by the use of words whose frequencies have a statistically significant difference from those same words that are used in another context (Culpeper, Citation2009).
Empirically, we will focus on China. We are curious whether the unbalanced development, strongly weighted toward the coastal regions, is associated with unequal representation in particular relationships (Li & Wu, Citation2012; Zhang & Peck, Citation2016). Another important reason is that China does not yet have the geo-relational data on a national level as commonly used in the Western world. While much of the literature has explored city relationships using trade data to commuting, to migration flows, to leisure/tourism flows, to goods being transported, and telecommunication, few data on how cities relate to each other are actually publicly accessible. Data availability makes previous studies on the multiplexity of China either focused on a limited number of top-level cities at the national level (Lao et al., Citation2016) or only on a more detailed regional level, such as the Yangtze River Delta (YRD) (Cao et al., Citation2021; Zhang et al., Citation2020). A comparative advantage of using the Chinese language is that it avoids some of the semantic ambiguation that results from the use of Latin letters by different Indo-European languages, as Chinese letters are used in the Chinese language only. Second, Chinese words lack plural or gender forms, so it is practically easier for searching words in text corpora.
Next to filling this empirical gap of investigating city network multiplexity at the Chinese national scale, this paper aims to have broader theoretical and methodological relevance. Theoretically, we add to the emerging debate on the multiplexity of intercity networks. Methodologically, we further advance the toponym co-occurrence method by introducing a method to classify the types of relationships that are obtained.
The paper is structured as follows. Next, we review Chinese city network multiplexity studies and applications of the toponym co-occurrence method (section 2). We then present our method, detailing the steps taken in the research process (section 3). We map and analyse the similarity between different network layers at the national level (section 4). Finally, we conclude with a discussion of the pros and cons of this lexicon-based method and reflect on how this method can be successfully implemented in future studies (section 5).
2. LITERATURE REVIEW
2.1. Network multiplexity
Network multiplexity refers to the phenomenon that nodes (cities) are related to each other in many different ways, for instance in social, economic and cultural dimensions. Studies have evaluated city networks using multiple types of relationships at different scales. On the global scale, studies generally focus on air transport (Derudder & Witlox, Citation2005), export (Hidalgo & Hausmann, Citation2009) and Globalisation and World Cities (GaWC) interlocking firm models (Derudder et al., Citation2003; Taylor et al., Citation2012). At the national and regional scales, commuting transport flows, high-speed railway and scientific collaboration networks dominate (Burger et al., Citation2011; Cao et al., Citation2021; Liu et al., Citation2016). In studies at the city scale exploring the network between districts, POI location data are gaining popularity (Jiang et al., Citation2015), such as locations from smartphone applications (An et al., Citation2019) and telephone calls (Järv et al., Citation2012). Choices to use particular types of data are often driven by data availability.
Comparing empirical studies that focus on a single type of city relationships can shed light on the multiplexity of city networks. For instance, studies using the high-speed railroad network in China (Liu et al., Citation2020; Yang et al., Citation2019) show that the best connected cities are usually geographically close, for example, Beijing–Tianjin (125 km) and Guangzhou–Shenzhen (136 km). However, Pan et al. (Citation2020), who constructed a financial centre network based on the interlocking network model, show that Beijing–Shenzhen (2175 km) and Beijing–Shanghai (1214 km) are the most strongly connected cities in China. It is exactly for these diverging outcomes that scholars have argued that studying only one type of relationship can hardly give a comprehensive profile of the relationships between cities, and this may ultimately have consequences for the effectiveness of policy (Burger et al., Citation2014a).
Another reason to consider the multiplexity of inter-urban relationships is because different factors explain the variation in network patterns. Zhang et al. (Citation2020) examined the determinants of three types of city networks in the YRD using transportation infrastructure, business interactions and mobility data. They found that different determinants exist in each network: the infrastructure network is significantly correlated with landform patterns, and the mobility network is more associated with population and distance, while gross domestic product (GDP) and administrative relationships are the main determinants of the business. In addition, studies also have shown that large cities are likely to be more dependent on international networks while smaller cities benefit more from regional networks (Meijers et al., Citation2016).
2.2. Content analysis methods
Extracting and analysing information content is not new. The earliest content analysis can be traced to the 18th century (Rosengren, Citation1981). Nowadays this type of method is a widely used analytic technique to investigate myriads of information generated in the digital era.
Classical content analysis methods involve assigning codes to words and phrases to capture the text topic, help summarize the results and interpret meaning from the text content. According to the way of coding, traditional content analysis can be roughly classified into three approaches: deductive, inductive and summative (Hsieh & Shannon, Citation2005). A deductive approach applies a predetermined set of codes to identify the content of the text, but an inductive approach creates codes based on the text content itself, subject to the analyser’s understanding of the content. A summative approach involves statistical tools to count and compare certain keywords or content.
Previous research on toponym co-occurrence often uses the text whose content actually has been classified and labelled. This is more of an inductive approach, as the label is based on the generator understanding of the content. For instance, based on the similarity of user tag-generated tags of the articles, Salvini and Fabrikant (Citation2016) quantified the relationships between cities using the number of shared articles from Wikipedia articles and classified the city relationship. A similar classification approach was conducted in the news by Hu et al. (Citation2017), who extracted the toponym co-occurrence from news articles of The Guardian, and then classified them by combining semantic-related news tags of the articles. Such a method is useful when there exist tags identifying the topic, but such a method is hard to conduct for unstructured text without tags.
A big advantage of the summative approach is its capability of analysing the content of massive unstructured text by identifying the keyness of the text, a selection of semantically related words that appear significantly less often in other texts. This method assumes that the specific linguistic choices a producer of a text makes indicates what the producer think (Scott, Citation1999). For example, Schuckert et al. (Citation2015) identify articles related to tourism online reviews through relevant keyword selection, and Song et al. (Citation2016) identify top topic public–private partnership projects based on keyword frequency. This method is especially suitable for massive unstructured internet texts. For instance, studies involving analysing social media texts (Chew & Eysenbach, Citation2010) often use hashtags to select relevant messages and treat the number of hashtag occurrences as an indicator of the popularity of an event.
Similar analysis can also be applied to deduct a word relationship by its co-occurrence (Gregory et al., Citation2015; Porter et al., Citation2015). Content in text does not consist of isolated words, but of coherent, interdependent utterances, forming a structured story (Baxter & Montgomery, Citation1996; Griffin, Citation1993). Thus, it is possible to infer relationship between words based on their tendency to co-occur in the same text. Frequency of co-occurrence is a reflection of the extent to which a bundle of words is stored and used as a prefabricated chunk (Biber et al., Citation1999). In other words, a bundle of words with higher frequency are more likely to be stored than those with lower frequency.
More specifically, this relationship analysis based on co-occurrence is called collocation analysis. It counts and interprets the co-appearance of two or more entity names as the degree of relevance between the entities. Three measures determine the meaning and the strength of the relationship between the entities (Baker et al., Citation2008): the frequency of the appearance of the entity names, the frequency of where the entities collocate and the frequency of how they collocate. This is because the collocation of words provides not only ‘a semantic analysis of a word’ (Sinclair & Sinclair, Citation1991), but also risks conveying implicit messages (Hunston, Citation2002). Many studies have used this method to identify relationships, such as searching for the co-appearance of two universities in academic searching engines (Fanelli et al., Citation2015), searching for the co-appearance of city and disease-related keywords in the registrar-general’s reports (Porter et al., Citation2015), and searching for the co-appearance of refugees and their concerns in British news articles (Baker et al., Citation2008). In conclusion, the lexicon-driven approach has been used extensively for content classification and relevance detection.
Turning to urban systems, counting the co-appearance of two city names has shown great potential to retrieve inter-urban relationships. Studies have found that the toponym co-occurrence frequency between two places mirrors their ‘relatedness’ in the real world in some aspects (Vaughan & You, Citation2010). For example, Liu et al. (Citation2014) used the toponym co-occurrence method to investigate the relationship between provinces with data collected from Baidu. They found proximate provinces have similar network patterns, and the network pattern classification of provinces generally agrees with the widely accepted economic zoning schema in China. Later, Zhong et al. (Citation2017) applied complex network methods on the toponym co-occurrence results to evaluate city network positions. They found that the frequency of toponym co-occurrence is only weakly correlated with the distance between the two cities, but strongly correlated with administrative hierarchical distance. Besides investigating the toponym co-occurrence relationship patterns, experiments that combine this relationship with traditional data have been explored as well.
3. METHOD
3.1. A lexicon-based classification approach
In this paper we apply content analysis methods, more specifically a lexicon-based classification approach, to classify relationships between cities that have been found using the toponym co-occurrence method. A big advantage of such an approach is that this classification method can be applied to any text corpus and be tailored to any specific demand. But the approach will always involve these four steps:
Text corpus selection.
Preparation of lexicons containing sets of words where each lexicon captures a particular type of relationship.
Extraction of the relative frequencies with which words from each type of relationship appear from the text in order to categorize each text included in the corpus. The relative frequency indicates the extent to which the content is related to that type. For example, if a text contains five words relating to finance, three words relating to politics and two words relating to culture, then the relative frequencies are considered as 0.5 finance, 0.3 politics and 0.2 culture.
Building the database on relationships between cities. For each pair of cities that co-occurs in a text, we sum these frequencies across all texts in which these two city names co-appear for each type of relationship, and assign these frequencies as the link weight between the city pair in that type.
Below, we detail steps 1 and 2. For steps 3 and 4, we will focus on the outcomes, and hence discuss these in section 4.
3.2. Step 1: Text corpus selection
An important question is which text corpus is being used, as this is likely to affect outcomes to a considerable extent. Recent applications of the toponym co-occurrence method have used Wikipedia (Neal, Citation2012; Salvini & Fabrikant, Citation2016), newspapers (Hu et al., Citation2017; Janc, Citation2015; Zhong et al., Citation2017) or websites found through search engines such as Google and Baidu to explore web content (Devriendt et al., Citation2008; Liu et al., Citation2014). However, as indicated by Meijers and Peris (Citation2019), search engines or a single newspaper source all suffer from potential biases and are not necessarily sufficiently representative to obtain a comprehensive view. Instead of focusing on a single text source, they preferred the Common Crawl web archive. Common Crawl is one of the largest publicly available web archives, a monthly updated snapshot of all websites, and providing terabytes of internet data, including billions of raw webpages in more than 100 languages. More than half of its webpages are from top-level domains.
Therefore, we used the Common Crawl web archive as our preliminary data source to avoid selection bias. We extracted a 139 Gigabyte text corpus containing 91 million Chinese webpages from the April 2019 Common Crawl database using a Hadoop-based frame on a 1080 CPU cluster from the Amazon Elastic Map/Reduce infrastructure. The detailed corpus extraction processing and corpus statistics are presented in Tongjing et al. (Citation2022), which also explains the choice for the 293 cities in China at prefecture administration or higher and includes a link to the (open) data we created. We consider all websites on which we find two or more of these 293 Chinese placenames.
3.3. Step 2: Types of relationships and their lexicons
Since our interest is in identifying inter-urban relationships related to economic activities, we select six types by building on terms from the China Standard Industrial Classification of Economic Activities (GB/T 4754-2017), a procedure that helps avoid the risk of subjective selection bias. This standard classifies economic activities into three main sectors and each sector is divided into several subsectors. Each economic activity in the standard is described in a single word or phrase.
Given our focus on cities, we selected the economic activities from the secondary and tertiary sectors and omitted the primary sector (agriculture, forestry and fishery), because they are largely non-urban activities. We selected all economic activities in the secondary sector as representative of ‘industry’ type relationships. To obtain greater detail and clearer classification results for the tertiary sector, we subdivided this sector into five subsectors of tertiary economic activities: information technology (IT); finance; research (scientific research and technical service); culture (publishing, sports and entertainment); and government management. Some example words or phrases used for each subsector in the standard are listed below to illustrate how our lexicon-based approach works and to provide an idea of what economic activities are included in each subsector:
IT: e.g., ‘information transfer’, ‘telecom’, ‘Internet’, ‘software’, ‘information technology’.
Finance: e.g., ‘finance’, ‘monetary finance’, ‘capital market’, ‘insurance’.
Research: ‘scientific method, ‘research, ‘quality inspection’, ‘technological application’.
Culture: ‘sports’, ‘entertainment’, ‘news’, ‘media’, ‘publication’, ‘broadcast’, ‘movie’.
Government: ‘social security’, ‘social organization’, ‘social working’, ‘communist party’.
Admittedly, some of the words that are in the standard may not be used commonly in China, and economic activity can also be described often by more than the one word provided in the standard, so we enlarged the keyword set by adding words that are semantically related to the keywords in the standard, creating a more comprehensive collection. To find semantically related words of a given word, a natural language processing (NLP) technique called word embedding is used. This technique measures the relatedness of words or phrases by mapping them into multidimensional vectors based on their relationships in the documents (Bengio et al., Citation2003). In this paper, we selected a word embedding corpus from Tencent AI Lab (Song et al., Citation2018), which is a 16.75 GB dataset that has measured the relationship of over 8 million Chinese words and phrases using a directional skip-gram model by covering a large amount of domain-specific words or slang terms from news, webpages and novels, and by including phrases from Wikipedia and Baidu Baike (a Chinese version of Wikipedia). This model relies on word co-occurrence within the local context and word sequence. The semantic similarity between two words was calculated using the cosine similarity of their corresponding embedding vectors. To optimize the number of semantic words that relate to economic activities and reduce the probability of words appearing in more than one type, we selected the threshold of similarity at 0.5. Then we cleaned the resulting dataset by making sure that keywords are associated with just one (in our view the most logical) type. Some descriptives on the number of words per type and the method of adding them to their lexicon are presented in . The Chinese terms we used (with translation) are listed in Appendix A in the supplemental data online.
Table 1. Number of words in the lexicons for types of relationships.
As can be seen in , the NLP extension substantially increases the number of words for each category, but to different degrees. The size of the ‘bag of words’ for the finance sector increases by 10.8 times, for the industry sector it is 7.7 times. This does not make up for the considerable difference in sizes of the lexicons for the different categories. Nevertheless, this does not mean that it is more likely that we will find more toponym co-occurrences for the industry sector, as what matters is the frequency of appearance of words, which differs substantially. Using very specific, smaller text corpora will influence those frequencies more than a broad corpus like the web archive employed here. Nevertheless, some care should be taken when comparing, which is why we focus predominantly on relative strengths, network patterns more generally and especially the spatial pattern of each type of network of relationships.
4. RESULTS
4.1. General multiplexity between network layers
For each pair of cities, we considered all websites on which the names of these cities co-occur, and the text of these websites was used to determine whether or not it was about one of our six categories, and if so, to what degree. These relative frequencies for a particular type were then summed for each pair of cities, and this is the link weight of the city pair in that type. The resulting pattern of co-occurrences was captured as a network layer. To assess the multiplexity of the national city network, we calculate the correlation between any two layers. Specifically, we used Spearman’s rank correlation coefficient to measure the strength and direction of the association between two layers (), rather than Pearson’s linear correlation coefficient, which requires a normal distribution dataset.
Table 2. Spearman’s rank correlation between different layers in weight.
While correlation coefficients always leave some room for normative interpretation, we would consider those correlations to be not extremely high (> 0.9), and even rather low between several types of city relationships in some cases. This illustrates the necessity to consider the multilayer city network instead of a single layer network. Each type of relationship usually shows a higher correlation with two or three other types and a lower correlation with the others. For example, ‘industrial’ relationships between cities are highly correlated with ‘IT’ and ‘research’ relationships, perhaps because technology is central to their functioning. The pattern of industry relationships is least correlated with relationships that are traditionally more associated with a service economy, for example, ‘finance’, ‘government’ and ‘culture’. The pattern of relationships for especially ‘finance’ and ‘government’ is particularly dissimilar, but the ‘finance’ relationships are also less similar to those in ‘IT’ and ‘industry, suggesting that the finance network layer is on average most dissimilar to the other types, perhaps because the command-and-control centres of financial institutions are relatively concentrated in a handful of cities. Beyond finance, a low correlation is also found for ‘culture’ and ‘government’, which is perhaps surprising too as capital cities tend to have been ‘consumer cities avant la lettre’, endowed with a surplus of cultural amenities (Cardoso & Meijers, Citation2016). This analysis of relations involving all 42,778 city pairs studied here suggests already that different types of relations show quite different network patterns.
4.2. Multiplexity in the top relationships
To show more details of the multiplexity in the Chinese urban system, we narrowed it down to the top-100 relationships with the highest linkage weight in each layer, as mapping information on 42,778 pairs of cities would render these maps unreadable. The mapped results are presented in , where the darker links reoccur more often in the top-100 of the six types of relationships. Orange links indicates that the pair of cities only occurs in the top-100 of just one or two types of relationship and a black line means that this city pair appears in the top-100 of all or five out of the six layers.
Figure 1. Networks between cities in different categories.
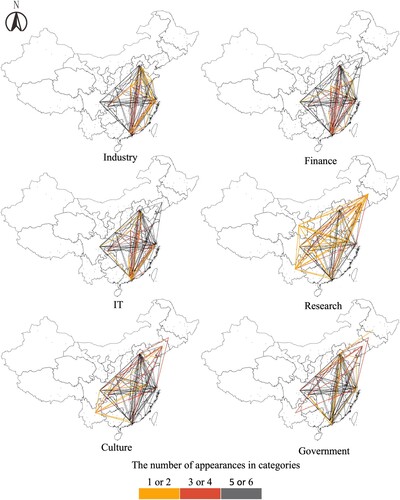
The main overlapping network pattern (black links) of the six types of relationships is between YRD in the east, Pearl River Delta (PRD) in the south, and the cities Beijing and Tianjin in the north, Chengdu, Chongqing in the west, and Wuhan in the middle. This aggregates to a diamond structure. This diamond structure is also observed in previous research, using top company headquarters–subsidiary relationships (Jiang et al., Citation2017) or airline transportation networks (Lao et al., Citation2016). The industry, IT and finance layers are more concentrated in this overlapping area; and the research layer has more unique links than other types of relationships do, and is spatially more expanded, which includes the north-western city Lanzhou in Gansu province for instance. However, in general, cities in the western part are excluded, as they do not reach the threshold for inclusion probably due to their limited size and economic importance.
The absolute link weight also varies significantly within the top shared city relationships in the six categories. shows the top-five strongest relationships between cities in each category in absolute terms.
Table 3. Top five strongest relationships between cities in each category.
As shown in , Beijing–Shanghai has the strongest relationship in all categories but the strength still differs considerably – their relationship in culture is roughly 13 times stronger than that in industry, despite the lexicon for industry being much larger.
We also counted the number of cities in the top-100 relationships of each layer and calculated the network density, respectively. The network density is a measure of the number of relationships compared to the maximum possible number of relationships, which is defined as:
where n is the number of cities connected; and m is the number of relationships.
Within the top-100 relationships, the patterns vary with the number of cities and network density. The result is shown in . The ‘number of cities’ presents how many different cities are included in the top-100 of relationships per network layer.
Table 4. Network density of the top 100 relationships.
The top-100 research and the government relationships are all between high-level administration cities, which generally are innovation and decision-making powerhouses (Li & Wu, Citation2012; Ma, Citation2005). However, they show opposite network patterns. The research relationships have the highest network density with the lowest number of cities included, but the government relationships are exactly the opposite, involving more cities, but with a lower network density. The rest fall in between.
4.3. Multiplexity in terms of population and distance effects
So far we have focused on the strongest relationships in absolute terms, but it is obviously not a surprising find to see that the largest cities top the rankings as this is not necessarily a reflection of strong network embeddedness, but may simply come forward from their size. To evaluate multiplexity in more relative terms, we use the gravity model to examine how the relationships relate with the population and distance. The gravity model in geography is a commonly used method for estimating the pattern of intercity relationships by taking into account the population size and distance between cities, and this allows to compare the effects of population and distance on frequency of co-occurrences (Meijers & Peris, Citation2019).
The population data were gathered from the 2019 China provincial statistical yearbooks. The results of the gravity model are shown in .
Table 5 Estimation results based on the gravity model.
The results in show that the network pattern of the six types of relationships are all explained by population sizes and distances between cities, but the overall level of the adjusted R2 is not that high for applications of the gravity model. Apparently, other factors beyond size and distance also play an important role in forging relationships. We can also see that there are quite considerable differences in the adjusted R2 for the different types of networks. Especially the financial and cultural relationships are much less explainable by population and distance than the others. Zooming in on individual factors, the coefficient of distance (ln) shows that the government relationships between cities decay much faster with distance than the other types of relationships, whereas the population factors are less important for finance relationships than they are for other relationships. compares observed, absolute values with relative values as predicted by the gravity model, which is expressed in a percentage more or less than expected.
Table 6. Top five strongest relationships between cities in each category, accounting for size and distance.
As can be seen in , the gravity model underestimates the strength of the relationships between the main Chinese cities, and the strength of these relationships is much stronger than expected. Most of the top relationships in relative terms are the same as those in the top toponym co-occurrence relationships in absolute terms (). However, it is interesting to note that some relatively small (by Chinese standards) and peripheral cities in the research category (Lanzhou, Kunming and Shenyang) are well embedded in networks. Newcomers in the government category include Macau and Hong Kong.
5. CONCLUSIONS
As a summative content analysis method, the toponym co-occurrence approach has great potential to reconstruct intercity network structures; however, the precise meaning of such relationships remains somewhat unclear, and one needs to embrace the basic underlying assumption that when two place names are frequently mentioned in one breath, this suggests that they are strongly related. Note that this is the standard assumption underlying all applications of text analysis. While the reliability of our approach primarily rests on following common and validated procedures in collocation analysis, the fact that the network patterns for different types of relationships obtained corresponds to some extent with the gravity model is reassuring, as is our finding that general patterns found correspond with results of other studies.
Deriving relationships between cities from toponym co-occurrences in text corpora has huge potentials in that it can be applied in situations where traditional data is not even available. Moreover, it overcomes weaknesses of traditional data sources, for instance by providing a uniform and harmonized method to analyse cross-border relationships, or because it can be applied to places (or regions, or countries, or firms, etc.) of any size, which sample data often cannot. This paper aimed to stimulate further discussion on the toponym co-occurrence method, and provides one of the first attempts to give more meaning to those co-occurrences by classifying them, and as a result capture and explore network multiplexity. Rather than suggesting machine-learning approaches, we proposed a lexicon-based classification approach, which means that we considered texts in which two cities were both mentioned and tried to make sense of how they were related by examining the context in which they were mentioned. Using this lexicon-based approach we could zoom in on six broad categories of relationships. As broad or very specific lexicons can be developed and adapted to fit with every possible research problem, the main result of this paper is obviously showing that such an approach is possible indeed, which opens up a plethora of possible future research. Regarding the risk of toponym ambiguity, we have tried to use keywords that are less ambiguous, hence with only one meaning, or with just one very dominant meaning. If the chosen words have only one dominant meaning, the risk of content ambiguation will be low, as research (Guo et al., Citation2007; Lucas, Citation1999) shows that although the actual meaning of a word depends on the context, this context effect has only a limited effect if the word has a dominant meaning.
The principle of our method is based on the commonly used collocation analysis in linguistic and data science analysis – in a large corpus the frequency of co-appearance of keywords can imply the relationship strength between these keywords, ignoring the actual text structure. This rule is not limited to a specific language as such method has been successfully applied in English (Gregory et al., Citation2015), Dutch (Meijers & Peris, Citation2019), French (Baker & Vessey, Citation2018) and Chinese (Liu et al., Citation2014), for instance. The methodological innovation of our paper is that we advanced the traditional collocation analysis by grouping it with a bag of semantically related keywords, and this tagging allows to classify a relationship between a pair of cities. This basic principle can be applied in any language, and one can choose very specific keywords to detail relationships between places, regions or countries. Therefore, we believe this method has wide application potential.
Here, we were mainly interested in showing the multiplexity of interurban relationships in China, one of the many countries where national level data on relations between cities is largely missing. A diamond-shaped structure of relationships characterizes the urban system of China, and this structure is anchored on the YRD in the east, PRD in the south, the cities Beijing and Tianjin in the north, Chengdu, Chongqing in the west, and Wuhan in the centre, which are the economic powerhouses. However, we also showed that network patterns of different types of relationships differ substantially from each other, and this calls for prudence in making bold claims on the structure of urban systems when these are based on the analysis of just one type of relationship. For instance, we found that city relationships in government decay much faster than other types which suggests that governmental collaborations are often restricted to nearby cities. Especially the patterns of research relationships differ, involving fewer cities, but creating stronger relationships. The government network pattern involves more cities, but these are more loosely related. Likewise, patterns in finance and culture follow the regularities of the gravity model much less than the other types. Yet, while this paper highlights the necessity of revealing the multiplexity of city networks, our results actually also show that each type of relationship is not completely independent from some other types of relations.
Toponym co-occurrences can revolutionize the study of city networks, certainly now that we can distinguish more specific types of relationships rather than just the overall strength of a relationship. While we used rather general categories here, future research needs to concentrate on the suitability of a lexicon-based approach using much more specific keywords to retrieve very specific types of relationships. As such, the lexicon-based approach provides more flexibility than supervised machine-learning techniques. Research could also address an omission in our approach, namely not taking into account the text structure yet, such as the separation between the place where toponyms occur in a text; for instance, it probably makes a difference whether they are mentioned in the same sentence, or whether there are ten sentences in between. We also recommend using different types of text corpora, and pay more attention to how texts develop. One drawback of our use of a web archive is that larger cities may be disproportionally more mentioned on webpages than smaller cities which could be an alternative explanation for our finding that the relative strength of relationships between the main Chinese cities is many times higher than we would expect based on gravity modelling. What the trend is in this regard is yet unknown, and it would be interesting to see time series of toponym co-occurrences for different types of relations. The quality of an analysis based on co-occurrences ultimately rests on the quality of a text corpus. We recommend using more specific or targeted text corpora now that we have tried broad web archives. The comparison should indicate whether results remain largely similar or not. Insofar these other measures are good proxies themselves, a certain correspondence of the results would further enhance credibility of the lexicon-based approach. Research could also concentrate on comparisons with network patterns obtained through more traditional methods, for example, human migration data and capital flow data. Despite the challenges still ahead, we are convinced that the toponym co-occurrence method can spark a new perspective in studying city networks in the digital era.
Supplemental Material
Download PDF (385.4 KB)ACKNOWLEDGEMENTS
The authors thank Zhao Yin and Ziyu Bao at Delft University of Technology for computer programming support. The paper also benefitted from feedback received at various international conferences and research seminars, as well as constructive feedback from external reviewers.
DISCLOSURE STATEMENT
No potential conflict of interest was reported by the authors.
REFERENCES
- An, D., Tong, X., Liu, K., & Chan, E. (2019). Understanding the impact of built environment on metro ridership using open source in Shanghai. Cities, 93, 177–187. https://doi.org/10.1016/j.cities.2019.05.013
- Baeza-Yates, R., Blanco, R., & Castellanos, M. (2016). Web text mining. In R. Mitkov (Ed.), The Oxford handbook of computational linguistics (2nd ed., pp. 1013–1030). Oxford University Press.
- Baker, P., Gabrielatos, C., Khosravinik, M., Krzyżanowski, M., McEnery, T., & Wodak, R. (2008). A useful methodological synergy? Combining critical discourse analysis and corpus linguistics to examine discourses of refugees and asylum seekers in the UK press. Discourse and Society, 19(3), 273–306. https://doi.org/10.1177/0957926508088962
- Baker, P., & Vessey, R. (2018). A corpus-driven comparison of English and French Islamist extremist texts. International Journal of Corpus Linguistics, 23(3), 255–278. https://doi.org/10.1075/ijcl.17108.bak
- Baxter, L., & Montgomery, B. (1996). Relating: Dialogues and dialectics. Guilford.
- Bengio, Y., Ducharme, R., Vincent, P., & Jauvin, C. (2003). A neural probabilistic language model. Journal of Machine Learning Research, 3(Feb), 1137–1155. https://www.iro.umontreal.ca/~vincentp/Publications/lm_jmlr.pdf.
- Berroir, S., Cattan, N., Dobruszkes, F., Guérois, M., Paulus, F., & Vacchiani-Marcuzzo, C. (2017). Les systèmes urbains français: Une approche relationnelle. Cybergeo: European Journal of Geography, Document, 807. https://doi.org/10.4000/cybergeo.35587
- Biber, D., Johansson, S., Leech, G., Conrad, S., Finegan, E., & Quirk, R. (1999). Longman grammar of spoken and written English (Vol 2). Longman.
- Burger, M., de Goei, B., Van der Laan, L., & Huisman, F. (2011). Heterogeneous development of metropolitan spatial structure: Evidence from commuting patterns in English and Welsh city-regions, 1981–2001. Cities, 28(2), 160–170. https://doi.org/10.1016/j.cities.2010.11.006
- Burger, M., Meijers, E., & Van Oort, F. (2014a). Multiple perspectives on functional coherence: Heterogeneity and multiplexity in the Randstad. Tijdschrift voor Economische en Sociale Geografie, 105(4), 444–464. https://doi.org/10.1111/tesg.12061
- Burger, M., Van der Knaap, B., & Wall, R. (2014b). Polycentricity and the multiplexity of urban networks. European Planning Studies, 22(4), 816–840. https://doi.org/10.1080/09654313.2013.771619
- Callon, M., Courtial, J., Turner, W., & Bauin, S. (1983). From translations to problematic networks: An introduction to co-word analysis. Social Science Information, 22(2), 191–235. https://doi.org/10.1177/053901883022002003
- Cao, Z., Peng, Z., & Derudder, B. (2021). Interurban scientific collaboration networks across Chinese city-regions. Environment and Planning A: Economy and Space, 53(1), 6–8. https://doi.org/10.1177/0308518X20938381
- Capello, R. (2000). The city network paradigm: Measuring urban network externalities. Urban Studies, 37(11), 1925–1945. https://doi.org/10.1080/713707232
- Cardoso, R., & Meijers, E. (2016). Contrasts between first-tier and second-tier cities in Europe: A functional perspective. European Planning Studies, 24(5), 996–1015. https://doi.org/10.1080/09654313.2015.1120708
- Chew, C., & Eysenbach, G. (2010). Pandemics in the age of twitter: Content analysis of tweets during the 2009 H1N1 outbreak. PloS ONE, 5(11), e14118. https://doi.org/10.1371/journal.pone.0014118
- Culpeper, J. (2009). Keyness: Words, parts-of-speech and semantic categories in the character-talk of Shakespeare’s Romeo and Juliet. International Journal of Corpus Linguistics, 14(1), 29–59. https://doi.org/10.1075/ijcl.14.1.03cul
- Davoudi, S. (2008). Conceptions of the city-region: A critical review. Proceedings of the Institution of Civil Engineers – Urban Design and Planning, 161(2), 51–60. https://doi.org/10.1680/udap.2008.161.2.51
- Derudder, B., & Neal, Z. (2018). Uncovering links between urban studies and network science. Networks and Spatial Economics, 18(3), 441–446. https://doi.org/10.1007/s11067-019-09453-w
- Derudder, B., & Taylor, P. J. (2018). Central flow theory: Comparative connectivities in the world-city network. Regional Studies, 52(8), 1029–1040. https://doi.org/10.1080/00343404.2017.1330538
- Derudder, B., Taylor, P., Witlox, F., & Catalano, G. (2003). Hierarchical tendencies and regional patterns in the world city network: A global urban analysis of 234 cities. Regional Studies, 37(9), 875–886. https://doi.org/10.1080/0034340032000143887
- Derudder, B., & Witlox, F. (2005). An appraisal of the use of airline data in assessing the world city network: A research note on data. Urban Studies, 42(13), 2371–2388. https://doi.org/10.1080/00420980500379503
- Devriendt, L., Boulton, A., Brunn, S., Derudder, B., & Witlox, F. (2011). Searching for cyberspace: The position of major cities in the information age. Journal of Urban Technology, 18(1), 73–92. https://doi.org/10.1080/10630732.2011.578410
- Devriendt, L., Derudder, B., & Witlox, F. (2008). Cyberplace and cyberspace: Two approaches to analyzing digital intercity linkages. Journal of Urban Technology, 15(2), 5–32. https://doi.org/10.1080/10630730802401926
- Fanelli, D., Costas, R., & Larivière, V. (2015). Misconduct policies, academic culture and career stage, not gender or pressures to publish, affect scientific integrity. PloS ONE, 10(6), e0127556. https://doi.org/10.1371/journal.pone.0127556
- Gregory, I., Cooper, D., Hardie, A., & Rayson, P. (2015). Spatializing and analyzing digital texts: Corpora, GIS and places. Spatial Narratives and Deep Maps, 150–178. https://e-space.mmu.ac.uk/579357/. https://doi.org/10.2307/j.ctt1zxxzr2.11
- Griffin, L. (1993). Narrative, event-structure analysis, and causal interpretation in historical sociology. American Journal of Sociology, 98(5), 1094–1133. https://doi.org/10.1086/230140
- Guo, J., Shu, H., & Li, P. (2007). Context effects in lexical ambiguity processing in Chinese: A meta-analysis. Journal of Cognitive Science, 8(1), 85–101. https://doi.org/10.17791/jcs.2007.8.1.85
- Hidalgo, C., & Hausmann, R. (2009). The building blocks of economic complexity. Proceedings of the National Academy of Sciences, 106(26), 10570–10575. https://doi.org/10.1073/pnas.090094310
- Hsieh, H., & Shannon, S. (2005). Three approaches to qualitative content analysis. Qualitative Health Research, 15(9), 1277–1288. https://doi.org/10.1177/1049732305276687
- Hu, X., Wang, C., Wu, J., & Stanley, H. (2020). Understanding interurban networks from a multiplexity perspective. Cities, 99, 102625. https://doi.org/10.1016/j.cities.2020.102625
- Hu, Y., Ye, X., & Shaw, S. (2017). Extracting and analyzing semantic relatedness between cities using news articles. International Journal of Geographical Information Science, 31(12), 2427–2451. https://doi.org/10.1080/13658816.2017.1367797
- Hunston, S. (2002). Pattern grammar, language teaching, and linguistic variation. Using Corpora to Explore Linguistic Variation 9, 167–183. https://doi.org/10.1075/scl.9.11hun
- Janc, K. (2015). Geography of hyperlinks – spatial dimensions of local government websites. European Planning Studies, 23(5), 1019–1037. https://doi.org/10.1080/09654313.2014.889090
- Järv, O., Ahas, R., Saluveer, E., Derudder, B., & Witlox, F. (2012). Mobile phones in a traffic flow: A geographical perspective to evening rush hour traffic analysis using call detail records. PloS ONE, 7(11), e49171. https://doi.org/10.1371/journal.pone.0049171
- Jiang, S., Alves, A., Rodrigues, F., Ferreira, J., & Pereira, F. (2015). Mining point-of-interest data from social networks for urban land use classification and disaggregation. Computers, Environment and Urban Systems, 53, 36–46. https://doi.org/10.1016/j.compenvurbsys.2014.12.001
- Jiang, X., Yang, Y., Wang, S., Wang, M., & Yang, Y. (2017). Spatial structure of Chinese intercity network based on the data of listed companies. City Planning Review, 41(6), 18–26. https://doi.org/10.3390/land11060823
- Lao, X., Zhang, X., Shen, T., & Skitmore, M. (2016). Comparing China's city transportation and economic networks. Cities, 53, 43–50. https://doi.org/10.1016/j.cities.2016.01.006
- Li, Y., & Wu, F. (2012). The transformation of regional governance in China: The rescaling of statehood. Progress in Planning, 78(2), 55–99. https://doi.org/10.1016/j.progress.2012.03.001
- Liu, S., Wan, Y., & Zhang, A. (2020). Does China’s high-speed rail development lead to regional disparities? A network perspective. Transportation Research Part A: Policy and Practice, 138, 299–321. https://doi.org/10.1016/j.tra.2020.06.010
- Liu, X., Derudder, B., & Wu, K. (2016). Measuring polycentric urban development in China: An intercity transportation network perspective. Regional Studies, 50(8), 1302–1315. https://doi.org/10.1080/00343404.2015.1004535
- Liu, Y., Wang, F., Kang, C., Gao, Y., & Lu, Y. (2014). Analyzing relatedness by toponym Co-occurrences on Web pages. Transactions in GIS, 18(1), 89–107. https://doi.org/10.1111/tgis.12023
- Lucas, M. (1999). Context effects in lexical access: A meta-analysis. Memory & Cognition, 27(3), 385–398. https://doi.org/10.3758/BF03211535
- Ma, L. (2005). Urban administrative restructuring, changing scale relations and local economic development in China. Political Geography, 24(4), 477–497. https://doi.org/10.1016/j.polgeo.2004.10.005
- Meijers, E., Burger, M., & Hoogerbrugge, M. (2016). Borrowing size in networks of cities: City size, network connectivity and metropolitan functions in Europe. Papers in Regional Science, 95(1), 181–198. https://doi.org/10.1111/pirs.12181
- Meijers, E., & Peris, A. (2019). Using toponym co-occurrences to measure relationships between places: Review, application and evaluation. International Journal of Urban Sciences, 23(2), 246–268. https://doi.org/10.1080/12265934.2018.1497526
- Mello, R. (2002). Collocation analysis: A method for conceptualizing and understanding narrative data. Qualitative Research, 2(2), 231–243. https://doi.org/10.1177/146879410200200206
- Neal, Z. (2012). The connected city: How networks are shaping the modern metropolis. Routledge.
- Pan, F., Bi, W., Liu, X., & Sigler, T. (2020). Exploring financial centre networks through inter-urban collaboration in high-end financial transactions in China. Regional Studies, 54(2), 162–172. https://doi.org/10.1080/00343404.2018.1475728
- Peris, A., Meijers, E., & Van Ham, M. (2018). The evolution of the systems of cities literature since 1995: Schools of thought and their interaction. Networks and Spatial Economics, 18(3), 533–554. https://doi.org/10.1007/s11067-018-9410-5
- Porter, C., Atkinson, P., & Gregory, I. (2015). Geographical text analysis: A new approach to understanding nineteenth-century mortality. Health & Place, 36, 25–34. https://doi.org/10.1016/j.healthplace.2015.08.010
- Rosengren, K. (1981). Advances in content analysis. Sage.
- Salvini, M., & Fabrikant, S. (2016). Spatialization of user-generated content to uncover the multirelational world city network. Environment and Planning B: Planning and Design, 43(1), 228–248. https://doi.org/10.1177/0265813515603868
- Schuckert, M., Liu, X., & Law, R. (2015). Hospitality and tourism online reviews: Recent trends and future directions. Journal of Travel & Tourism Marketing, 32(5), 608–621. https://doi.org/10.1080/10548408.2014.933154
- Scott, M. (1999). WordSmith tools help manual, Version 3.0.
- Sinclair, J., & Sinclair, L. (1991). Corpus, concordance, collocation. Oxford University Press.
- Song, J., Zhang, H., & Dong, W. (2016). A review of emerging trends in global PPP research: Analysis and visualization. Scientometrics, 107(3), 1111–1147. https://doi.org/10.1007/s11192-016-1918-1
- Song, Y., Shi, S., Li, J., & Zhang, H. (2018). Directional skip-gram: Explicitly distinguishing left and right context for word embeddings. In Proceedings of the 2018 Conference of the North American Chapter of the Association for Computational Linguistics: Human Language Technologies, Vol. 2, 175–180. https://doi.org/10.18653/v1/N18-2028
- Taylor, P., Ni, P., Derudder, B., Hoyler, M., Huang, J., & Witlox, F. (2012). Global urban analysis: A survey of cities in globalization. Routledge.
- Tobler, W., & Wineburg, S. (1971). A Cappadocian speculation. Nature, 231(5297), 39–41. https://doi.org/10.1038/231039a0
- Tongjing, W., Yin, Z., Bao, Z., & Meijers, E. (2022). Dataset of intercity relationships between 293 Chinese cities extracted and classified on the basis of toponym co-occurrences on Common Crawl. https://www.researchgate.net/publication/362952059_Dataset_of_intercity_relationships_between_293_Chinese_cities_extracted_and_classified_on_the_basis_of_toponym_co-occurrences_on_Common_Crawl
- Vaughan, L., & You, J. (2010). Word co-occurrences on webpages as a measure of the relatedness of organizations: A new webometrics concept. Journal of Informetrics, 4(4), 483–491. https://doi.org/10.1016/j.joi.2010.04.005
- Watts, D. (2004). The “new” science of networks. Annual Review of Sociology, 30(1), 243–270. https://doi.org/10.1146/annurev.soc.30.020404.104342
- Yang, H., Dijst, M., Witte, P., Van Ginkel, H., & Wang, J. (2019). Comparing passenger flow and time schedule data to analyse high-speed railways and urban networks in China. Urban Studies, 56(6), 1267–1287. https://doi.org/10.1177/0042098018761498
- Zhang, J., & Peck, J. (2016). Variegated capitalism, Chinese style: Regional models, multi-scalar constructions. Regional Studies, 50(1), 52–78. https://doi.org/10.1080/00343404.2013.856514
- Zhang, W., Derudder, B., Wang, J., & Witlox, F. (2020). An analysis of the determinants of the multiplex urban networks in the Yangtze River Delta. Tijdschrift Voor Economische en Sociale Geografie, 111(2), 117–133. https://doi.org/10.1111/tesg.12361
- Zhong, X., Liu, J., Gao, Y., & Wu, L. (2017). Analysis of co-occurrence toponyms in web pages based on complex networks. Physica A: Statistical Mechanics and its Applications, 466, 462–475. https://doi.org/10.1016/j.physa.2016.09.024