
 ?Mathematical formulae have been encoded as MathML and are displayed in this HTML version using MathJax in order to improve their display. Uncheck the box to turn MathJax off. This feature requires Javascript. Click on a formula to zoom.
ABSTRACT
This study explores the relationship between the clustering of betting shops and crime in England using both spatial and multilevel modelling approaches. Spatial analysis revealed significant clustering of betting shops and crime across all crime types. Results from the multilevel models revealed statistically significant relationships between the number of betting shops and all the crime categories, with the strongest relationships observed with theft and disorder offences. These relationships were observed after controlling for socio-demographic and land-use predictors of crime. To reduce the effect of betting shops on crime, efforts should focus on place management strategies.
1. INTRODUCTION
The proliferation of gambling opportunities and their potential impact on increased levels of crime have afforded considerable attention in the research literature (Adolphe et al., Citation2019; Albanese, Citation2019; Kumar & Yoshimoto, Citation2017; Lan et al., Citation2020). Previous studies have approached this from either the perspective of examining individual behaviour or by analysing the spatial relationship between crime, gambling facilities and their surrounding environs, for example, nearby streets or neighbourhoods. Studies of the former investigate the relationship between problematic or addictive gamblers and crime and suggest high-risk individuals may commit crime to support their problematic gambling behaviour (Binde, Citation2016; Laursen et al., Citation2016). In contrast, studies at the area level consider gambling establishments as a potential risky facility for crime (Bottan et al., Citation2017; Kim et al., Citation2016; Lan et al., Citation2020). The contention is that the presence of a gambling establishments increases the risk of crime either within or in their immediate vicinity.
A literature review of 32 empirical studies (Albanese, Citation2019) into the relationship between gambling facilities and crime, predominantly in North America and Australia, revealed mixed findings. Several studies have identified a statistically significant positive relationship between the presence of casinos and crime rates (Arthur et al., Citation2014; Bottan et al., Citation2017; Kim et al., Citation2016). Other studies have found no relationship between casino or gaming machines and crime (Barthe & Stitt, Citation2009; Humphreys & Soebbing, Citation2014; Johnson & Ratcliffe, Citation2017; Nichols & Tosun, Citation2017).
In the UK, there is a paucity of studies examining the relationship between betting shop and crime, although some studies have explored the spatial relationship between gambling opportunities and deprivation (Adeniyi et al., Citation2020; Wardle et al., Citation2014). Portas (Citation2011) described gambling establishments as a blight on the community and classified them as one of the predatory establishments that prey on vulnerable communities. Critics further ascribe that they serve as attractors of antisocial and criminal behaviours (Martin, Citation2019; Newham Council, Citation2016), but they frequently rely on the findings from studies conducted in North America, especially in the United States. In addition to being North America focused, most of the studies examine the relationship between crime and casinos.
A further type of gambling establishment that has received less attention is betting shops. The few studies that have explored the relationship between betting shops and crime in the UK also found mixed evidence. Griffiths (Citation2011) found no linkage between betting shops and crime and strongly disputed the notion of causality between betting shops and crime, whereas Kumar and Yoshimoto (Citation2017) estimated that there is 0.3–1.3% increase in the count of betting shops observed for a 1% increase in crime, and they strongly inferred causality. Cassidy (Citation2014) identified that both patrons and workers of betting shops, especially women, are prone to be victims of crime, especially sexual harassment, burglary and violence. At this point it is pertinent to draw a strong distinction between the gambling landscape in the United States and the UK. Historically, the US gambling landscape is dominated by large-scale casinos, whereas the UK has a greater proportion of betting shops. In the UK, casinos are classified as city-centre attractions in the National Planning Policy Framework (NNPF) by the Ministry of Housing, Communities and Local Government (MHCLG) (Citation2012). In addition, the catchment area of a casino is large, and they cater for both local visitors and tourist population, whereas betting shops serve mostly local communities on a smaller scale.
This paper argues that the US context of gambling/casinos and the evidence identified from this (which is also mixed) is not an appropriate mechanism or evidence base for developing UK policy, especially for betting shops. More importantly, no study in the UK has extensively looked at the relationship between betting shops and crime at a national level. This provides strong justification for this study which seeks to investigate the relationship between presence of betting shops and crime at the lower super output area (LSOA) level across all of England. LSOAs are small neighbourhoods designed to report small area statistics and have an average population of 1500, or 650 households.
This study addresses the following research questions:
What is the spatial relationship between betting shops and crime?
Does the relationship subsist after controlling for the impact of neighbourhood characteristics (socio-demographic, deprivation and land-use types)?
Does the relationship vary by crime type (e.g., theft, burglary, criminal damage, violence)?
This study uses geospatial and multilevel modelling approaches to address these research questions. Based on the literature review, 10 distinct types of police recorded crime (antisocial behaviour (ASB), bicycle theft, other theft, public disorder, shoplifting, theft from person, burglary, criminal damage and arson, robbery, and vehicle crime) have been identified for analysis – as the literature suggests betting shops will have a greater impact on some crime types than others. In addition, the study controls for a range of theory informed predictors of crime. We draw on social disorganization theory (Sampson & Groves, Citation1989; Shaw & McKay, Citation1942), risky facilities (Eck et al., Citation2007), and crime generators and attractors (Brantingham & Brantingham, Citation1995) perspectives discussed in more detail in the next section.
2. THEORY AND LITERATURE
The spatial patterns of crime are not random and instead are concentrated in time and place (Sherman et al., Citation1989; Weisburd, Citation2015). Explanations for these concentrations of crime mainly draw from the literature on opportunity theories of crime, linked to routine activities (Cohen & Felson, Citation1979), lifestyles (Hägerstrand, Citation1985), urban mobility flow (Newton et al., Citation2021; Newton & Felson, Citation2015), the underlying processes of offender movement, risky facilities (Eck et al., Citation2007), and the inherent structures of crime locations (Hipp, Citation2016; Sampson & Groves, Citation1989; Song et al., Citation2013).
Eck et al. (Citation2007) suggest explanations for crime concentration can be linked to risky facilities, and they identify how some facilities may be riskier than others. This complements the notion of crime attractors and crime generators (Brantingham & Brantingham, Citation1995). Some places may be target rich and considered both people generators (Newton, Citation2018) and crime generators. Whilst offenders do not specifically target these places, the presence of large numbers of people create target rich opportunities for offenders. Alternatively, places may act as attractors for crime, with a reputation for known opportunities for offending often associated with cash economies (Bernasco & Block, Citation2011). Insufficient place management, for example, a lack of capable guardianship or supervision, may further explain why some facilities are riskier than others (Eck et al., Citation2017). Whilst explanations tend to focus on place management within facilities, Linning et al. (Citation2021) revisit the work of Jane Jacobs to consider how the ‘eyes on the street’ may extend place management to the vicinity of risky facilities.
Alternative explanations of crime concentration consider the structure of neighbourhoods and communities, such as social cohesion (Sampson & Groves, Citation1989) and the collective efficacy (Sampson et al., Citation1997) of places. These explanations are concerned with how community structures might influence levels of informal social control and therefore the presence or absence of crime; and how trust and cohesion might increase social enforcement or guardianship that might decrease crime. In addition, several crime and place studies use other neighbourhood characteristics such as deprivation, ethnic heterogeneity, levels of education, housing tenure and price, and employment as explanatory variables for crime (Goudriaan et al., Citation2006; Snowden, Citation2019).
Indeed, a challenge here is to unpack the microlevel influence of risky facilities and the potential interaction of this with local neighbourhood and community structures/characteristics. Several studies have examined what might constitute a crime attractor or ‘negative environmental attributes’ including adult bookstores, pawn shops and cash checking facilities, liquor stores and single-room-occupancy hotels (Loukaitou-Sideris, Citation1999), and transport exchanges, drug markets, pharmacy stores, insecure parking lots, gas stores and bar districts (Brantingham & Brantingham, Citation1995).
Drawing upon the social disorganization theory and risky facilities (crime attractors and generators) perspective, this paper argues that betting shops are risky facilities, and therefore the proliferation of betting shops further increases the level of disorganization within communities, which is linked to crime rates (Sampson & Groves, Citation1989). For instance, introduction of a betting shop in a neighbourhood would lead not only to an increase in the daytime and night-time footfall but also to the flow of commuters in the neighbourhood and act as nodes which will eventually reduce the ability of the neighbourhood to regulate or affect social control (Bursik & Grasmick, Citation1999; Sampson et al., Citation1997). They may also serve as a crime attractor or generator – especially if coupled with the presence of other risky facilities such as commercial land-use, retail outlets, pubs, alcohol outlets, bars, shopping centres in these neighbourhoods, as betting shops may further exacerbate potentials for criminal activities.
3. THE DATA
3.1. Police-recorded crime data (PRCD)
PRCD at the LSOA (N = 32,844) level was used to examine whether there was a relationship between number of betting shops and crime across England. The data were derived from a publicly available registerFootnote1 across two time points (2015 and 2019).
3.2. Betting shops data
Data on betting shops were obtained from the UK Gambling Commission which provides a register of all licenced gambling locations in the UK. The data were collected for two time points, 2015 and 2019. The addresses and postcodes of all betting shops in England were extracted from the overall UK dataset. The betting shops’ addresses were thereafter geocoded using the geocode function of the ggmap package in R (Kahle, Citation2019) and further aggregated to LSOA geography (N = 32,844).
3.3. Point-of-interest (POI) data
POI data were obtained from Digimap – EDINA, which provides maps and geospatial data for the Ordnance Survey (OS). The POI data available were for 2019 and the same data were used for both 2015 and 2019. The data included geocoded locations of bus stops, food and drink places, which comprise banquets, cafés and tea shops, fast food and take away shops, fish and chips shops, internet cafés, pubs, bars, inns and restaurants in England. These were all aggregated to LSOA geography (N = 32,844).
3.4. The UK census, population size and area type data
This study also used the 2011 UK Census to construct several control variables at the LSOA level, such as concentrated disadvantage, residential instability and ethnic heterogeneity (N = 32,844). The census data were obtained from NOMIS (the official labour market statistics website of the Office for National Statistics – ONSFootnote2) and was the same for both 2015 and 2019. We used mid-year population estimates based on the UK Census 2011 for both 2014 and 2018 (ONS, Citation2015, Citation2019). The area type variable was on the rural urban classification (2011) of LSOAs in England and Wales (ONS, Citation2017) (N = 32,800).
3.5. Education deprivation data
Data on education deprivation were obtained from the MHCLG for both 2015 and 2019 (N = 32,844). They grouped all LSOAs in 10 different deciles (categories). Only deciles 1 and 10 (10% most and least deprived LSOAs, respectively) were adopted for this research.
3.6. Measures of crime
We investigated 10 different types of police recorded crime (i.e., ASB, bicycle theft, other theft, public disorder, shoplifting, theft from person, burglary, criminal damage and arson, robbery, and vehicle crime) and all crime as dependent variables to thoroughly examine the relationship between betting shops and crime in England. These dependent variables are count variables, meaning they take values of 0, 1, 2, etc. We excluded some other crime types such as drugs, other crimes, possession of weapons, and violence and sexual offences. Violence and sexual offences were excluded because of the nature of the data as it was not possible to analyse the effect of betting shops on violence and sexual offences separately. Other crime types mentioned were excluded based on evidence from literature that gambling related crimes are mostly non-violent in nature (Banks & Waugh, Citation2019; Reece, Citation2010). presents descriptive statistics on the dependent variables.
Table 1. Descriptive statistics of the dependent variables.
3.7. Theory informed variable selection
Informed by the theories discussed above, several variables were controlled for (see the data section) whilst examining the association between the number of betting shops and selected dependent variables. They include the following:
Area type (four urban and four rural areas).
Population size.
Ethnic heterogeneity index.
Percentage of private renter households.
Percentage of social renter households.
Education domain of deprivation (deciles).
Number of bus stops.
Number of eat and drink shops, which include banquets, cafés and tea shops, fast-food shops, fish and chips shops, internet cafés, pubs, bars, inns and restaurants.
Percentage of lone-parent households.
Percentage of households with a head who has a higher managerial occupation.
Percentage of households with a head who is unemployed.
Area type is an indicator of urbanization. There were four rural area types and four urban area types, which included: (1) Rural town and fringe, (2) Rural town and fringe in a sparse setting, (3) Rural village and dispersed, (4) Rural village and dispersed in a sparse setting, (5) Urban city and town, (6) Urban city and town in a sparse setting, (7) Urban major conurbation, and (8) Urban minor conurbation. We created seven dummy variables where rural town and fringe was selected as the reference category. Ethnic heterogeneity index is based on the Herfindahl–Hirschman index (HHI), which is calculated as:
(1)
(1) where B, A, M, W and O are the number of residents Black, Asian, Mixed, White and other ethnicities, respectively, who are living in an LSOA. A score of 1 implies a total heterogeneity, whereas a score of 0 refers to the perfect homogeneity (Bernasco & Block, Citation2011; Lan et al., Citation2020). The percentage of private renter households serves as an indicator of residential mobility/instability. The percentage of social renter households, lone-parent households, households with a head who is unemployed and education domain of deprivation are indicators of the concentrated disadvantage and inequality (Lan et al., Citation2020; Sampson et al., Citation1997). Education domain of deprivation measures the lack of attainment and skills in the local population and take values ranging from 1 to 10, where 1 is the most deprived and 10 is the least deprived LSOA (MHCLG, Citation2019). We created dummy variables for education deciles 1 and 10 to test the effect of living in most and least deprived areas on crime, separately.
Households with a head in higher managerial occupations were included as proxy for income. The counts of POIs were added to the models because they are crime generators and attractors which often indicate land uses and influence crime patterns (Lan et al., Citation2020; Wheeler, Citation2019). presents descriptive statistics for the independent and control variables.
Table 2. Descriptive statistics of the independent and control variables.
3.8. Data cleaning and processing
There was no missing data except for the categorical area type variable (N = 32,800). Therefore, although there are 32,844 LSOAs in England, the final sample size of the study was 32,800. In terms of data processing, the census variables were already available at the LSOA level. Therefore, no aggregation was performed for them. To ensure spatial consistency the betting shops and POI data were also aggregated to the LSOA level. In addition, PRCD was monthly, which required aggregation at the year level. For each police force we used the -street.csv Excel spreadsheets (e.g., 2015-01-avon-and-somerset-street.csv, where 2015 indicates the year and 01 the month).
4. METHODOLOGY
4.1. Spatial analysis
This study first employed clustering analysis to detect incidence of the different crime categories and betting shops across the two years to show areas of co-location and high clustering using local indicator of spatial association (LISA) (Anselin, Citation1995) and Getis–Ord Gi statistic (Getis & Ord, Citation1992). These methods have been widely used to show significant spatial clustering and concentration of hotspots (Carpio-Pinedo et al., Citation2022; Cravo et al., Citation2015; Rae, Citation2012).
For the LISA, HH cluster means the occurrence of high–high associations, that is, similar neighbourhoods clusters with similar high observation values. LL represents low occurrence with neighbours also having low occurrence. HL or LH are outliers. They represent spatial association of dissimilar values: high values surrounded by low values for the former, and low values surrounded by high neighbouring values. Getis–Ord Gi statistics identify hotspots (positive and statistically significant z-score values) of betting shops and crime occurrences across at 90%, 95% and 99% confidence intervals.
In addition, spatial weights were defined to implement the LISA and Getis–Ord, check for spatial dependency using Moran’s I (Anselin, Citation1995) and develop spatially lagged variables used in the model. Spatial weights are widely used to estimate the relationship/connectedness between observational spatial units. The weight was created by estimating the neighbours of each spatial unit based on contiguous boundaries (Anselin & Sergio, Citation2014).
4.2. Multilevel modelling
suggests that all dependent variables are over-dispersed, meaning their variances exceed their means. Therefore, the negative binomial specification (Cameron & Trivedi, Citation1998; Osgood, Citation2000) is the appropriate method for the current study. The number of crimes in 2015 and 2019 per LSOA can be considered as repeated observations within each LSOA. The nature of the dataset provided thereby a two-level hierarchy: number of crimes in years (n = 2) nested within LSOAs (n = 32,800).Footnote3
After the spatial analysis, this study used a series of multilevel negative binomial regression models (Cameron & Trivedi, Citation1998; Snijders & Bosker, Citation1999) to examine whether there was an association between the number of betting shops and crime types, controlling for neighbourhood factors that might influence crime in England. Multicollinearity among the independent and control variables in the models were assessed and all variance inflation factor (VIF) values were less than 5, suggesting very low multicollinearity issues (Hair et al., Citation2018) (see Table A1 in Appendix A in the supplemental data online).
The first model included only random intercepts (base model), followed by the addition of the population size variable and the betting shops variable, which is the key independent variable in the study (model 1). We then added all other predictor variables to model 1, which we called model 2.
The fixed part of model 2, for example, accommodates time-varying (measured for each LSOA on each occasion at level 1, represented by the subscript ij) and time-independent predictors (measured for each LSOA at level 2 represented by the subscript j). The random part includes occasion- and LSOA-specific random effects/residuals. A full two-level negative binomial model (model 2) is specified as follows:
(2)
(2) The fixed part gives the general trends across all LSOAs; the random part allows for between- and within-LSOA variations around this general line. For example, we added a random LSOA intercept (u0j) and assumed that the random intercepts come from a Normal distribution.
Having implemented the multilevel negative binomial models, we wanted to account for spatial dependency by adding the spatial lag of the outcome variables to model 2s to develop model 3s. However, it is not possible to account for spatial effects using the negative binomial model. Including the spatial lag in the exponential function has limitations (Glaser, Citation2017). Therefore, the dependent variables in model 3s were treated as continuous variables (log transformed).
The spatial autoregression model (SAR) takes into consideration the spatial spillover effect of the dependent variable and has been used by numerous studies to account for spatial dependency (Guliyev, Citation2020; Nilsson, Citation2022). Therefore, the spatial lag is taken as the average of all neighbourhood LSOAs using the spatial weight explained in the spatial analysis section.
A full two-level linear model (model 3) is specified as follows:
(3)
(3)
5. RESULTS
5.1. Spatial patterns of betting shops and crime in England
The LISA analysis shows some interesting patterns across the two years with similarities in the location of HH clusters for both betting shops and all crime (aggregate of all crimes). These areas include Middlesbrough, London and other major historical centres in England. Most similar and obvious patterns are evident with the HL clusters (outliers) across both phenomena, that is, areas with high betting shops and crime occurrences surrounded by low incidences of both betting shops and crime. and show the LISA maps for Middlesbrough and London for 2015 and 2019 for both betting shops and crime patterns. The maps show important similarities in the spatial patterns of betting shops and crime with evidence of co-location of HH clusters across both cities.
Figure 1. Local indicator of spatial association (LISA) maps of betting shops and all crime categories (combined) in Middlesbrough in 2015: (top) all crimes and (bottom) betting shops.
Sources: Contains Ordnance Survey (OS) data © Crown copyright and database right (2017) and National Statistics data © Crown copyright and database right (2015).
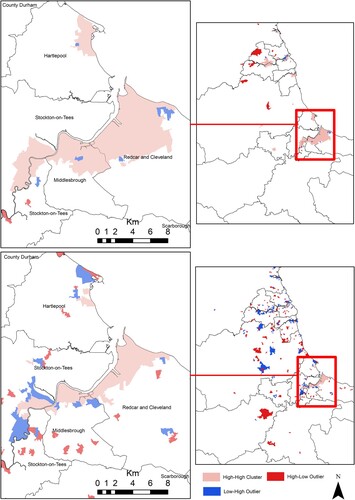
Figure 2. Local indicator of spatial association (LISA) maps of betting shops and all crime categories (combined) in London in 2019: (top) all crimes and (bottom) betting shops.
Source : Contains Ordnance Survey (OS) data © Crown copyright and database right (2017) and National Statistics data © Crown copyright and database right (2015).
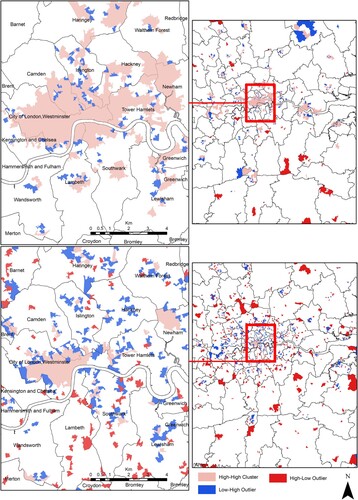
As expected, crime patterns show more evidence of HH clusters compared with betting shops across both areas in and ; most of the neighbourhoods with high crime clusters (HH) coincide with neighbourhoods with a high clustering of betting shops (HH) or outliers (HL and LH).
shows the result of the Getis–Ord with the number of LSOAs with significant clustering for both crime and betting shops and further reinforces the results of the LISA maps. As shown, similar LSOAs in 2015 and 2019 (8.42% and 7.91%, respectively) are classified as having a hotspot of both betting shops and crime occurrence at 90% and 95% confidence levels.
Table 3. Number of lower super output areas (LSOAs) with significant clustering of betting shops and all crimes.
5.2. The effect of betting shops on crime in England
and present results from two-level negative binomial models (i.e., model 2s) and two-level linear models (model 3s), respectively, that tested the relationship between the number of betting shops and all crime, bicycle theft, ASB, other theft, public disorder, shoplifting, and theft from person in an LSOA (see Tables A2–A8 in Appendix A in the supplemental data online for the base models and model 1s; and Tables A9–A12 online for the results on the relationship between betting shops and burglary, criminal damage, robbery, and vehicle crime). The base models included only random intercepts, while model 1s and 2s controlled for various other variables that might affect the relationship between the number of betting shops and crime types analysed here, drawing upon the existing literature. Using Akaike information criterion (AIC) criteria to compare the models (e.g., base model versus model 1, model 1 versus model 2; see the rows that are before the last rows in Tables A2–A8 in Appendix A online), subsequent models better fitted the data compared with the previous models (e.g., model 1 against the base model).
Table 4. Relationship between betting shops and the major crime categories (model 2 – Negative Binomial Model – NBM).
Table 5. Relationship between betting shops and the major crime categories (model 3 – Spatial Autoregression Model (SAR)).
According to the results from the negative binomial models (see model 2s in ), the relationship between the number of betting shops and all crime types analysed here are statistically significant at the 0.001 level and positive, even after controlling for different risk factors that might affect crime rates and considering the spatial autocorrelation of neighbouring LSOAs (see model 3s in ). That is, the reported coefficient estimates from model 2s demonstrate that areas with a greater number of betting shops experience more crime (all types of crime analysed here). If we take the exponent of the coefficients of the betting shop variable in model 2s (i.e., incidence rate ratio – IRR), we can also obtain a sense of the substantiveness of the effect of the number of betting shops on the crime types analysed here, individually. The number of all crime, bike theft, ASB, other theft, public disorder, shoplifting, and theft from other person is expected to increase by 4% (calculated as exp(0.044) = 1.04) (), 6%, 7%, 5%, 7%, 16% and 10% for a 1 SD (standard deviation) increase in the number of betting shops, respectively, after controlling for all other variables in the models. These show that the presence of betting shops has a greater impact on shoplifting and theft from other person compared with other crime types. (See and and Tables A2–A12 in Appendix A in the supplemental data online for the relationship between the number of betting shops and control variables.)
We also investigated LSOA (level 2) variances (see the last rows of and ) for the crime types analysed here. To confirm if these LSOA-level clustering matters, the variance partitioning coefficients (VPCs) were calculated, as shown in and . The VPC shows that approximately 70%, 46%, 42%, 64%, 13%, 69% and 42% of the variance in all crime, bicycle theft, ASB, other theft, public disorder, shoplifting, and theft from person, respectively, is accounted for by neighbourhood differences. Therefore, LSOA (level 2) differences have the highest impact on all crime, other theft, and shoplifting compared with the year differences (level 1). However, both level attributes have almost similar effects on bicycle theft, ASB and theft from person, and time differences (level 1) have the highest impact on public disorder.
The results from the spatial dependency (SAR) models (model 3) in show a positively significant spatial lag. As the coefficients of the spatial lags are significant across all the SAR models, they demonstrate the existence of significant spatial dependency in the dependent variables. The results therefore show that the level of crime in an area is dependent on the level of crime in neighbouring LSOAs. Taken into consideration the spatial dependency of neighbouring LSOAs, the higher the betting shop provision, the higher the likelihood of crime in a neighbourhood.
6. DISCUSSION AND CONCLUSIONS
This study explored the relationship between the number of betting shops and 10 different police recorded crime types. In response to the first research question, LISA and Getis–Ord Gi analysis identified significant clustering and co-location of licensed betting outlets and all crime. This finding is consistent with some previous international studies (Bottan et al., Citation2017; Kim et al., Citation2016; Lan et al., Citation2020) that found the introduction of gambling outlets correlated with increased crime rates in North America.
In response to the second research question, we conducted several negative binomial multilevel models to investigate the association between the number of betting shops and crime, while controlling for various theory informed predictors of crime. The study found that the presence of a betting shop increases the likelihood of all crime categories explored in this research. Even after controlling for neighbourhood characteristics, the association remains positive and significant. This further corroborates the results of the spatial analysis and confirms that betting shops in England and casino-type gambling provisions in the North American landscape have similar effects, although the dynamics of the relationships might be different.
In response to the third research question, this study examined the spatial relationship between a range of crime categories and betting shops. After controlling for neighbourhood characteristics, we found that the spatial correlations between betting shops and crime were highest for shoplifting, theft from other persons, public disorder and ASB. This may be expected given that these establishments are often located in local communities, and their opening hours tend to be daytime rather than evening. Relationships were less strong for burglary, and other more violent crimes such as robbery, often associated with violence and risky facilities in the night-time economy, especially those venues with larger capacities that hold several hundred people.
Furthermore, the VPC estimates derived from the cluster variance of the multilevel models show that LSOA characteristics play a vital role in the relationship between betting shops and most of the crime categories. Therefore, the inherent characteristics of neighbourhoods exert the most influence on the relationship between betting shops and crime. These findings support both the social disorganization and crime attractors and generators theories. For instance, spatial structures, such as betting shops, bus stops, and eat and drink places, were found to increase the likelihood of experiencing all categories of theft and other crime categorizations. These findings support the crime generators and attractors of crime pattern theory (Brantingham & Brantingham, Citation1995). In addition, ethnic heterogeneity, private renters, social renters, high education deprivation and urban area types, which were attributed to impact positively on the crime categories examined, are supported by the social disorganization theory (Sampson & Groves, Citation1989).
Previous studies indicate that betting shops (Adeniyi et al., Citation2020) and crime (Kawachi et al., Citation1999; Weisburd, Citation2015) are concentrated particularly in deprived areas. Since there are many correlates of crime at the neighbourhood level, this study tried to distinguish the effect of betting shops on crime by controlling for other factors that might affect crime. Accordingly, this study has made original contributions to the literature by addressing the paucity in the literature on the relationship between betting shop provisioning and crime across England at the national level. The study further contributes to the literature by focusing on different categories of police-recorded crime and betting shops (as against casinos) to provide a more nuanced understanding of the impact of betting shop provision on crime over two different time points.
Although statistically significant findings in relation to the role of betting shops on crime are evident, this study in no way suggests causality. For example, it is highly likely that the significant clustering of betting shops and crime might also have been affected by the presence of other crime generators or attractors that we have not considered in this study. Thus, the relationship between betting shops and crime is multifaced, as can be evidenced from this research. The issue could be that crime might be occurring within the premises of betting shops which makes betting shops serve as crime generators. On the other hand, they might serve as crime attractors as they might provide opportunities for offenders and victims to interact. Therefore, efforts need to be put in place to reduce the potentials of betting shops to serve as crime attractors and generators.
A range of policy implications can be derived from this study. Our findings suggest that all risk factors of crime converge in deprived areas, and thus create opportunities for more crime in those areas as the relevant theories suggest (Brantingham & Brantingham, Citation1995; Sampson & Groves, Citation1989). That is, areas with greater number of betting shops, bus stops, eat and drink places, ethnic diversity, deprivation in education, and a higher percentage of private and social renters experience more crime. Therefore, given recent austerity measures and reduced police funding (National Audit Office (NAO), Citation2018), resources should be channelled towards areas with the combinations of risk factors identified above.
According to Linning et al. (Citation2022), structural and concentrated disadvantages within neighbourhoods include population mobility, retail outlets, food outlets, indicators of poverty, private renters, social renters and betting shops as our research has uncovered. Interventions to reduce the impact of betting shops on crime should move from focusing on individuals and at-risk populations to trying to improve and foster strong informal controls in neighbourhoods. This could be achieved by focusing on how to improve or organize negative spatial structural conditions and concentrated disadvantages. Not only that, but interventions should also try to focus on local place managers who create spatial structures within neighbourhoods. Linning et al. have shown that estate agents, property owners and planning officials, for example, create spatial structures, thereby creating factors that provide opportunities for crime (e.g., crime attractors and generators).
Therefore, there should be a shift in intervention to begin to focus on place management strategies that focus on influencing the action of creators of spatial structures to invoke more responsible and inclusive creation process. For instance, local planning committees can take a public health approach by intervening along the gambling pathway especially with regulations at a local level. A saturation point/level can be introduced that makes it nearly impossible/difficult for a betting operator to open a new outlet in areas with already high provisioning or saturation.
7. LIMITATIONS AND RECOMMENDATION FOR FUTURE STUDIES
This study makes an original contribution to the literature by investigating the relationship between betting shops and crime across England. However, some limitations are worth noting. First, this study does not account for online or mobile gambling which is becoming a major concern for policymakers and public health practitioners. Most betting organizations continually seek to encourage participants to migrate online partly due to the less stringent online regulations. For instance, the £2 cap on fixed odds betting terminals introduced in the UK is not applicable to online gambling retailers. Future studies can investigate the impact of online or mobile gambling on crime.
Second, aggregating data to a spatial scale always introduces the generalization effect referred to as the modifiable area unit problem (Nelson & Brewer, Citation2017; Openshaw, Citation1984). This might influence the reliability of the results obtained from aggregated data such as the census, and crime and gambling datasets. As a result, this research adopted the lowest appropriate geography (LSOA) to reduce the effect of the modifiable area unit problem.
Third, although this study controlled for several theory informed predictors of crime, we acknowledge ‘the complexity of the natural and built environment, the political, economic, social and cultural contexts and structures of areas and the actions of individuals and corporate bodies within areas’ (Bottoms & Wiles, Citation1992, cited in Trickett et al., Citation1995, p. 274). That is, the models were limited to the variables included in them due to the lack of data. To overcome this shortcoming, future studies might consider using the Commercial Victimisation Survey which aims to estimate the level of crime against businesses.
Fourth, this study did not examine individual victimization risk and propensity to offend by ‘problematic’ gamblers seeking to fund their gambling behaviour. No publicly available UK dataset examines this, and it can be considered outside the scope of the study, which focused on risky facilities and risky places. However, future studies may consider the interaction effect between the risk factors afforded by problematic gamblers and the nature and characteristics of places where they are more likely to offend.
Fifth, PRCD also introduced some limitations. ‘Unlike the CSEW [Crime Survey for England and Wales], PRCD figures do not include crimes that have not been reported to the police or incidents that the police decide not to record’ (Flatley, Citation2014, p. 5). Further limitations of the PRCD are as follows: (1) ‘non-standardised recording practice across police forces and over time’; and (2) ‘changes in offence classification and legal definitions over time’ (Tseloni & Tilley, Citation2016, p. 4). However, the CSEW has limitations when conducting analysis at the LSOA level as the CSEW sample size is too small to be representative at the LSOA level (Tseloni & Tilley, Citation2016). This limitation of the CSEW provided strong justification to use the PRCD.
Finally, in relation to the data used, the census data, POI and area type used for this study are for a one year period (2011). This is because these datasets are not available. In addition, this study considered only two time points (2015 and 2019) due to the static nature of data collection on betting shops. Future studies might consider extending the timeframe adopted for this research. More importantly, future studies should further explore the findings of this study by conducting a comparative analysis looking at different cities across the UK to further understand the influence of local dynamics on the relationship between betting shops and crime.
Supplemental Material
Download PDF (226.3 KB)ACKNOWLEDGEMENTS
The authors thank the participants at the British Society of Criminology Conference, 2022; the Howard League Panel Reform Conference, 2022; and the anonymous reviewers for valuable comments that have significantly improved the quality of this paper.
DISCLOSURE STATEMENT
No potential conflict of interest was reported by the authors.
Correction Statement
This article was originally published with errors, which have now been corrected in the online version. Please see Correction (http://dx.doi.org/10.1080/00343404.2022.2159355.
Notes
1. See https://data.police.uk/data/.
2. See https://www.nomisweb.co.uk/.
3. There are 32,844 LSOAs in England; however, due to missing cases for the area type variable, the total number of LSOAs in the present analysis is 32,800.
REFERENCES
- Adeniyi, O., Brown, A., & Whysall, P. (2020). Retail location preferences: A comparative analysis. Journal of Retailing and Consumer Services, 55, 102146. https://doi.org/10.1016/j.jretconser.2020.102146
- Adolphe, A., Khatib, L., van Golde, C., Gainsbury, S. M., & Blaszczynski, A. (2019). Crime and gambling disorders: A systematic review. Journal of Gambling Studies, 35(2), 395–414. https://doi.org/10.1007/s10899-018-9794-7
- Albanese, J. S. (2019). Casino gambling impacts on crime and public safety: A review of 30 years of research. International Journal of Criminal Justice Sciences, 14(2), 320–338. 10.5281/zenodo.3723482
- Anselin, L. (1995). Local indicators of spatial association – LISA. Geographical Analysis, 27(2), 93–115. https://doi.org/10.1111/j.1538-4632.1995.tb00338.x
- Anselin, L., & Sergio, J. R. (2014). Modern spatial econometrics in practice, a guide to geoda, geodaspace and pysal. GeoDa Press.
- Arthur, J. N., Williams, R. J., & Belanger, Y. D. (2014). The relationship between legal gambling and crime in Alberta. Canadian Journal of Criminology and Criminal Justice, 56(1), 49–84. https://doi.org/10.3138/cjccj.2012.E51
- Banks, J., & Waugh, D. (2019). A taxonomy of gambling-related crime. International Gambling Studies, 19(2), 339–357. https://doi.org/10.1080/14459795.2018.1554084
- Barthe, E., & Stitt, B. G. (2009). Impact of casinos on criminogenic patterns. Police Practice and Research: An International Journal, 10(3), 255–269. https://doi.org/10.1080/15614260802381067
- Bernasco, W., & Block, R. (2011). Robberies in Chicago: A block-level analysis of the influence of crime generators, crime attractors, and offender anchor points. Journal of Research in Crime and Delinquency, 48(1), 33–57. https://doi.org/10.1177/0022427810384135
- Binde, P. (2016). Gambling-related embezzlement in the workplace: A qualitative study. International Gambling Studies, 16(3), 391–407. https://doi.org/10.1080/14459795.2016.1214165
- Bottan, N. L., Ham, A., & Sarmiento-Barbieri, I. (2017). Can’t stop the one-armed bandits: The effects of access to gambling on crime. SSRN 3020332.
- Bottoms, A. E., & Wiles, P. (1992). Explanations of crime and place. In Evans, D. J., Fyfe, N. R., & Herbert, D. T. *Eds.), Crime, policing and place: Essays in environmental criminology (pp. 11–35)., Routledge.
- Brantingham, P. L., & Brantingham, P. J. (1995). Criminality of place. European Journal on Criminal Policy and Research, 3(3), 5–26. https://doi.org/10.1007/BF02242925
- Bursik Jr, R. J., & Grasmick, H. G. (1999). Neighborhoods and crime. Lexington Books.
- Cameron, A. C., & Trivedi, P. K. (1998). Regression analysis of count data. Cambridge University Press.
- Carpio-Pinedo, J., Romanillos, G., Aparicio, D., Martín-Caro, M. S. H., García-Palomares, J. C., & Gutiérrez, J. (2022). Towards a new urban geography of expenditure: Using bank card transactions data to analyze multi-sector spatiotemporal distributions. Cities, 131, 103894. https://doi.org/10.1016/j.cities.2022.103894
- Cassidy, R. (2014). ‘A place for men to come and do their thing’: Constructing masculinities in betting shops in London. The British Journal of Sociology, 65(1), 170–191. https://doi.org/10.1111/1468-4446.12044
- Cohen, L. E., & Felson, M. (1979). Social change and crime rate trends: A routine activity approach. American Sociological Review, 44(4), 588–608. https://doi.org/10.2307/2094589
- Cravo, T. A., Becker, B., & Gourlay, A. (2015). Regional growth and SMEs in Brazil: A spatial panel approach. Regional Studies, 49(12), 1995–2016. https://doi.org/10.1080/00343404.2014.890704
- Eck, J. E., Clarke, R. V., & Guerette, R. T. (2007). Risky facilities: Crime concentration in homogeneous sets of establishments and facilities. Crime Prevention Studies, 21, 225–264.
- Eck, J. E., Lee, Y., & Martinez, N. (2017). Compared to what? Estimating the relative concentration of crime at places using systematic and other reviews. Crime Science, 6(1), 1–17. https://doi.org/10.1186/s40163-017-0070-4
- Flatley, J. (2014). British crime survey. In G. Bruinsma, & D. Weisburd (Eds.), Encyclopaedia of criminology and criminal justice (ECCJ) (pp. 194–203). Springer.
- Getis, A., & Ord, J. K. (1992). The analysis of spatial association by the use of distance statistics. Geographical Analysis, 24(2), 189–206. https://doi.org/10.1111/j.1538-4632.1992.tb00261.x
- Glaser, S. (2017). A review of spatial econometric models for count data (Hohenheim Discussion Papers in Business, Economics and Social Sciences No. 19-2017). https://ideas.repec.org/p/zbw/hohdps/192017.html
- Goudriaan, H., Wittebrood, K., & Nieuwbeerta, P. (2006). Neighbourhood characteristics and reporting crime: Effects of social cohesion, confidence in police effectiveness and socio-economic disadvantage 1. British Journal of Criminology, 46(4), 719–742. https://doi.org/10.1093/bjc/azi096
- Griffiths, M. D. (2011). Betting shops and crime: Is there a relationship? Internet Journal of Criminology. http://www.internetjournalofcriminology.com/Griffiths_Betting_Shops_and_Crime.pdf
- Groff, E. R., Taylor, R. B., Elesh, D. B., McGovern, J., & Johnson, L. (2014). Permeability across a metropolitan area: Conceptualizing and operationalizing a macrolevel crime pattern theory. Environment and Planning A, 46(1), 129–152. https://doi.org/10.1068/a45702
- Guliyev, H. (2020). Determining the spatial effects of COVID-19 using the spatial panel data model. Spatial Statistics, 38, 100443. https://doi.org/10.1016/j.spasta.2020.100443
- Hair, J. F., Black, W. C., Babin, B. J., & Anderson, R. E. (2018). Multivariate data analysis (Eighth edition). Cengage Learning.
- Hägerstrand, T. (1985). Time–geography: Focus on the corporeality of man, society, and environment. The science and praxis of complexity. The United Nations University.
- Hipp, J. R. (2016). General theory of spatial crime patterns. Criminology; An interdisciplinary Journal, 54(4), 653–679. https://doi.org/10.1111/1745-9125.12117
- Humphreys, B. R., & Soebbing, B. P. (2014). Access to legal gambling and the incidence of crime: Evidence from Alberta. Growth and Change, 45(1), 98–120. https://doi.org/10.1111/grow.12034
- Johnson, L. T., & Ratcliffe, J. H. (2017). A partial test of the impact of a casino on neighborhood crime. Security Journal, 30(2), 437–453. https://doi.org/10.1057/sj.2014.28
- Kahle, D. (2019). ggmap v3.0.0. https://www.rdocumentation.org/packages/ggmap/versions/3.0.0
- Kawachi, I., Kennedy, B. P., & Wilkinson, R. G. (1999). Crime: Social disorganization and relative deprivation. Social Science & Medicine, 48(6), 719–731. https://doi.org/10.1016/S0277-9536(98)00400-6
- Kim, M. K., Pang, A., Bao, W., & Bosworth, R. (2016). Endogeneity in casino revenue and crime rates: The case of Las Vegas, Nevada. Review of Regional Studies, 46(3), 223–236. https://doi.org/10.52324/001c.8032
- Kumar, P., & Yoshimoto, H. (2017). Do gambling firms target crime-prone areas? https://ssrn.com/abstract=2801017; http://doi.org/10.2139/ssrn.2801017
- Lan, M., Liu, L., & Eck, J. E. (2020). A spatial analytical approach to assess the impact of a casino on crime: An example of JACK casino in downtown Cincinnati. Cities, 103003. https://doi.org/10.1016/j.cities.2020.103003
- Laursen, B., Plauborg, R., Ekholm, O., Larsen, C. V. L., & Juel, K. (2016). Problem gambling associated with violent and criminal behaviour: A Danish population-based survey and register study. Journal of Gambling Studies, 32(1), 25–34. https://doi.org/10.1007/s10899-015-9536-z
- Linning, S. J., Olaghere, A., & Eck, J. E. (2022). Say NOPE to social disorganization criminology: The importance of creators in neighborhood social control. Crime Science, 11(1), 1–11. https://doi.org/10.1186/s40163-022-00167-y
- Loukaitou-Sideris, A. (1999). Hot spots of bus stop crime: The importance of environmental attributes. Journal of the American Planning Association, 65(4), 395–411. https://doi.org/10.1080/01944369908976070
- Martin, N. (2019). Fears high number of betting shops in Normanton could be causing poverty. https://www.derbytelegraph.co.uk/news/derby-news/fears-high-number-betting-shops-3266134
- Ministry of Housing, Communities and Local Government (MHCLG). (2012). National planning policy framework. https://www.gov.uk/government/uploads/system/uploads/attachment_data/file/6077/2116950.pdf
- Ministry of Housing, Communities and Local Government (MHCLG). (2019). The English indices of deprivation 2019 (IoD2019). https://assets.publishing.service.gov.uk/government/uploads/system/uploads/attachment_data/file/835115/IoD2019Statistical_Release.pdf
- National Audit Office (NAO). (2018). Financial sustainability of police forces in England and Wales 2018. https://www.nao.org.uk/wp-content/uploads/2018/09/Financial-sustainability-of-police-forces-in-England-and-Wales-2018.pdf
- Nelson, J. K., & Brewer, C. A. (2017). Evaluating data stability in aggregation structures across spatial scales: Revisiting the modifiable areal unit problem. Cartography and Geographic Information Science, 44(1), 35–50. https://doi.org/10.1080/15230406.2015.1093431
- Newham Council. (2016). Betting shops, crime and anti-social behaviour in Newham. https://www.newham.gov.uk/Pages/News/Betting-shops-crime.aspx
- Newton, A. (2018). Macro-level generators of crime, including parks, stadiums, and transit stations. In G. J. N. Bruinsma, & S. D. Johnson (Eds.), The Oxford handbook of environmental criminology (pp. 497–517). Oxford University Press.
- Newton, A., & Felson, M. (2015). Editorial: Crime patterns in time and space: The dynamics of crime opportunities in urban areas. Crime Science, 4(1), 1–5. https://doi.org/10.1186/2193-7680-3-1
- Newton, A., Felson, M., & Bannister, J. (2021). Introduction to the special issue: Urban mobility and crime patterns. European Journal on Criminal Policy and Research, 27(3), 307–311. https://doi.org/10.1007/s10610-021-09501-7
- Nichols, M. W., & Tosun, M. S. (2017). The impact of legalized casino gambling on crime. Regional Science and Urban Economics, 66, 1–15. https://doi.org/10.1016/j.regsciurbeco.2017.05.005
- Nilsson, H. (2022). Population decline and changes in food store access. Regional Studies, 1–15. https://doi.org/10.1080/00343404.2022.2108542
- Office for National Statistics (ONS). (2015). Lower layer super output area population estimates (supporting information). https://www.ons.gov.uk/peoplepopulationandcommunity/populationandmigration/populationestimates/datasets/lowersuperoutputareamidyearpopulationestimates
- Office for National Statistics (ONS). (2017). Rural urban classification (2011) of lower layer super output areas in England and Wales. https://geoportal.statistics.gov.uk/datasets/276d973d30134c339eaecfc3c49770b3_0/explore
- Office for National Statistics (ONS). (2019). Lower layer super output area population estimates (supporting information). https://www.ons.gov.uk/peoplepopulationandcommunity/populationandmigration/populationestimates/datasets/lowersuperoutputareamidyearpopulationestimates
- Openshaw, S. (1984). Ecological fallacies and the analysis of areal census data. Environment and Planning A, 16(1), 17–31. https://doi.org/10.1068/a160017
- Osgood, D. W. (2000). Poisson-based regression analysis of aggregate crime rates. Journal of Quantitative Criminology, 16(1), 21–43. https://doi.org/10.1023/A:1007521427059
- Portas, M. (2011). The Portas Review. An independent review into the future of our high streets. Department for Business, Innovation and Skills. https://assets.publishing.service.gov.uk/government/uploads/system/uploads/attachment_data/file/6292/2081646.pdf
- Rae, A. (2012). Spatially concentrated deprivation in England: An empirical assessment. Regional Studies, 46(9), 1183–1199. https://doi.org/10.1080/00343404.2011.565321
- Reece, W. S. (2010). Casinos, hotels, and crime. Contemporary Economic Policy, 28(2), 145–161. https://doi.org/10.1111/j.1465-7287.2009.00172.x
- Sampson, R. J., & Groves, W. B. (1989). Community structure and crime: Testing social-disorganization theory. American Journal of Sociology, 94(4), 774–802. https://doi.org/10.1086/229068
- Sampson, R. J., Raudenbush, S. W., & Earls, F. (1997). Neighborhoods and violent crime: A multilevel study of collective efficacy. Science, 277(5328), 918–924. https://doi.org/10.1126/science.277.5328.918
- Shaw, C., & McKay, H. (1942). Juvenile delinquency and urban areas: A study of delinquency in relation to differential characteristics of local communities in American cities. The University of Chicago Press.
- Sherman, L. W., Gartin, P. R., & Buerger, M. E. (1989). Hot spots of predatory crime: Routine activities and the criminology of place. Criminology; An interdisciplinary Journal, 27(1), 27–56. https://doi.org/10.1111/j.1745-9125.1989.tb00862.x
- Snijders, T. A. B., & Bosker, R. J. (1999). Multilevel analysis: An introduction to basic and advanced multilevel modelling (2nd ed). Sage.
- Snowden, A. J. (2019). Exploring violence: The role of neighborhood characteristics, alcohol outlets, and other micro-places. Social Science Research, 82, 181–194. https://doi.org/10.1016/j.ssresearch.2019.04.018
- Song, J., Spicer, V., Brantingham, P., & Frank, R. (2013). Crime ridges: Exploring the relationship between crime attractors and offender movement. European Intelligence and Security Informatics Conference, 75–82. https://doi.org/10.1109/EISIC.2013.18
- Trickett, A., Osborn, D. R., & Ellingworth, D. (1995). Property crime victimisation: The roles of individual and area influences. International Review of Victimology, 3(4), 273–295. https://doi.org/10.1177/026975809500300402
- Tseloni, A., & Tilley, N. (2016). Choosing and using statistical sources in criminology: What can the crime survey for England and Wales tell us? Legal Information Management, 16(2), 78–90. https://doi.org/10.1017/S1472669616000219
- Wardle, H., Keily, R., Astbury, G., & Reith, G. (2014). ‘Risky places?’: Mapping gambling machine density and socio-economic deprivation. Journal of Gambling Studies, 30(1), 201–212. https://doi.org/10.1007/s10899-012-9349-2
- Weisburd, D. (2015). The law of crime concentration and the criminology of place. Criminology; An interdisciplinary Journal, 53(2), 133–157. https://doi.org/10.1111/1745-9125.12070
- Wheeler, A. P. (2019). Quantifying the local and spatial effects of alcohol outlets on crime. Crime & Delinquency, 65(6), 845–871. https://doi.org/10.1177/0011128718806692