
ABSTRACT
The UK coal industry was an important part of the economy, but it experienced substantial job losses during the 1980s and 1990s. To alleviate the resulting socio-economic problems, many areas received regeneration funds. We examine to what extent relative unemployment and permanent sickness and disability in the coalfields of the East Midlands changed between 1971 and 2011. Over this period rates of permanent sickness and disability have increased, and the gap widened between coalfields and non-coalfields. In contrast, unemployment has decreased at a faster rate in the coalfields. However, both outcomes are better in those coalfields that were less dependent on mining.
1. INTRODUCTION
Coal mining was a key industry in many developed countries. In the UK, as elsewhere, whole communities in the ‘coalfields’ were built around coal mining and had a high dependency on the mines for employment, either directly or in sectors dependent on the mines (Bennett et al., Citation2000; Coalfield Regeneration Review Board, Citation2010). In 1947, the sector employed more than 700,000 people (Office of the Deputy Prime Minister (ODPM), Citation2004), and in 1981, more than 22% of male employment in the coalfields was in the energy sector, predominately mining (Beatty & Fothergill, Citation1996). Deindustrialisation during the 1980s and 1990s resulted in substantial job losses in the UK across mining, shipbuilding and manufacturing (Veira-Ramos & Schmelzer, Citation2021). Between 1985 and 1997, 150 collieries closed across the UK, with a loss of 250,000 jobs (ODPM, Citation2004), and in England, 170,000 men lost their jobs between 1984 and 1997, equating to 25% of total male employment in the coalfields (Department for Communities and Local Government, Citation2007).
Since the 1990s, studies exploring health and economic performance in the coalfields have reported worse health outcomes and greater unemployment levels (e.g., Riva et al., Citation2011; Shucksmith et al., Citation2010). These patterns vary geographically, but have proved persistent in many coalfield areas several decades after the closure of the mines (Beatty et al., Citation2019), despite a myriad of initiatives and funding aimed at regeneration (National Audit Office (NAO), Citation2009; North & Syrett, Citation2008). Previous studies have focused on relatively short-term analyses of the social, economic and health conditions in the former coalfields, and have not considered the relationship with regeneration programmes. Given the seemingly entrenched inequalities in the UK coalfields, which were home to 5.7 million people in 2017 (Beatty et al., Citation2019), a long-term analysis is needed, covering the period when the mines closed and subsequent regeneration. Some criticisms of previous regeneration schemes highlight the disconnect between regional-based strategies, for example, targeted at job creation, which often failed to prioritise deprived neighbourhoods, and neighbourhood-level initiatives (NAO, Citation2009; North & Syrett, Citation2008). Therefore, it is important that geographical variations are understood as the UK government focuses on ‘Levelling Up’, which includes further initiatives aimed at improving economic and social outcomes, and reducing these inequalities (HM Government, Citation2022).
2. AIMS OF THE STUDY
This paper provides a long-term analysis of if, and how, health and unemployment in the coalfields have changed since the coal mining industry was active in comparison with non-coalfield areas. It does this using the East Midlands as a case study, due to the variety of coalfields present in the region and extent of regeneration funding (see Case study section). It seeks to answer the following questions: To what extent has health and unemployment in the coalfields of the East Midlands changed between 1971 and 2011. To what extent is any change associated with regeneration funding provided through European Structural Funds? The novelty of this paper is that it covers the period of the widespread closure of the mines and subsequent regeneration programmes, using broadly consistent measures of unemployment and health normalised to the UK average to reduce the impact of national trends over this period. It also examines these outcomes at a smaller geography than previous studies (around 1500 people), providing a finer-grained analysis of spatial inequalities.
First, we consider the context of unemployment and health in the UK coalfields in relation to deindustrialisation and changes to the welfare system in the UK.
3. DEINDUSTRIALISATION, UNEMPLOYMENT, HEALTH AND THE WELFARE SYSTEM
In common with many countries, the UK has experienced deindustrialisation since the 1980s (Birch et al., Citation2010; Collins & McCartney, Citation2011). Employment levels across sectors including mining, manufacturing and shipbuilding have declined, whilst those in the service sector, which includes financial services, retail and hospitality, have increased (Office for National Statistics (ONS), Citation2019a). During the 1980s and 1990s, there were relatively high levels of unemployment due to mass job losses, particularly in coalfield and other industrialised areas, resulting in large numbers of working-age men becoming economically inactive (Beatty & Fothergill, Citation2005; Haynes et al., Citation1997; Webster, Citation2005). The high levels of joblessness, unskilled employment, deprivation and poor educational outcomes in these areas are also often associated with poor health outcomes (Haynes & Gale, Citation1999). There is evidence for a causal relationship between prolonged unemployment and poor health (Haynes et al., Citation1997) with permanent sickness rates in the UK having increased since the 1970s, and high unemployment being related to greater levels of self-reported sickness (Beatty & Fothergill, Citation2005; Boyle et al., Citation1999; Haynes et al., Citation1997; Webster, Citation2005).
However, this association has also been found to be an artefact of labour market conditions and the welfare system (Beatty et al., Citation2000; Webster, Citation2005). Substantial welfare reform since the 1980s sought to reduce unemployment via stricter rules for benefits and penalties for non-engagement with employment programmes (MacKay & Davies, Citation2008). This included increased sickness benefits relative to unemployment benefit via the Restart Programme in 1986 (Webster, Citation2005) and an overall shift from welfare to ‘workfare’ placing increasing obligations on the unemployed to engage with interventions to improve employability (Bambra & Smith, Citation2010), for example, via the introduction of Incapacity Benefit in 1995 (Beatty et al., Citation2000), New Deals in the early 2000s (Etherington & Ingold, Citation2012; Webster, Citation2005) and Employment Support Allowance in 2008 (Bambra & Smith, Citation2010) (). In these deindustrialised areas a lack of employment opportunities facilitated a shift towards economic inactivity through either sickness or early retirement and high levels of hidden unemployment (Beatty et al., Citation2000; Beatty & Fothergill, Citation2005; Haynes et al., Citation1997). This shift towards economic inactivity has helped to keep unemployment numbers lower than is the reality, explaining increasing sickness claimants across the UK (Beatty et al., Citation2007; Beatty & Fothergill, Citation2005). Those in areas with a shortage of appropriate jobs who are able to claim sickness benefits do so, and their lower employability, due to sickness, renders them less competitive (Beatty et al., Citation2000; Webster, Citation2005). In addition, shifts towards self-employment (Sutherland, Citation1999), part-time work and female participation in the workforce (Beatty, Citation2016) also appear to have contributed to the increased economic inactivity in the older male workforce nationally. As a result, between 1971 and 2001, the proportion of males aged 60–64 years in the workforce decreased by 39%, and the proportion of those registering as permanently sick doubled to 19.7% (Akinwale et al., Citation2011).
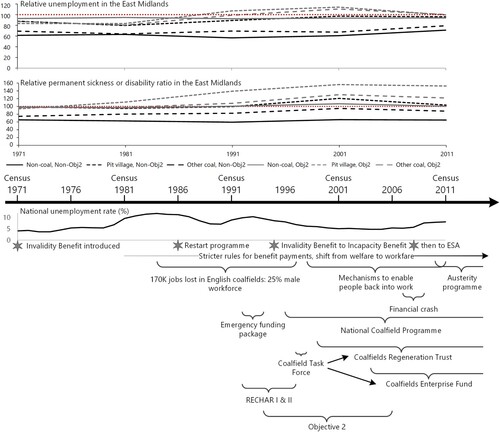
Figure 1. Summary timeline showing trends in relative unemployment and permanent sickness or disability ratios (PSDRs) in the East Midlands, non-coalfield, pit villages and other coalfields, with and without Objective 2 status, 1971–2011, in the context of national trends in unemployment, changes to the welfare system and regeneration in the coalfields.
The transition from welfare to workfare in the UK has focused on supply-side interventions aimed at improving the ‘employability’ of the unemployed, including via training programmes (Bambra & Smith, Citation2010; Etherington & Ingold, Citation2012; Webster, Citation2005). Initially these focused on younger people (e.g., New Deal initially focused on 18–25-year-olds), specific locations (e.g., Pathways to Work in deindustrialised areas) or groups (e.g., New Deal for Disabled People) (Bambra & Smith, Citation2010; Etherington & Ingold, Citation2012; Webster, Citation2005). These have, however, had little longer term impact: often the jobs provided were low quality, low pay and precarious, or there was insufficient priority given to factors such as the availability of childcare or demand-side interventions focused on job creation in deindustrialised areas (Bambra & Smith, Citation2010; Etherington & Ingold, Citation2012; Webster, Citation2005).
4. UNEMPLOYMENT AND HEALTH IN THE ENGLISH COALFIELDS
The trends in unemployment and health outlined above have also been observed in the UK coalfield communities. The UK coalfields are located in South and North East Wales, the Central Belt of Scotland, Nottinghamshire, Yorkshire, Derbyshire, Staffordshire, North West Leicestershire and North East England, with smaller areas in North West England, Kent and Warwickshire. Despite the economic prosperity linked to coal mining, in many of the coalfield areas there were substantial adverse health effects associated with mining. For example, rates of pneumoconiosis, chronic bronchitis and emphysema are greater in coal miners than other occupations (Coggon et al., Citation1995). Studies since the 1970s have reported greater mortality rates in the coalfields compared with the rest of the UK (e.g., Dearden et al., Citation2019; Norman & Bambra, Citation2007; Tudor Hart, Citation1971; Wiggins et al., Citation1998). For example, in 2008, standardised mortality ratios (SMRs) in the coalfields were greater and increases in life expectancy slower than those in the rest of England (Shucksmith et al., Citation2010). The coalfields also have greater levels of ill-health. In 1996, for example, 33,500 miners were in receipt of sickness benefits for conditions attributed to mining (Coalfield Task Force, Citation1998) and a study of limiting long-term illness (LLTI) from the Health Survey of England between 2004 and 2006 reported that those in coalfield local authorities were 27% more likely to report an LLTI compared with non-coalfield areas (Riva et al., Citation2011). However, the interaction between health and unemployment described above has also been reported in the coalfields. Studies examining the job losses between 1981 and 1991 found that the coalfields were characterised by high levels of out-migration and hidden unemployment as many ex-miners moved onto disability benefits keeping unemployment figures low (Beatty et al., Citation1997; Beatty & Fothergill, Citation1996).
Despite this, several studies that have examined health inequalities across the UK have also singled out the former mining areas as having noticeably worse health outcomes than the rest of the UK. Wiggins et al. (Citation1998) found that not only were LLTI levels in 1991 greater in coalfields, but also they were greater that would have been expected from sociodemographic predictors in the 1971 and 1981 Census Longitudinal Surveys. The local authorities with the highest incapacity benefits claimants in 2005 were those in coalfields, and these also had the worst health based on data from the 2001 Census (Norman & Bambra, Citation2007). Similarly, in their study of LLTI between 1991 and 2011 with the ONS Output Area Classification, Dearden et al. (Citation2019) demonstrated that areas of mining heritage and manufacturing have the highest levels of LLTI and that, with coastal heritage areas, they have the largest increases between 1991 and 2011, although along with the rest of the UK they declined in the latter half of this period.
5. REGENERATION AND RECOVERY IN THE COALFIELDS
Unemployment, health and deprivation are intertwined in the coalfields (Bennett et al., Citation2000; Riva et al., Citation2011). The loss of the industry that provided not only jobs but also social infrastructure and support was followed by the breakdown of families, social fragmentation, drug and alcohol dependency, and declining housing and the local environment, all of which are related to poor health (Bennett et al., Citation2000; Coalfield Task Force, Citation1998; Riva et al., Citation2011). As a result, the last 30 years have seen multiple initiatives to improve the economic conditions in coal mining and other post-industrial communities (). Numerous funding allocations since the 1980s have aimed to counteract the impact of the decline of the coal mining sector and other industries. Substantial investment was also secured from the European Commission, via the European Structural Funds, often match funded by the UK national and local government. The RECHAR programme (Reconversion de Bassins Charbonniers, literally: reconversion of coalfields) was targeted specifically at the coalfields (Ball, Citation1999; European Commission, Citation1992, Citation2011a). In addition, many coalfield areas also received funding due to their Objective 1 and 2 statuses, based on having gross domestic product of less than 75% of the European Commission, or being in an area with industrial decline and high levels of unemployment, respectively (Hough & Presland, Citation2000). These initiatives sought to reclaim land affected by coal mining, diversify industry in these areas, and tackle worklessness, low education and skills (Beynon et al., Citation1999). All coalfields also received funding, via Objectives 3 and 4, for skills and training (Coalfield Task Force, Citation1998).
The Conservative government in 1992 initiated a two-year emergency funding package to soften the impact of large-scale closures (Coalfield Task Force, Citation1998), and in 1996 it launched the National Coalfields Programme (NCP). This £365 million programme aimed to remediate 56 former collieries in England, and provide infrastructure associated with new employment by 2007 (Coalfield Regeneration Review Board, Citation2010). The Labour government set up a task force upon its election in 1997 (Bennett et al., Citation2000) which expanded the NCP to 86 collieries, extended the programme to 2012, created the Coalfields Regeneration Trust in 1999 and launched the Coalfields Enterprise Fund in 2004 (Coalfield Regeneration Review Board, Citation2010). At the same time the Labour government also initiated the £20 billion Spearhead Programme, which aimed to reduce inequalities in health and deprivation in England by 2010 (Barr et al., Citation2017; Shucksmith et al., Citation2010). This programme focused on the 20% of local authorities in England with the worst health and greatest levels of deprivation; of these 55 local authorities, 23 were coalfields (Shucksmith et al., Citation2010). Such interventions were parallel to the national changes to benefits described above.
It is challenging to provide a robust evaluation of the impact of the multiple sources of funding and initiatives that have taken place in the coalfields, especially as there may be an additive effect (Ball, Citation1999; NAO, Citation2009) between those targeted at increasing employment and those aimed at reducing health inequalities. Despite this, studies have demonstrated that economic recovery in the coalfields has been varied. Although there was some job replacement in the coalfields, this only amounted to around one in four of those lost during closures (Beatty & Fothergill, Citation1996). A study of labour markets in the coalfields between 1981 and 2004, which updated the previous study, found that coalfields were ‘about 60% along the way to full recovery’ (p. 1671) in terms of job creation (Beatty et al., Citation2007). They highlight the contribution made by wider national growth, but also the success of enterprise zones and the NCP (Beatty et al., Citation2007). However, they also point to large geographical variations; good transport infrastructure in South Yorkshire contributing to its success, the smaller coalfields of the Midlands and their connectivity to larger centres of employment as aiding their regeneration (Beatty et al., Citation2007). In addition, the Audit Commission reported in 2008 that economic growth in the coalfields had primarily been driven by the strength of the national economy over this period (NAO, Citation2009). The types of jobs created meant that the coalfields appear to have been extremely vulnerable to the global financial crash of 2007–08 (Coalfield Regeneration Review Board, Citation2010; Shucksmith et al., Citation2010), and a review in 2010 found that coalfields still had greater levels of deprivation and young people not in employment, education or training (NEET) and fewer employment opportunities (Coalfield Regeneration Review Board, Citation2010). Similarly, when employment and economic activity rates between 1994 and 2007 were ranked, 23 of the 55 coalfield local authorities got worse (Shucksmith et al., Citation2010). A more recent study has also reported that deprivation, job creation, employment levels, wages, educational attainment, benefit and tax credit claimants are all worse in the coalfields compared with England averages (Beatty et al., Citation2019).
The next section presents the data sources and methods of analysis used in this study. The results of this analysis are then discussed in the context of the existing literature and their limitations. Finally, the conclusion offers some of the implications of this research and areas for further study.
6. THE EAST MIDLANDS AS A CASE STUDY
The East Midlands region includes areas of the Nottinghamshire, Derbyshire and Leicestershire coalfields. In 2019, an estimated 4.8 million people lived in the East Midlands (ONS, Citation2019b), of which around 22% live in the coalfields, which include the towns and cities of Chesterfield, Mansfield, Nottingham, Ashby-de-la-Zouch, Coalville, Worksop and Bolsover, an increase of approximately 30% since 1971. This region was selected as a case study for three reasons. First, it includes a variety of coalfields: ‘younger coalfields’, where the majority of the job losses of the 1980s and 1990s were located as they had greater number of men employed in the mines and were the only type to report increased unemployment between 1981 and 1991 (Nottinghamshire); ‘older coalfields’, which experienced substantial job losses before the 1980s (Chesterfield, North East Derbyshire); and ‘small coalfields’, which adapted to the job losses the most effectively, attracting new jobs and seeing little out-migration of their workforce (Leicestershire, South Derbyshire) (Beatty et al., Citation1997).
Second, the East Midlands coalfields were also in receipt of substantial investment from the European Structural Funds for interventions such as environmental improvements, job creation, skills and training ( and ). Objective 2 areas in the East Midlands changed: between 1994 and 1999, they broadly consisted of coalfield areas and Nottingham () (European Commission, Citation2011b, Citation2011c), whereas in the 2000–06 period they also included Derby and Leicester, and some rural areas in and around the Peak District National Park in the north-west of the region (European Commission, Citation2011d). Areas of Lincolnshire also received Objective 2 funding in this later period (European Commission, Citation2011d); replacing the £97.5 million Objective 5b funding these areas received between 1994 and 1999, which also aimed to diversify the industry in these areas, provide skills, training and business development (European Commission, Citation2011e). The cities of Nottingham and Derby also received funding via the EU’s URBAN programme (European Commission, Citation2011f, Citation2011g). The East Midlands is the only region where there is a mix between those coalfields with Objective 2 funding (Nottingham and Derbyshire) and those without (North West Leicestershire). In other regions either almost all coalfields received Objective 1 or 2 funding (Yorkshire, North East, North West) or were relatively small (North West, West Midlands, South East) or did not receive this investment (South East).
Table 1. Summary of European Commission funding targeted at the East Midlands coalfields.
Finally, the East Midlands has good connections to road networks and larger settlements (Beynon et al., Citation1999; Beatty et al., Citation2007), with investment including the creation of enterprise zones, all of which has contributed better economic performance in the region compared with other coalfields (Beatty et al., Citation2007; Shucksmith et al., Citation2010), meaning that one would expect to see decreasing unemployment and improving health following this targeted investment.
7. DATA SOURCES AND ANALYSIS
To examine the extent to which unemployment and health in the coalfields of the East Midlands changed between 1971 and 2011, several datasets were combined.
7.1. Census data
The UK census is a cross-sectional survey carried out every 10 years on the entire population. For each census from 1971 to 2011, raw data were obtained in the original small area geographies to provide populations by sex and age group and economic activity and for household attributes. These variables were then converted from their original geography to the 2011 lower super output area (LSOA) geography (Norman, Citation2017).
Unemployment, and permanent sickness and disability (PSD), comparable over time, were extracted from the economic activity data from each census to provide measures of unemployment and ill-health. Percentage unemployment was calculated as the proportion of those who are over 16 years old and economically active, but who were unemployed. This measure tends to overestimate unemployment compared with the proportion of people claiming unemployment benefits as it records economic activity in the previous seven days, a shorter time period than needed to claim these benefits (Norman, Citation2010). Unemployment in the coalfields must be considered within the national context, which saw unemployment increase from around 4% in the early 1970s, before increasing to around 10–11% in the 1980s to mid-1990s, before falling to 5% in the early 2000s and increasing again to around 8% following the financial crash in 2007–08 () (ONS, Citation2022). Therefore, unemployment rates are expressed relative to the national level for each year (i.e., unemployment rates below 100 are less than the national average, whereas those over 100 are greater).
Ideally, a measure of LLTI would have been used to examine ill-health; however, such a measure is not available over a timespan covering the closure of the mines to the present day. Between 1971 and 2011, the census included a question on PSD linked to workforce economic inactivity. Although the wording varied slightly over time (see the supplemental data online), it is sufficiently consistent. Answers to this question are highly correlated with LLTI and incapacity benefit claimants (Norman & Bambra, Citation2007), which have been used in other studies that evaluate health in coalfield areas (Beatty et al., Citation2019; Riva et al., Citation2011), although claimant counts and PSD rates have been criticised as underestimating unemployment due to the hidden unemployment referred to above (Beatty & Fothergill, Citation1996). However, for both unemployment and ill-health the most consistent dataset available at a small enough geography to compare over this period between coalfields and non-coalfields is the census.
Age and sex-standardised permanent sickness or disability ratios (PSDRs) were calculated for each LSOA. As with unemployment, PSD rates must be seen within a national context of increasingly strict unemployment benefits, which pushed people towards economic inactivity via early retirement or permanent sickness. To overcome this the PSDRs are calculated with reference to national ‘expected’ PSD counts calculated using rates from the 1991 census (Naing, Citation2000; Office of Population Censuses and Surveys (OPCS), Citation1997) applied to age–sex populations in each LSOA for every census year. Compared with 1991, LSOAs with PSDRs above 100 have PSDRs worse than the national average, and below 100 have better PSDRs. Some outliers were removed where PSDRs were highly inflated due to small number ratio exaggerations. In total, up to 22 LSOAs were removed from each of the 1971–2001 datasets but none were removed from 2011.
Percentage changes in unemployment rates and PSDR from 1971 were then calculated for 1981, 1991, 2001 and 2011 so that any differences in changes between areas could be analysed. This allowed a comparison between groups (see below) that also considered change over time.
7.2. Spatial data
This study uses the definition of coalfield areas which is based on the proportion of males in a location employed in the coal industry in 1981 (Beatty & Fothergill, Citation1996). This definition distinguishes two types of coalfield areas: ‘pit villages’ and ‘other coalfields’, defined as LSOAs with more than 25%, and 10–25% male employment in the coal industry in 1981, respectively (Beatty & Fothergill, Citation1996). A geographical information system (GIS) shapefile of the pit villages and ‘other’ coalfields was constructed based on images available in Coalfield Task Force (Citation1998) and each LSOA was assigned a code based on whether it was a non-coalfield, pit village or ‘other’ coalfield’ (). To enable the interaction between coalfield and regeneration funding to be examined, a combined coalfield and regeneration variable was formed consisting of six groups ().
Figure 2. East Midlands, showing the location of counties, major towns and cities, coalfields and Objective 2 areas.
Sources: Office for National Statistics (ONS) (Citation2011a). Contains National Statistics data © Crown copyright and database right 2020; contains Ordnance Survey data © Crown copyright (and database right) 2020. Coalfields boundaries were constructed based on images in Coalfield Task Force (Citation1998).
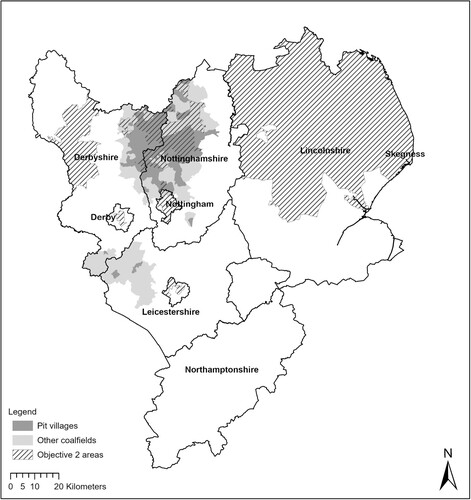
Table 2. Summary of lower super output areas (LSOAs) in the East Midlands by coalfield type and Objective 2 status.
Objective 2 funding was used as a proxy for regeneration funding. A shapefile of 2000–06 Objective 2 areas was used to determine which LSOAs were defined as Objective 2 areas (https://magic.defra.gov.uk/) (). A shapefile of the 1994–99 Objective 2 areas was not available. However, using later boundaries provides a good comparator between coalfield and non-coalfield areas in receipt of funding as the Objective 2 locations also include the areas in Lincolnshire that received Objective 5b funding between 1994 and 1999.
A complete dataset was created using the 2011 LSOA boundary data (ONS, Citation2011b) consisting of the unemployment rates and PSDRs for each census year as well as the spatial data.
7.3. Data analysis
The variables of interest were unemployment rate and PSDR in each census year plus percentage changes in unemployment rate and PSDR from 1971 in 1981, 1991, 2001 and 2011. The expectation is that following initial declines in employment levels and health during the closure of the mines, these outcomes should have improved in recent years, especially if the targeted locations have benefitted from the regeneration schemes.
The data did not meet the assumptions for parametric tests, so non-parametric tests were used using IBM SPSS Statistics 26, for this reason medians with interquartile ranges (IQRs) are presented in the results and discussion. Spearman’s rank correlations were used to test the associations between unemployment and PSDR. Independent samples Kruskal–Wallis tests with a Bonferroni correction (Field, Citation2003) were used to test differences in the change in unemployment and PSDRs from 1971 to each census year between different coalfield types, and between the combined coalfield and regeneration categories.
The results and discussion of the data analysis are presented in several sections. The first examines the correlations between unemployment and PSDRs between 1971 and 2011. This is followed by a series of analyses examining the change in unemployment and PSDRs over this period, how the situation varies between non-coalfields and coalfields, and finally the interaction with regeneration funding. Finally, the limitations are discussed.
8. UNEMPLOYMENT AND PERMANENT SICKNESS IN THE EAST MIDLANDS
Relative unemployment in the East Midlands increased slightly between 1971 and 2011 (p < 0.001; U(d.f.) = 96.39(4)) (a). Nationally unemployment increased from 4.1% to 8.1% over the same period () (ONS, Citation2022). However, the East Midlands appears to have performed better than the country as a whole: in 1971 unemployment was around 30% less than the national average, but by 2011 it was around 25% lower. The greatest increase relative to national unemployment occurred between the 2001 and 2011 censuses, following the 2007–08 crash. PSDRs also increased from 1971 to 2001, before decreasing by 2011 (p < 0.001; U(d.f.) = 78.11(4)) (b). Several studies have reported that permanent sickness rates in the UK have increased since the 1970s (Akinwale et al., Citation2011; Haynes et al., Citation1997), linked to the shift towards economic inactivity due to increasingly restrictive unemployment benefits (Beatty et al., Citation2000; Webster, Citation2005) and the PSDRs for the East Midlands are comparable with those reported by Haynes et al. (Citation1997).
Unemployment rates and PSDRs in the East Midlands are positivity correlated (). As one might expect, the strongest relationships appear to be between the same variables measured in adjacent census years (i.e., unemployment in 1971 and unemployment in 1981), or between unemployment and PSDR in the same year. These relationship trends suggest a worsening unemployment/health situation and entrenched socio-demographic challenges, and that the relationship between unemployment and PSD are extremely persistent between 1971 and 2011, also a feature of the mining areas of Doncaster (D’Silva & Norman, Citation2015). Also interesting is that the strongest correlation was between unemployment and PSDR in 1971 (r = 0.824), decreasing in 1981 (r = 0.516), before increasing again from 1991, which may be due to the hidden unemployment in the coalfields as labour market conditions deteriorated in the 1980s and 1990s (Beatty et al., Citation2000; Beatty & Fothergill, Citation1996; Webster, Citation2005).
Table 3. Spearman’s rank correlation coefficients for the relationship between unemployment and permanent sickness or disability (PSD) for the East Midlands, 1971–2011 (n = 2727–2774), all significant to p < 0.001.
9. IMPACT OF COALFIELD STATUS ON UNEMPLOYMENT AND PERMANENT SICKNESS IN THE EAST MIDLANDS
As one might expect given the mine closures during the 1980s and 1990s, coalfield areas had greater levels of relative unemployment than non-coalfields (), with differences appearing to increase between 1971 and 2001, before reducing by 2011 (a). Pit villages had greater levels of unemployment than both non-coalfields and other coalfields, and other coalfields generally had greater unemployment than non-coalfields (a). However, in non-coalfields and other coalfields in the East Midlands unemployment was lower than the national rate in each census, which more than doubled between 1971 and 1991 (). In contrast, pit villages had unemployment rates approaching or above national levels from 1991. Therefore, it appears that the other coalfields fared better than the pit villages throughout this period. The difference in unemployment is likely to be in part due to the type of coalfield, with the other coalfields in the East Midlands tending to correspond to the ‘small coalfields’ in Leicestershire, which recovered many of the jobs lost following the closure of the mines (Beatty et al., Citation1997). Pit villages, however, exhibited greater unemployment across the years, and tend to correspond to the ‘younger coalfields’ of Nottinghamshire that experienced the bulk of the job losses (Beatty et al., Citation1997). For example, in Mansfield over 15,000 jobs were lost between 1984 and 1998 from a population of 160,000 (Beynon et al., Citation1999). Pit villages had a higher dependence on the mines for jobs than the other coalfields (Beatty et al., Citation1997; Beatty & Fothergill, Citation1996) and were more likely to be in areas in receipt of regeneration funding (). The proportion of economically active males declined by 25% in the pit villages between 1981 and 1991 compared with 12.8% in other coalfields (Beatty et al., Citation1997), they also had lower levels of educational attainment and car ownership (Coalfields Task Force, Citation1998), making it more challenging to access jobs.
Figure 3. Median and interquartile range of (a) relative unemployment; (b) percentage change in relative unemployment from 1971; (c) permanent sickness or disability ratio (PSDR); and (d) percentage change in PSDR from 1971 for the East Midlands, by lower super output area (LSOA) (n = 2776), 1971–2011.
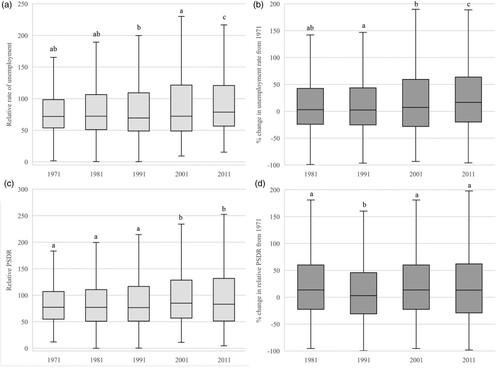
Table 4. Relationship between relative unemployment and permanent sickness or disability ratios (PSDRs) in non-coalfields, other coalfields and pit villages between 1971 and 2011 in the East Midlands (n = 2774).
The continued greater levels of unemployment from 2001 may hint at some of the criticism of the coalfield regeneration; that was dominated by multinationals, attracted by financial incentives and low wages with few ties to the areas, but vulnerable to the economic downturn in 2008–09 (Beatty et al., Citation2019; Beynon et al., Citation1999; Coalfield Regeneration Review Board, Citation2010). Despite this, inequalities in unemployment between coalfields and non-coalfields appear to have reduced between 2001 and 2011 (b), so that by 2011 the percentage increase from 1971 is not significantly different. In fact, the non-coalfield areas saw a greater increase in unemployment from 1971 to 2011 compared with coalfields, with pockets of high unemployment on the Lincolnshire coast, Northamptonshire, and in the cities of Leicester and Derby (), as has been reported elsewhere (Beatty & Fothergill, Citation2004; Dearden et al., Citation2019). National ‘welfare to work’ programmes have been criticised for their focus on supply-side measures to improve employability, which resulted in limited long-term success in reducing unemployment (Etherington & Ingold, Citation2012; Webster, Citation2005). It may be that the regeneration funding provided in coalfields did at least provide some of the demand side, geographically based interventions needed to create jobs alongside these national measures, meaning these areas have proved more resilient than more rural locations.
Figure 4. Median and interquartile range of (a) relative unemployment; (b) percentage change in relative unemployment from 1971; (c) permanent sickness or disability ratio (PSDR); and (d) percentage change in PSDR from 1971 for the non-coalfields, other coalfields and pit villages in the East Midlands, by lower super output area (LSOA) (n = 2776), 1971–2011.
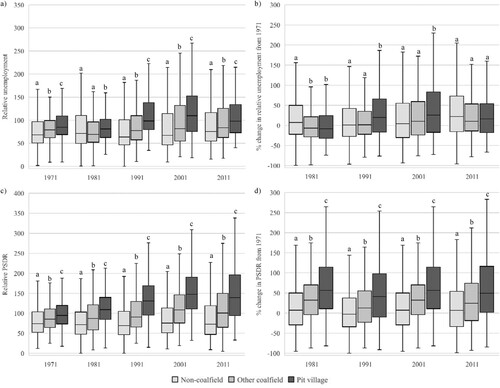
Relative PSDRs were also greater in coalfields compared with non-coalfields and above the national average in all years ( and c). In contrast to unemployment, inequalities between coalfields and non-coalfields, and pit villages and other coalfields increased over time (d). Between 1971 and 2011, PSDR increased by 49% in pit villages compared with 24% in other coalfields and 7% in non-coalfields. The result is that by 2011 non-coalfield areas had PSDRs 27% lower than the national average whereas in pit villages they were around 39% greater.
It is perhaps unsurprising that the rate of permanent sickness increased at a faster rate in the coalfields compared with the non-coalfields between 1971 and 1981 as coal mining was a dangerous profession and rates of occupational diseases, pneumoconiosis and bronchitis are greater in these populations (Coggon et al., Citation1995), as well as physical injury from accidents (Tudor Hart, Citation1971). Similarly, one might also expect inequalities to increase further in 1991 and 2001 compared with 1971 as men losing their jobs became economically inactive due to occupational illness coupled with the lack of employment opportunities and changes to the welfare system – the hidden unemployment discussed above (Akinwale et al., Citation2011; Beatty et al., Citation2000; Beatty et al., Citation2007). However, it is concerning that these inequalities have continued through to 2011; as ex-miners aged and shifted from the permanent sickness to retired categories in the census one might expect the permanent sickness rates would start to decline. The result is that PSDRs fell to below 1991 rates in non-coalfields but not in pit villages or other coalfields, meaning inequalities between coalfields and elsewhere increased, as also reported with LLTI in the Yorkshire–Derbyshire–Nottinghamshire coalfield (Dearden et al., Citation2019). Given the argument that hidden unemployment is prevalent in the coalfields (Beatty et al., Citation1997; Beatty & Fothergill, Citation1996), related to a progressively strict welfare system, the tendency for low-skilled job creation since the mines closed and the economic crash of 2007–08 it may be that these high levels of PSDRs in the coalfields are a function of the economic underperformance, especially in the pit villages where unemployment also remained greater than the national rate. In these areas, where unemployment is greater, the job market more competitive and a ‘spatial mismatch’ exists between the skills of the unemployed and the jobs available, hidden unemployable via sickness is likely to be greater (Beatty et al., Citation2000; Webster, Citation2005).
10. IMPACT OF REGENERATION FUNDING ON UNEMPLOYMENT AND PERMANENT SICKNESS IN THE EAST MIDLANDS COALFIELDS
Relative unemployment rates are also related to Objective 2 status across the East Midlands between 1971 and 2011 ( and , and ). Non-coalfields without regeneration funding had the lowest levels of unemployment in all years; around 35% lower than national averages (a). Before 2001 other coalfields without Objective 2 status had greater unemployment levels than non-coalfields, however by 2001 they were similar and were also lower than the national average. Objective 2 funding was allocated based on economic performance, including industrial decline and high unemployment, so one would expect areas with this funding to have the greatest levels of unemployment, and we see that for all years – areas with Objective 2 status have greater unemployment than their equivalents without funding (a). In contrast, pit villages without Objective 2 status had similar levels of unemployment to all Objective 2 areas, irrespective of their coalfield status. Unemployment in Objective 2 coalfields was greater than the national rate in 1991 and 2001 () corresponding with the census dates following the closure of the mines. The high levels of variability in unemployment across non-coalfield Objective 2 areas, is due to the areas along the Lincolnshire coast, such as Skegness. Coastal towns, including Skegness, have been reported to have higher levels of unemployment than the surrounding area primarily due to in-migration (Beatty & Fothergill, 2004).
Figure 5. Relative unemployment and permanent sickness or disabled ratio (PSDR) in the East Midlands in 2011, by lower super output area (LSOA), and percentage change in unemployment and PSDR from 1971.
Data sources: Norman (Citation2017); Office of Population Censuses and Surveys (Citation1997); Office for National Statistics (Citation2011b). This information is licensed under the terms of the Open Government Licence. Contains National Statistics data © Crown copyright and database right 2022. Contains OS data © Crown copyright [and database right] 2022.
![Figure 5. Relative unemployment and permanent sickness or disabled ratio (PSDR) in the East Midlands in 2011, by lower super output area (LSOA), and percentage change in unemployment and PSDR from 1971.Data sources: Norman (Citation2017); Office of Population Censuses and Surveys (Citation1997); Office for National Statistics (Citation2011b). This information is licensed under the terms of the Open Government Licence. Contains National Statistics data © Crown copyright and database right 2022. Contains OS data © Crown copyright [and database right] 2022.](/cms/asset/d81fda2c-e729-4079-af9b-e6453db0975f/cres_a_2191642_f0005_oc.jpg)
Figure 6. Median and interquartile range of (a) relative unemployment; (b) percentage change in relative unemployment from 1971; (c) permanent sickness or disability ratio (PSDR); and (d) percentage change in PSDR from 1971 for the non-coalfields, other coalfields and pit villages and whether they were in Objective 2 areas, in the East Midlands, by lower super output area (LSOA) (n = 2776), 1971–2011.
Sources: Norman (Citation2017); Office of Population Censuses and Surveys (OPCS) (Citation1997); Office for National Statistics (ONS) (Citation2011b).
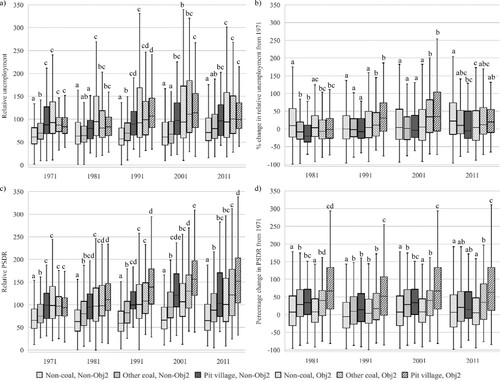
Table 5. Relationship between relative unemployment and permanent sickness or disability ratios (PSDRs) in non-coalfields, other coalfields and pit villages, with and without Objective 2 status, between 1971 and 2011 in the East Midlands (n = 2774; all p < 0.001).
In terms of percentage change since 1971, in the Objective 2 coalfields the greatest increases in unemployment happened between 1981 and 2001. After this, coinciding with significant job creation in the coalfields (NAO, Citation2009), unemployment dropped to levels similar to non-Objective 2 areas by 2011 ( and ) – unemployment in pit villages was lower than in 1971 (b). The greatest increase after 2001 is in non-coalfields without Objective 2 status, again this change is dominated by increased unemployment in coastal Lincolnshire as well as the rural areas of Lincolnshire and Northamptonshire.
Furthermore, although Objective 2 regeneration funding was allocated to specific areas, it is very likely that other areas would have benefitted from the initiatives particularly in terms of job creation, skills and training (Ball, Citation1999), and there were other sources of regeneration funding via the EU’s URBAN programme and the UK government. It is likely that these non-Objective 2 coalfield areas also benefitted from increased investment over this period which may explain their accelerated reductions in unemployment. For example, the Coalfields Regeneration focused their funding on the 30% most deprived coalfield wards (NAO, Citation2009), a larger spatial scale than the LSOAs used here. Again, these patterns are perhaps to be expected, given the job losses in the coalfields and the use of unemployment in designating Objective 2 areas, but this does begin to suggest that the fortunes of the pit villages and other coalfields are not uniform. One criticism of the regional development agencies and National Coalfield Programme, who often administered regeneration funding was that they did not prioritise the most deprived areas (North & Syrett, Citation2008; NAO, Citation2009), and this may also explain the variation across the coalfields.
Turning to PSDRs, the non-coalfields without Objective 2 status had the lowest PSDRs, followed by other coalfields without Objective 2, non-coalfields with Objective 2, pit villages without Objective 2, and then other coalfields and pit villages with Objective 2 funding (c). These differences became more pronounced over the years; whereas in 1971 and 1981 the median PSDRs were generally at or below national averages, perhaps as the coalfields had not yet suffered large scale jobs losses associated with coal mining. But by 1991 all pit villages, and all Objective 2 areas had median PSDRs above the national average. This census was the first after the reforms in 1986, which saw sickness benefits increase relative to unemployment benefit (Webster, Citation2005), alongside mine closures and high unemployment, meaning that those able to claim sickness benefit did so (Beatty et al., Citation2000). Whilst no areas returned to their 1971 PSDR by 2011 (), in the areas without Objective 2 status there was a decrease between 2001 and 2011 from 28% to 20% above 1971 levels in other coalfields and 33% to 14% in pit villages, whereas non-coalfields were similar at 7% above 1971 levels. In contrast, in Objective 2 areas, non-coalfields saw a slight decrease from 7% to 5%, but other coalfields and pit villages saw almost no change, decreasing from 39% to 34% and from 66% to 62% above 1971 levels, respectively.
The earlier comparison of only coalfield status revealed that coalfield areas had worse PSDRs than their non-coalfield equivalents. However, combining this with funding status suggests that there was variation in the coalfields. Those designated as Objective 2 areas, particularly the pit villages appeared to have the greatest levels of PSD and these inequalities increased over time. Objective 2 status was granted based on unemployment levels, so these areas are likely to have greater levels of hidden employment (Beatty et al., Citation2000), manifesting through high rates of PSD. However, the percentage change in PSDRs in the other coalfields is not significantly different from their non-Objective 2 or non-coalfield equivalents. This perhaps suggests that investment in other coalfields, which did not suffer such substantial job losses, were less dependent on mining, and in the case of Leicestershire, were better connected to wealthier towns and cities (Beatty et al., Citation1997) has contributed to slowing the increase in PSD.
It may be that the unemployment and permanent sickness outcomes are measuring two populations; the declining health of ex-miners who are still suffering from the economic decline of the industry, and a newer, younger population benefitting from the jobs that have been created (Beatty et al., Citation2007). Or it may be that there is a lag in job creation and improvements in PSD; with the latter taking longer to recover. Alternatively, unemployment has reduced as jobs are created, but many of these jobs are low skilled and precarious and therefore failed to reduce levels of hidden unemployment, particularly in the pit villages (Akinwale et al., Citation2011; Beatty et al., Citation2000; MacKay & Davies, Citation2008; North & Syrett, Citation2008).
11. LIMITATIONS
There are several limitations with the approach taken in this study. First, the census is only conducted every decade and 2011 was the most recent dataset available. This is likely to be important as since 2010 there have been substantial cuts to public services under the austerity programme of the Conservative–Liberal Democrat Coalition (2010–15) and Conservative government (2015–present) (Barr et al., Citation2017). The most recent assessment of the coalfields (Beatty et al., Citation2019) indeed suggests that the outcomes in the coalfields remain worse that the rest of England.
Second, the census only includes a question on LLTI from 1991 and the permanent sickness question used in this study only includes the economically inactive, so there are likely to be those living with long-term ill-health that remain in employment. One study reported that, based on the 1991 Census, there were around 45% of males and 30% of females reporting an LLTI who were also economically active (Haynes et al., Citation1997). In addition, as has already been discussed, the permanent sickness rate increases during periods of high unemployment so may not accurately reflect sickness rates (Haynes et al., Citation1997; Norman & Bambra, Citation2007). However, it is the relative differences that are of interest in this study as opposed to the absolute numbers of people reporting PSD, and there was a high correlation between the rate of PSD, LLTI and incapacity benefit claimants in 1991 (Norman & Bambra, Citation2007). In addition, the conversion of the rates of PSD into ratios relative to England ensures that changes in the LSOAs are reflective of more localised conditions during a period of high or low unemployment (e.g., in labour markets). Similarly, unemployment levels have also been normalised with reference to national levels, which mitigates some of the broader economic and welfare changes taking place over this period.
Third, the data used are aggregated to the LSOA level, as opposed to being individual-level data. This means that the ecological fallacy potentially applies to any relationships observed here since individuals reporting PSD or unemployment in the census may not be reflective of the average for the LSOA (Boyle et al., Citation1999) and socio-economic variables can vary substantially across an area (Fieldhouse & Tye, Citation1996). However, this variation reduces with smaller geographies, and impact of the ecological fallacy can be reduced through the use of small-area statistics (Fieldhouse & Tye, Citation1996), such as the LSOAs used here.
Finally, there are limitations related to the spatial datasets. The Objective 2 areas are for the 2000–06 period, although as already explained this allows a comparison with non-coalfields areas of Lincolnshire that received Objective 5b funding in 1994–96 and Objective 2 funding 2006–06. It is also not possible to assess the specific interventions that took place with this funding in each area, or the interactions with other funding mechanisms in place over this period.
12. CONCLUSIONS
This study examined to what extent unemployment and PSD in the coalfields of the East Midlands changed between 1971 and 2011. Using census data, it found that PSD increased substantially over this period despite unemployment levels returning to close to their 1971 levels.
It also found that trends contrasted in the coalfields. Whilst coalfield and non-coalfield areas both showed the same general pattern of reducing unemployment post-2001 and increasing PSDRs, the relative changes are quite different. The PSDRs indicated a widening gap between the coalfields and non-coalfields, while the gap in unemployment appears to have reduced by 2011. This study also found that coalfields with regeneration funding, using Objective 2 status as a proxy, did not appear to have lower PSDRs, and in fact the inequalities between these areas and areas without this funding increased, particularly in the pit villages. Unemployment levels, however, tell a different story, suggesting that the coalfields, irrespective of funding, experienced larger reductions in unemployment than non-coalfields, although the high PSDRs suggest that there may be substantial hidden unemployment in these areas. The worst performing areas were the pit villages; these appear to correspond with the ‘younger coalfields’ in Nottinghamshire that suffered the greatest job losses, whereas the ‘other coalfields’ in rural towns were less impacted by the job losses and better able to attract new employment. Overall, the findings suggest a mixture picture for the coalfields in the East Midlands, between PSD and unemployment, and also across different types of coalfields. The outputs of the 2021 Census provide an opportunity to examine this phase of the coalfields’ regeneration.
Supplemental Material
Download PDF (200.5 KB)ACKNOWLEDGEMENTS
The authors thank the two anonymous referees whose helpful comments enabled them to improve the paper.
DATA AVAILABILITY
This research uses census data from Casweb (1971, 1981, 1991, 2001) and NOMISWEB (2011), and geographical information system (GIS) boundary data from UKBORDERS (ONS, Citation2011a), which are all part of UK Data Service supported by Economic and Social Research Council (ESRC) and Jisc. Census data are provided by the Office of Population Censuses and Surveys (OPCS) (Citation1997); Objective 2 boundary data contains National Statistics and Ordnance Survey data. All information is licensed under the terms of the Open Government Licence (http://www.nationalarchives.gov.uk/doc/open-government-licence/version/2).
DISCLOSURE STATEMENT
No potential conflict of interest was reported by the authors.
REFERENCES
- Akinwale, B., Lynch, K., Wiggins, R., Harding, S., Bartley, M., & Blane, D. (2011). Work, permanent sickness and mortality risk: A prospective cohort study of England and Wales, 1971–2006. Journal of Epidemiology and Community Health, 65(9), 786–792. https://doi.org/10.1136/jech.2009.099325
- Ball, R. (1999). Delivering new potential for community economic development? European structural funds, RECHAR II and the West Midlands coal communities. Policy and Politics, 27(4), 515–532. https://doi.org/10.1332/030557399782218344
- Bambra, C., & Smith, K. E. (2010). No longer deserving? Sickness benefit reform and the politics of (ill) health. Critical Public Health, 20(1), 71–83. https://doi.org/10.1080/09581590902763265
- Barr, B., Higgerson, J., & Whitehead, M. (2017). Investigating the impact of the English health inequalities strategy: Time trend analysis. BMJ, 358, j3310. https://doi.org/10.1136/bmj.j3310
- Beatty, C. (2016). Two become one: The integration of male and female labour markets in the English and Welsh coalfields. Regional Studies, 50(5), 823–834. https://doi.org/10.1080/00343404.2014.943713
- Beatty, C., & Fothergill, S. (1996). Labour market adjustment in areas of chronic industrial decline: The case of the UK coalfields. Regional Studies, 30(7), 627–640. https://doi.org/10.1080/00343409612331349928
- Beatty, C., & Fothergill, S. (2004). ‘Economic change and the labour market in Britain’s Seaside Towns’. Regional Studies, 38(5), 459–478. https://doi.org/10.1080/0143116042000229258
- Beatty, C., & Fothergill, S. (2005). The diversion from ‘unemployment’ to ‘sickness’ across British regions and districts. Regional Studies, 39(7), 837–854. https://doi.org/10.1080/00343400500289804
- Beatty, C., Fothergill, S., & Gore, T. (2019). The State of the Coalfields 2019 economic and social conditions in the former coalfields of England, Scotland and Wales (Report). Coalfields Regeneration Trust.
- Beatty, C., Fothergill, S., & Lawless, P. (1997). Geographical variation in the labour-market adjustment process: The UK Coalfields 1981–91. Environment and Planning A: Economy and Space. SAGE Publications Ltd, 29(11), 2041–2060. https://doi.org/10.1068/a292041
- Beatty, C., Fothergill, S., & Macmillan, R. (2000). A theory of employment, unemployment and sickness. Regional Studies, 34(7), 617–630. https://doi.org/10.1080/00343400050178429
- Beatty, C., Fothergill, S., & Powell, R. (2007). Twenty years on: Has the economy of the UK coalfields recovered? Environment and Planning A: Economy and Space. SAGE Publications Ltd, 39(7), 1654–1675. https://doi.org/10.1068/a38216
- Bennett, K., Beynon, H., & Hudson, R. (2000). Dealing with the consequences of Coalfields regeneration. http://www.jrf.org.uk/bookshop/eBooks/JR070-coalfields-regeneration-decline.pdf
- Beynon, H., Hudson, R., & Strangleman, T. (1999). The coalfields research programme: Discussion Paper No. 4: Rebuilding the coalfields. https://huwbeynon.files.wordpress.com/2016/11/the-coalfields-discussion-paper-4-rebuilding-the-coalfields-1999.pdf
- Birch, K., MacKinnon, D., & Cumbers, A. (2010). Old industrial regions in Europe: A comparative assessment of economic performance. Regional Studies, 44(1), 35–53. https://doi.org/10.1080/00343400802195147
- Boyle, P. J., Gatrell, A. C., & Duke-Williams, O. (1999). The effect on morbidity of variability in deprivation and population stability in England and Wales: An investigation at small-area level. Social Science & Medicine. Pergamon, 49(6), 791–799. https://doi.org/10.1016/S0277-9536(99)00153-7
- Calcprofi. (2020). Exchange rate history euro to pound Sterling. https://www.calcprofi.com/exchange-rate-history-euro-to-pound-sterling.html
- Coalfield Regeneration Review Board. (2010). A review of coalfields regeneration.
- Coalfield Task Force. (1998). Making the difference: A new start for England’s coalfield communities. Coalfield Task Force.
- Coggon, D., Inskip, H., Winter, P., & Pannett, B. (1995). Contrasting geographical distribution of mortality from pneumoconiosis and chronic bronchitis and emphysema in British coal miners. Occupational and Environmental Medicine, 52(8), 554–555. https://doi.org/10.1136/oem.52.8.554
- Collins, C., & McCartney, G. (2011). The impact of neoliberal ‘political attack’ on health: The case of the ‘Scottish Effect’. International Journal of Health Services, 41(3), 501–523. https://doi.org/10.2190/HS.41.3.f
- Dearden, E. K., Lloyd, C. D., & Catney, G. (2019). A spatial analysis of health status in Britain, 1991–2011. Social Science and Medicine, 220, 340–352. https://doi.org/10.1016/j.socscimed.2018.11.014
- Department for Communities and Local Government. (2007). Regenerating the English Coalfields – Interim evaluation of the coalfield regeneration programmes. https://cis.ihs.com/cis/document/281897
- D’Silva, S., & Norman, P. (2015). Impacts of mine closure in Doncaster: An index of social stress. Radical Statistics, 112, 23–33.
- Etherington, D., & Ingold, J. (2012). Welfare to work and the inclusive labour market: A comparative study of activation policies for disability and long-term sickness benefit claimants in the UK and Denmark. Journal of European Social Policy, 22(1), 30–44. https://doi.org/10.1177/0958928711425265
- European Commission. (1992). Pounds 124 million package of European funds for British coal mining areas (RECHAR initiative). https://ec.europa.eu/commission/presscorner/detail/en/IP_92_128
- European Commission. (2011a). East Midlands RECHAR 11. https://ec.europa.eu/regional_policy/archive/reg_prog/po/prog_203.htm
- European Commission. (2011b). East Midlands Objective 2 1994–1996. https://ec.europa.eu/regional_policy/archive/reg_prog/po/prog_148.htm
- European Commission. (2011c). East Midlands Objective 2 1997–1999. https://ec.europa.eu/regional_policy/archive/reg_prog/po/prog_625.htm
- European Commission. (2011d). East Midlands Objective 2 2000–2006. https://ec.europa.eu/regional_policy/archive/country/prordn/details.cfm?gv_PAY=UK&gv_reg=ALL&gv_PGM=137&LAN=7&gv_PER=1&gv_defL=7
- European Commission. (2011e). East Midlands Objective 5b. https://ec.europa.eu/regional_policy/archive/reg_prog/po/prog_306.htm
- European Commission. (2011f). URBAN. https://ec.europa.eu/regional_policy/archive/reg_prog/po/prog_499.htm.
- European Commission. (2011g). URBAN II. https://ec.europa.eu/regional_policy/archive/country/prordn/details.cfm?gv_PAY=UK&gv_reg=ALL&gv_PGM=372&LAN=7&gv_PER=1&gv_defL=7
- Field, A. (2003). Discovering statistics using SPSS (2nd Ed.). Sage.
- Fieldhouse, E., & Tye, R. (1996). Deprived people or deprived places? Exploring the ecological fallacy in studies of deprivation with the samples of anonymised records. Environment and Planning A: Economy and Space, 28(2), 237–259. https://doi.org/10.1068/a280237
- Haynes, R., Bentham, G., Lovett, A., & Eimermann, J. (1997). Effect of labour market conditions on reporting of limiting long term illness and permanent sickness in England and Wales. Journal of Epidemiology and Community Health, 51(3), 283–288. https://doi.org/10.1136/jech.51.3.283
- Haynes, R., & Gale, S. (1999). Mortality, long-term illness and deprivation in rural and metropolitan wards of England and Wales. Health & Place, 5(4), 301–312. https://doi.org/10.1016/S1353-8292(99)00020-9
- HM Government. (2022). Levelling up the United Kingdom. https://assets.publishing.service.gov.uk/government/uploads/system/uploads/attachment_data/file/1052708/Levelling_up_the_UK_white_paper.pdf
- Hough, J., & Presland, A. (2000). European Structural Funds: Cataluña (Research Paper No. 00/72).
- MacKay, R. R., & Davies, L. (2008). Unemployment, permanent sickness, and nonwork in the United Kingdom. Environment and Planning A, 40(2), 464–481. https://doi.org/10.1068/a39155
- Naing, N. N. (2000). Easy way to learn standardization: Direct and indirect methods. Malaysian Journal of Medical Sciences, 7(1), 10–15. https://pubmed.ncbi.nlm.nih.gov/22844209
- National Audit Office (NAO). (2009). Regenerating the English coalfields. https://www.nao.org.uk/wp-content/uploads/2009/12/091084.pdf
- Norman, P. (2010). Identifying change over time in small area socio-economic deprivation. Applied Spatial Analysis and Policy 3, 107–138. https://doi.org/10.1007/s12061-009-9036-6
- Norman, P. (2017). Area characteristics: Great Britain 1971 to 2011. Mendeley Data. http://doi.org/10.17632/389scnndjy.1
- Norman, P. D., & Bambra, C. (2007). Incapacity or unemployment? The utility of an administrative data source as an updatable indicator of population health. Population, Space and Place, 13(5), 333–352. https://doi.org/10.1002/psp.458
- North, D., & Syrett, S. (2008). Making the links: Economic deprivation, neighbourhood renewal and scales of governance. Regional Studies, 42(1), 133–148. https://doi.org/10.1080/00343400601147273
- Office for National Statistics (ONS). (2011a). 2011 Census: Boundary data (England and Wales) [data collection]. UK Data Service. SN:5819 UKBORDERS: Digitised Boundary Data, 1840 and Postcode Directories, 1980 http://discover.ukdataservice.ac.uk/catalogue/?sn=5819&type=Data%20catalogue, http://census.ukdataservice.ac.uk/get-data/boundary-data.aspx. Contains public sector information licensed under the Open Government Licence v3.
- Office for National Statistics (ONS). (2011b). Census: Digitised boundary data (England and Wales) [computer file]. UK Data Service Census Support. https://borders.ukdataservice.ac.uk/. Licensed under the terms of the Open Government Licence. http://www.nationalarchives.gov.uk/doc/open-government-licence/version/3/
- Office for National Statistics (ONS). (2019a). Long-term trends in UK employment: 1861 to 2018. https://www.ons.gov.uk/economy/nationalaccounts/uksectoraccounts/compendium/economicreview/april2019/longtermtrendsinukemployment1861to2018
- Office for National Statistics (ONS). (2019b). Population estimates for the UK, England and Wales, Scotland and Northern Ireland, provisional: Mid-2019. https://www.ons.gov.uk/peoplepopulationandcommunity/populationandmigration/populationestimates/bulletins/annualmidyearpopulationestimates/mid2019
- Office for National Statistics (ONS). (2022). Unemployment rate (aged 16 and over, seasonally adjusted). https://www.ons.gov.uk/employmentandlabourmarket/peoplenotinwork/unemployment/timeseries/mgsx/lms
- Office of Population Censuses and Surveys (OPCS). (1997). 1991 Census aggregate data. UK Data Service (Edition: 1997). http://doi.org/10.5257/census/aggregate-1991-1. Licensed under the terms of the Open Government Licence. http://www.nationalarchives.gov.uk/doc/open-government-licence/version/2/.
- Office of the Deputy Prime Minister (ODPM). (2004). House of Commons ODPM: Housing, Planning, Regions Committee (March 2004).
- Riva, M., Terashima, M., Curtis, S., Shucksmith, J., & Carlebach, S. (2011). Coalfield health effects: Variation in health across former coalfield areas in England. Health and Place 17, 588–597. https://doi.org/10.1016/j.healthplace.2010.12.016
- Shucksmith, J., Carlebach, S., Riva, M., Curtis, S., Hunter, D., Blackman, T., & Hudson, R. (2010). Health inequalities in ex-coalfield industrial communities. Local Government Association.
- Sutherland, J. (1999). Further reflections on hidden unemployment: An examination of the off-flows from the claimant count in the North West of England. Regional Studies, 33(5), 465–476. https://doi.org/10.1080/00343409950081301
- Tudor Hart, J. (1971). The health of coal mining communities. Journal of the Royal College of General Practitioners, 21(110), 517–528.
- Veira-Ramos, A., & Schmelzer, P. (2021). Income growth in the United Kingdom during late career and after retirement: Growing inequalities after deindustrialisation, educational expansion and development of the knowledge-based economy. Ageing and Society 43, 1–28. https://doi.org/10.1017/S0144686X21000581
- Webster, D. (2005). Long-term unemployment, the invention of ‘hysteresis’ and the misdiagnosis of structural unemployment in the UK. Cambridge Journal of Economics, 29(6), 975–995. https://doi.org/10.1093/cje/bei082
- Wiggins, R. D., Bartley, M., Gleave, S., Joshi, H., Lynch, K., & Mitchell, R. (1998). Limiting long-term illness: A question of where you live or who you are? A multilevel analysis of the 1971–1991 ONS longitudinal study. Risk Decision and Policy, 3(3), 181–198. https://doi.org/10.1080/135753098348149