
ABSTRACT
This paper assesses the relationship between the urban labour market’s resilience and urban smartness for the European Union’s metropolitan areas in Central and Eastern Europe. The urban labour market’s resilience is evaluated by building an aggregate indicator using five variables that measure the specific characteristics of a labour market for post-transition economies, while 32 relevant characteristics of smart cities are used in assessing urban smartness for these economies. The results show that the characteristics considered to define a smart city are associated with resilient urban labour markets, particularly for metropolitan regions that surround capital cities.
1. INTRODUCTION
The concept of resilience is well-established, and is used to assess whether a system has the capacity to respond to a variety of challenges (Martin et al., Citation2016). The resilience of the labour market is an important dimension of this concept, and it refers to its capacity to overcome the perturbations imposed by internal and external shocks and to respond and adapt to them. For the post-transition countries that are members of the European Union (EU), labour markets have suffered, over the last 30 years, from the inherent structural changes brought by the transition to a market economy, with the ultimate goal of integration into the European Common Market (Babecky & Havranek, Citation2014). During the Communist period, the labour market was characterised by the full employment of the population, and excess demand for labour compared with supply (Čapkovičová, Citation2016). However, all these particularities have led to serious distortions of the labour market, manifested by low wages and productivity in all sectors of the economy (Cichocki et al., Citation2017). The post-Communist transition has led to significant reallocations of the workforce inside and outside of Central and Eastern European (CEE) states, generated by two competing phenomena: the closure of inefficient state-owned enterprises and the growing emergence of a more efficient private sector (Drahokoupil, Citation2009), simultaneously with a consistent migration process from East to West.
This paper assesses the relationship between urban labour market resilience and the level of urban smartness of metropolitan regions from post-transition countries in the EU. We use data for 32 EU metropolitan regions from CEE countries. The period analysed covers the major financial shock of 2008, when the effects manifested themselves in Europe, and the analysis is performed over two specific phases of resilience: resistance and recovery. For labour market resilience, a composite index is built. To assess the urban smartness level of a metropolitan area, six sub-indexes are built, one for each of the six dimensions that are widely used in the literature for measuring the smartness of a city.
When addressing urban resilience, recent approaches revolve around the idea that a city/metropolitan area, in order to be resilient, must have the ability to absorb shocks, adapt and transform. They must also, in the end, have the ability to improve urban performance in order to ensure urban safety for its citizens, linking the concepts of smart cities with that of urban resilience (de Falco et al., Citation2019; Ling, Citation2021; Zhu et al., Citation2019). Cities’ characteristics in terms of smart economy, mobility, environment, people, living and governance, as characteristics that describe the key features of a smart city (Organisation for Economic Co-operation and Development (OECD), Citation2020), can significantly influence the resilience of the urban labour market (Carmo & Ferreira, Citation2019; Erixon et al., Citation2013).
The changes generated by the economic transition in Eastern European cities have drawn attention to the negative effects of accelerated Communist urbanisation as well as urban depopulation, constructive chaos and inadequate financial resources for post-Communist development (Cevik & Correa-Caro, Citation2020). Accession to the EU has led to significant changes in CEE cities. The increased flow of capital, technology and information; trade; and human movement has led to an ‘EU-isation’ of CEE cities (Iwasaki & Tokunaga, Citation2016), even though the process has been different for Poland, the Czech Republic, Hungary and the Baltic States, compared with Bulgaria, Romania and Slovakia (Golubchikov, Citation2016).
The evolution of metropolitan systems is observed by focusing on the demographic and sectoral economic dynamics (Cardoso & Meijers, Citation2017), by dividing this process into four stages (Egedy et al., Citation2017; Feria et al., Citation2015). These include urbanisation – concentration of the population in urban areas; suburbanisation – the deconcentration of both population and economic activities from the central areas to peripheral urban areas; de-urbanisation – the deconcentration of the population from peripheral urban areas to surrounding smaller towns; and reurbanisation – the reconcentration of the population and economic activities in the inner cities. In CEE countries, the current trend is that of suburbanisation, which leads to a continuous process of urban areas’ expansion in terms of territory, economic activities and residency (Mikuła & Kaczmarek, Citation2017; Wiest, Citation2012). This uncoordinated dynamic generates certain non-uniformities in economic and residential characteristics of the metropolitan areas and incomplete developments of some residential areas in terms of capabilities. This has brought some additional difficulties affecting the standard of living and the professional careers of their habitants, given the former compact and centralised systems of the cities from post-transition economies (Sýkora & Ourednek, Citation2007). In the context of this remodelling process of the structure of the cities from the former Communist countries, with a variety of effects on the performance and the resilience of the urban areas, studying the behaviour in terms of urban labour market resilience of the metropolitan areas from CEE presents an interesting perspective.
The main novelty of our study is two-fold: first, the analysis of the urban labour market resilience uses a measure specific to post-transition economies; and second, the analysis of the relationship between labour market resilience uses the self-organizing map (SOM) algorithm. Although the analysis of the smart city phenomenon is comprehensive at the level of Western Europe and worldwide, at the level of CEE countries it is incomplete and lacking in detail. Also, existing studies do not present quantitative contributions on a multinational scale, but mainly consider isolated phenomena occurring at the national level. The limited availability of urban data at this level, since the CEE consists of different countries with different structures and institutions for defining and collecting data, may be a likely cause. The exploratory nature of the method used in the analysis is oriented more towards the discovery of relevant patterns than towards the confirmation of already existing hypotheses. The SOM algorithm is designed to compress high-dimensional data in a way that preserves all meaningful information. There are two highly relevant advantages of this approach: first, they are designed specifically for multidimensional data sets, making use of its inherent complexity; and second, unlike other data-reduction and clustering methods, this family of algorithms is characterised by a learning process that is constantly updated as it takes in more information from the input data, steadily improving the result dynamically during the training phase and consequently producing more reliable results. Such properties make SOM a very suitable technique for the needs of such studies in the social sciences, an area in which it has not been widely used (Kourtit et al., Citation2012).
The structure of the paper continues with the presentation of the relevant literature, followed by the methodology, the empirical results and the discussion. The conclusions comprise the final part.
2. CITIES’ SMARTNESS AND THEIR LABOUR MARKETS’ PERFORMANCE
The Great Recession of 2008–09 and the slow subsequent recovery from it have highlighted the importance of building resilient national, regional and local systems that can limit fluctuations in output and labour market outcomes, and also ensure a quick rebound. As a part of systemic resilience, labour market resilience refers to the ability of the labour market to resist economic shocks and to recover in the shortest possible time from them. The most widely used labour market outcome used to identify the stages of resilience is the employment rate. Since it is argued that the labour market suffers the most following a recession, with employment declining more than output, the dynamics of the employment rate are analysed for determining the resistance to and recovery from shocks (Di Caro, Citation2015; Fingleton et al., Citation2012).
After years of rapid growth, the post-transition economies from the EU were harder hit by the Great Recession than the Western economies. Over the past three decades, the transition countries from CEE have undergone significant structural changes that can be separated into two distinct processes. The first process involved changing the ownership of major employers, state-owned enterprises and private-sector development (Cichocki et al., Citation2017). This has been manifested in a sharp and major decline in employment in state-owned enterprises and slow growth in the private sector. The second process involved reallocations between sectors of the economy, carried out in both Western and Eastern countries due to technological changes and changes in the factors of production (Bah & Brada, Citation2014). Consequently, for the CEE countries, the labour market had a series of specific phenomena: the decrease of active participation rates; frequent withdrawal of women from the labour market; ‘open’ unemployment; increasing long-term permanent unemployment; increasing unemployment among young people, especially those who have dropped out of the education system; and regional disparities in the manifestation of unemployment.
Resilience capacity is built up, has cumulative effects over time and is constructed as an aggregation of drivers that prepare territorial units to face the upcoming shocks with reduced effects on society. Most drivers that presented as composing the resilience capacity are found to be factors that define a smart city. Smart city initiatives have proven to provide solutions to the resilience problem by addressing excessive urbanisation, which is one of the major factors that needs addressing for cities to be resilient. Following this idea, using urban smartness as an endorsement of the resilience capacity of a territorial unit, it can be assumed that urban smartness features can provide a basis to build resilient cities, and that the difference in resilience performance between cities can be explained by the difference in smartness (Banică et al., Citation2020; Oke et al., Citation2020).
Rapid technological progress and the challenges of urbanisation, energy and sustainability have led public authorities to turn their attention to a new concept: smart cities (Angelidou, Citation2017). This concept began to be applied after the 2000s, after being prompted by accelerated population growth, with important consequences for all human activities (technological innovation, transport, energy efficiency, business environment and employees). The characteristics of the smart city include the development and implementation of information and communication technologies to improve the quality of people’s lives and the environment (Cantafio & Ryan, Citation2020).
A widely recognised categorisation classifies the application fields of the smart city into six areas: smart economy, smart people, smart governance, smart mobility, smart environment and smart living (Giffinger & Gudrun, Citation2010). From the smart economy standpoint, the smart city is characterised by a high concentration of the innovative spirit, which implies policies to ensure and promote innovation and creativity in cities, with high expenditures for research and development (Caragliu & Del Bo, Citation2022). Intensive entrepreneurship, another characteristic of the smart city, covers elements such as the number of start-ups and high rates of self-employment, generating the development of new business models that lead to increased productivity and competitiveness of the economy. The labour market in the smart city is also influenced by foreign direct investment and information, communication and transportation (IC&T) technologies, leading to economic development by positively influencing productivity and gross domestic product (GDP) per employed person (Mikuła, Citation2022). With higher investment in technology and an increased entrepreneurial spirit, it is expected that unemployment rates, one of the most important indicators of economic activity and labour market performance, will be lower compared with a conventional city’s economic activity. These are clear indicators of the attractiveness and competitiveness of smart cities, elements that should be considered when evaluating labour market performance (Trippl et al., 2020). The smart city also implies the establishment of new development projects through the creation and availability of local employment opportunities, significantly improving the employment rate of the population. Social and human capital are valuable assets in the era of the knowledge economy, being made possible by the provision of green jobs, e-commerce and industry–academia–government collaboration, with all three adding enormously to the value creation aspect of smart cities, with a simultaneous boost for the labour market. Smart cities make extensive use of the available labour force and enjoy faster urban growth. They are also centres of higher education, creating a large demand for and supply of qualified people.
By offering improved operational efficiency and IC&T sharing, smart cities attract businesses because they create many indirect benefits. Large companies are usually present in smart cities, being grouped in the metropolitan area, and thus contribute to regional economic growth and employment. The main driving force of regional resilience is represented by private companies, and their role in economic development and resilience can be direct by offering employment opportunities and the creation of local products and services, or indirectly in the chain by promoting the local resilience of their own businesses. By integrating emerging technologies with traditional industries to transform methods of production, smart cities constantly improve the operating efficiency of traditional industries, which accelerates their transition to modern industries, and optimise, transform and update their industrial structure (Rigby et al., Citation2022).
The association between the smart city and the labour market can be considered either as a tangible or an intangible approach. If the tangible approach is mainly based on IC&T, clean energy and sustainability, the intangible one involves immaterial skills, knowledge, and social and human capital. Intangible skills are acquired through education and culture and include those that favour entrepreneurship and innovation. In the smart city environment, tangible resources are complemented by intangible skills. To transform cities into smart cities, it is necessary to increase intangible capital, rather than tangible physical capital. Based on these intangible competencies, smart cities stimulate the knowledge-based economy, at the expense of a labour-intensive economy (Reveiu et al., Citation2022).
The connection between the concepts of resilience and the smart city follows the direction of incorporating resilience in the set of measures that evaluate the smartness of a city (Albino et al., Citation2015; Guadagno, Citation2017; OECD, Citation2020). The transition of urban areas into a smart city approach is of recognised importance in resolving climate change issues and recharging declining economies. Smart city initiatives that help urban areas to attain this form of urban construction have cumulative effects over time on the development of cities (Kumar & Dahiya, Citation2017). Since the level of smartness of a city drives a certain level of development, it is fair to assume that this endorsement to labour market resilience can lead to similar performance of regions in different stages of resilience (Leick & Lang, Citation2018). Because smart city initiatives taken by a city usually target some dimensions more than others, an aggregated measure of urban smartness can lead to skewed results. Cities that appear to have similar levels of urban smartness can, in fact, be very different in their smartness profiles. For this reason, the disaggregated approach is considered when analysing the relationship between resilience and smartness.
The literature on the integrated approach on smartness and resilience is scarce. There are few conceptual studies that explore smart-city models and resilience features. Papa et al. (2015) start from smart and resilience characteristics and build a conceptual framework that integrates both; analysing European cities through this framework shows that few of them are both smart and resilient. The need for integrating the resilience in the smart city concept is also supported by Zhang and Li (Citation2018), who meta-analyse the two concepts. They find that, even in the early years, there was a substantial gap between the two; in the recent years they share common characteristics. Empirical studies on the cities of China (Zhu et al., Citation2019) emphasise the idea that urban resilience and smartness together lead to improvements in the quality of life, and it encloses the future in the development of cities.
While the idea that resilience can be achieved by making cities smart is widely accepted, urban smartness does not automatically make a city resilient. Rather, urban smartness is associated with resilience through the fact that it helps build the resilience capacity of a city/region. Since resilience capacity supports the ability of a city to be resilient in the sense of restoring functionality and further transforming the economic, political and social structures, the analysis of the association between urban resilience and smart-city features is inherent. The resilience of the labour market can be used as a proxy for evaluating the resilience of cities, given that welfare in particular and development in general are built on it, integrating both the economic and social dimensions of the society. Smart cities make wide-ranging use of smart technologies, creating new entrepreneurial opportunities and jobs. By providing better conditions for capitalising on labour mobility, smart cities attract highly educated talent and influence the immigration decisions of highly skilled workers. The increased connectivity in terms of public transportation makes it easier for citizens of smart cities to get jobs. In the event of an economic crisis, the smart city benefits from increased human capital, a key factor in urban development, which performs better than physical capital in terms of adaptability and resilience (Mieszkowski & Barbero, Citation2021). Even if there is substantial literature that analyses the connection between smart cities and resilience, promoting labour market resilience by developing smart cities is an unstudied area.
The resilience of the labour market is significantly different for different regions, and smart city characteristics are an important influencing factor. Therefore, following the idea of the conditional effect of urban smartness on achieving labour market resilience, the subsequent research hypothesis is developed: smart cities foster labour resilience in CEE countries.
3. DATA AND METHODOLOGY
The paper’s objective is to explore the relationship between the labour-market resilience and urban smartness for the metropolitan regions in the post-transition member countries of the EU, with a focus on testing the research hypothesis that smart cities are better for labour resilience.
The reasoning for using metropolitan areas, and not cities, comes from the specificity of the post-transition economies. In the Communist era, cities were agglomerated urban areas. The development brought by the end of this era led to a strong tendency to migrate to less dense semi-rural residential areas. The peri-urban enclosures became residential for city inhabitants, with significant impacts on the labour market and the transportation and utilities networks, since jobs for the residents of these areas were located in the city (de Falco et al., Citation2019). The sample of data consists of 32 EU metropolitan regions from CEE, specifically Bulgaria, the Czech Republic, Estonia, Latvia, Lithuania, Hungary, Romania, Slovenia and Slovakia. The Eurostat database is used to collect the data at the metropolitan, city and regional levels. The World Bank database is used to collect the national-level data.
Considering their overall performance for resilience and smartness, regions are clustered into homogenous groups. The association between resilience and smartness, and the clustering results from the resistance stage, are compared with the ones from the recovery stage. Since the criticism of using one aggregated index to measure smartness considers the fact that the concept of a smart city is too complex and dimension-heterogeneous from one city to another to be used as comprehensively in the form of an aggregated index (Nardo et al., Citation2019), a disaggregated approach with six sub-indexes, one for each smart dimension, is followed, followed by a robustness analysis that uses the aggregated form of smartness into one index and a mapping of the regions in order to better visualise their spatial distribution. Overall, the methodological steps are as follows.
3.1 Identifying the stages of labour market resilience and their corresponding time periods
First, an appropriate indicator, which is relevant for measuring urban labour market resilience, is chosen. The total employment rate, using city-level data from the Urban Audit Eurostat database, is used. This indicator is a meaningful measure of economic resilience in general and labour market resilience in particular, since it is less prone to revision than other resilience outcomes and is also regarded as a measure of well-being of an economy (Coyle, Citation2014; Sensier et al., Citation2016). The stages of resilience are further determined by using the EU average of the chosen indicator as a reference point and analysing its dynamics for the period 2006–20. Beyond the fact that the analysed countries belong to the European Single Market, the decision to use the dynamics of the EU average in identifying the stages of resilience is motivated by Martin et al. (Citation2016). They endorse the idea of using, as a point of reference, a ‘common (nation-wide) recession’, which for CEE countries can mean referencing to the EU’s reaction to the shock. Furthermore, following the authors’ arguments, by using this type of reference the analysis can be counterfactual. This is in the sense that it is expected, all things being equal, that the analysed areas would have the same reaction to the crisis, when contracting or expanding, as that of the EU. The stages of resilience are identified as follows: the resistance stage corresponds to the period from the peak of the Employment rate at the time of the crisis to the trough, and the recovery stage covers the period from the trough until the Employment rate reaches the peak before the shock.
3.2. Constructing a measure of labour market resilience for post-transition economies and measure of urban smartness, for each stage
Urban labour market resilience is measured by using a composite indicator. Urban smartness is measured by six sub-indexes, built for the six dimensions of smartness. For the urban labour market resilience index (ULMRI), five indicators for the labour market are used, which are specific to post-transition economies. The indicators used to build the index are presented in Table A1 in the supplemental data online. The process of transition to a market economy, for the former Communist countries, revolves around the performance of their labour markets. The excessive decrease in employment at the outset of the transition has been seen as potentially having the effect of delaying reforms (Boeri, Citation2000; Svejnar, Citation1999). For all age groups, the steepest fall is registered for the 15–24-year age group; the frequent withdrawal of women from the labour market resulted in a severe rise in unemployment for this category of the labour force; the rigidities of pre-transition labour markets that were eliminated in the course of transition led to an increased flexibility on the labour market. As a consequence, an increase in the net migration of the population, the cities losing qualified and sector-specific labour force; the existence of specific groups that combine several disadvantages, such as low skills, higher age, immobility, groups that faced a minimal chance of re-employment headed to a longer unemployment state; the slow privatisation of the large state enterprises, the lack of investments in technologies, the decrease in competitiveness led to a contraction of activities in the industry and manufacturing sector, and inherently, a decrease in employment (Bah & Brada, Citation2014; Nesporova, Citation2001).
To measure urban smartness, six smart dimensions that compose the overall concept are considered. Each dimension of urban smartness measures and reflects different aspects of urban life: industry (smart economy), education (smart people), e-governance (smart governance), logistics and infrastructure (smart mobility), efficiency and sustainability (smart environment) and security and quality (smart living). Essentially, smarter cities start from capital availability, especially human, social and entrepreneurial capital, rather than unconditionally assuming that IC&T can automatically create a smart city (Hollands, Citation2008; Kourtit et al., Citation2012). Six sub-indexes are built, one for each smart dimension, using a set of relevant indicators, presented in Table A2 in the supplemental data online.
In accordance with the methodology used in previous papers, the entire period for the analysis is subdivided in two parts: the resistance period and the recovery period. In each of these periods, the average values of the indicators are used as inputs (Giannakis & Bruggeman, Citation2017; Rizzi et al., Citation2017).
To measure urban smartness from the perspective of exploring the relationship with labour market resilience, an appropriate approach would be to analyse a longer period when building the sub-indexes for the smart dimensions, considering the cumulative long-term effects of smart city initiatives on the development of urban areas. The period that was considered for building the sub-indexes for the two phases of resilience starts from 2000 until the end of each resilience phase. The starting year is relevant in that since 2000, with the adoption of The Lisbon Strategy, the digitisation of the economy and society became the centre of Europe’s key strategies (Lisbon European Council, Citation2000), and most of the technologies available in the Western countries becoming accessible in the CEE countries as well.
In building all the composite indicators, the methodology of Nardo et al. (Citation2008) was applied, which uses principal components analysis to determine the variables’ weights. Prior to calculating the indexes, all the variables were normalised using the min–max method. When applying Principal Component Analysis, the number of selected components is determined so that the cumulative variance explained by these components is at minimum 80% of the total variation in the data.
3.3. Analysing resistance and recovery periods of labour market resilience and their relationship with smartness
A first goal is to visualise the grouping of the metropolitan regions considering their resilience of the urban labour market and their smartness and identify emerging patterns. The second goal is to identify and visualise clusters of metropolitan regions using the resilience index of the urban labour market, together with the urban smartness index. This analysis was performed in order to identify the profile of the metropolitan regions’ clusters on the perspective of their resilience versus the performance of those cluster regions from the point of view of the features of a smart city.
The clusterisation and visualisation tool used is the SOM method, which can serve the purpose of segregating the data that show similarities into homogenous groups (Kohonen, Citation1997; Kourtit et al., Citation2012). The SOM algorithm was developed by Kohonen (Citation1997) as a type of unsupervised neural network for data analysis; it is a neural network that uses self-organising processes. The SOM is a linear array of artificial neurons, with each neuron being represented and arranged in a two-dimensional network, with similar structures classified into the same neuron. The wide range of sensory inputs is thus ‘mapped’ onto a few structures, with the mapping process occurring automatically based only on the characteristics of the inputs. Therefore, a SOM is formed from a grid of nodes or clusters of units to which the input data are presented. Every node is connected to the input, and there is no connection between the nodes. SOM is a topology preserving technique and keeps the neighbourhood relations in its mapping presentation.
4. EMPIRICAL FINDINGS
The first step in exploring urban labour market resilience to the global financial crisis is to identify the stages of resilience that emerge after analysing the dynamics of a resilience outcome for the urban labour market; in this case, it is the total EU employment rate ().
Figure 1. Total European Union employment rate dynamics and demarcation of resilience stages: city-level data.
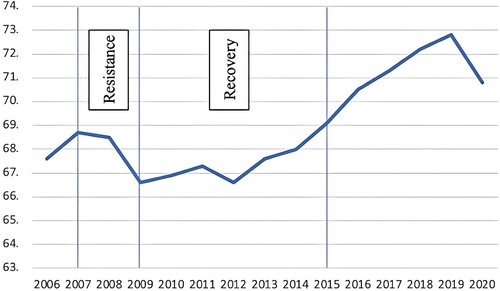
The analysis reveals two complete resilience phases: resistance (2007–09) and recovery (2009–15). The resistance stage of resilience corresponds to the period lapsed between the maximum employment pre-shock, reached in 2007, and the persistent fall until a minimum is reached, in 2009. From 2009, the employment begins a relatively steady increase. In 2015 it reached the level recorded in 2007, before the crisis, thus completing the recovery phase of the resilience.
To explore the relationship between urban smartness and urban labour market resilience in the resistance and recovery phases, two composite indexes are built for measuring urban labour market resilience, one for each stage of resilience. For measuring urban smartness, for each of the six dimensions of smartness two indexes are also built, one for the resistance period (2000–09) and one for the recovery period (2000–15). The reasoning for considering an extended period back to 2000 is that for cities, the degree of smartness is accumulative as it propagates and manifests over long periods of time.
4.1. Measuring urban labour market resilience for post-transition economies
One of the main endeavours of this paper is building an ULMRI for post-transition economies. The chosen variables to be aggregated for this index assess the vulnerabilities experienced by the labour markets of these specific economies, as presented in the previous section. Principal components analysis is employed to determine the weights for each variable, calculated based on the loading scores of each variable on the principal components. The variables and their weights are presented in Table A3 in the supplemental data online.
The calculated index values for each metropolitan region, for the two resilience stages, and the percentage change of the index value in the recovery stage compared with the resistance stage are represented in .
Figure 2. Urban labour market resilience index (ULMRI) for the resistance and recovery phases, and percentage change of the index in recovery versus resilience.
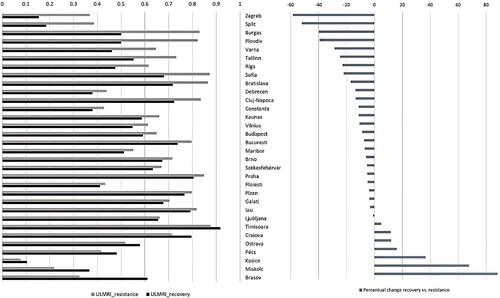
With very few exceptions – mainly the metropolitan regions with the lowest index values in the resistance phase – the value of the indicator for resilience of the labour market in the recovery stage is below the value in the resistance phase. The level registered in the recovery stage did not exceed the level in the resistance phase, suggesting that labour markets did not recover to the level registered before the shock. Most metropolitan regions register similar levels of performance for both stages of resilience. While for high and medium-high performances there is a dense cluster of metropolitan regions, only a few regions are located in the area with low performances in both stages; these are metropolitan areas that progressively eroded their capacities during the post-socialist deindustrialisation process. If Kosice has the lowest index value for both periods, Miskolc and Brasov exhibit contrary behaviour versus to Zagreb and Split; they have a considerably improved recovery, compared with the considerably worsened recovery observed in Zagreb and Split when facing their resistance levels.
4.2. Smart cities foster labour resilience in CEE countries
Regarding the implementation of smart cities, with a timid start and relative underdevelopment, CEE is still at the beginning of a long process. Introduced for the first time in CEE countries in the business environment, the smart city concept was later adopted by local public administration. However, at the CEE level, international reports show that cities are only at the first step of developing and implementing smart solutions, with major metropolitan areas being ranked below the EU average in terms of smart city development.
For the urban smartness indexes, for each of the six smart dimensions, a corresponding sub-index is built. The variables and their weights, as calculated using the loading scores of the variables from separate principal components analysis, are presented in Table A4 in the supplemental data online.
The research hypothesis is tested by profiling these metropolitan areas using labour market resilience information together with that regarding the smart dimensions, employing the SOM method to cluster the units into homogeneous groups. The analysis is performed for both stages of resilience, resistance and recovery. For each stage, the SOM method is applied using the ULMRI together with the disaggregated smartness index in the form of six subindexes of the urban smartness index, each measuring one of the six smart dimensions. The small number of metropolitan regions in the sample suggests using a 2 × 2 grid, creating four nodes or clusters.
4.2.1. Resistance stage
For the resistance period, the description of the nodes is presented in and the classification of the units into the four clusters is presented in .
Figure 3. Index values for the six smart components and the urban labour market resilience index (UMLRI), in the resistance period, for each of the four nodes.
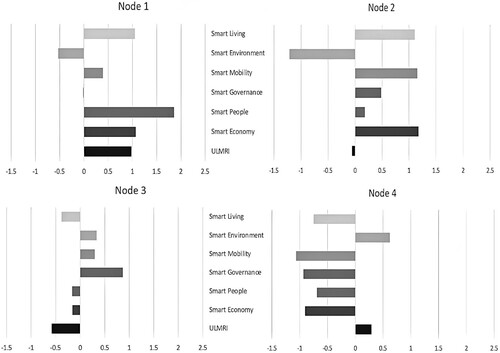
Table 1. Classification of the units into the four nodes, resistance period.
highlights the average scores for each smart dimension and the ULMRI.
For the resistance stage of resilience, the first two nodes are, overall, the best-performing. They, alternatively have the highest values for most smart dimensions, containing all the capital cities of the countries. In addition, they include the metropolitan region of Brno (Czechia), a large university and cultural centre. The first node, the best performing, distances from the second one by having significantly higher labour market resilience and people smartness, while the second node dominates by mobility smartness. The third and fourth clusters dominate the other clusters by governance and environmental smartness, respectively.
When analysing the relationship between labour market resilience and smartness, there are some observable particularities: resilience is highest for regions that perform on the economic, people, and living dimensions; resilience is medium for regions that perform best on the environment dimension; resilience is low for regions that perform on the economic, mobility and living dimensions; resilience is lowest for regions that perform on governance dimension. Overall, the dimension that singles out the cluster with high resilience is the smart people dimension.
4.2.2. Recovery stage
For the recovery period, the description of the nodes is presented in and the clusters’ composition in .
Figure 4. Index values for the six smart components and the urban labour market resilience index (UMLRI), in the recovery period, for each of the four nodes.
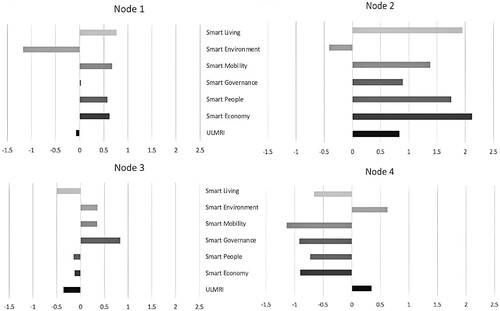
Table 2. Classification of the units into the four nodes, recovery period.
In the recovery period, the performing cluster is much more evident, having the highest values for all indicators, except one, with Prague, Bratislava and Ljubljana as the member regions, which are the ones with the best performance and the best support from smartness for labour market resilience. The next performing cluster, the first one, contains the rest of the capital cities plus Brno. The last two clusters, the third and the fourth, are the worst performing ones, in this order. The fourth, includes, just like in the resistance stage, all the regions from Romania and Bulgaria, except for the capital cities.
In terms of evaluating the relationship between labour market resilience and the smart dimensions, there are no observable differences between the two stages of resilience for the clusters with the medium and the lowest resilience level. There are, however, two notable differences for the clusters with the highest and with the low resilience. The cluster of regions with the highest resilience performs at maximum levels for all smart dimensions, except the environment. The cluster with a low resilience level, while having average values for the smart dimensions, no maximum levels are obtained, enlarging the gap versus the second cluster, compared with the situation from the resistance stage, where the two clusters were much more similar.
4.3. The spatial distribution of metropolitan regions
The spatial distribution of the metropolitan regions listed above, according to the clusters to which they belong, and the two resilience phases, are presented in and . For the purpose of comparability across phases, mapping of the metropolitan regions is made by first arranging the clusters using the same scale: from the best performing cluster (cluster 1) to the worst performing cluster (cluster 4).
Figure 5. Spatial distribution of the metropolitan regions in the resistance stage according to their cluster membership.
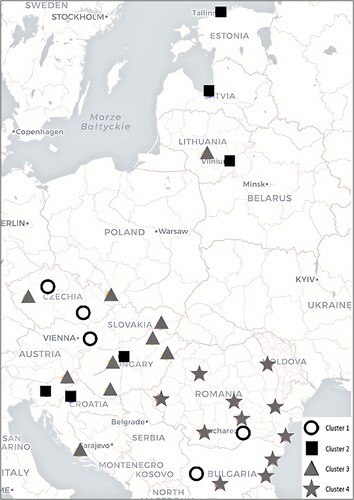
Figure 6. Spatial distribution of the metropolitan regions in the recovery stage according to their cluster membership.
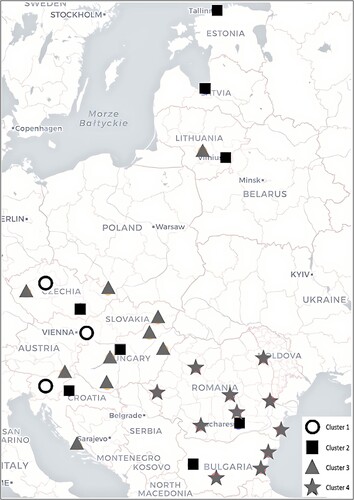
and highlight that certain models can be identified from a territorial perspective. There is not much difference between the resistance and recovery stages. Overall, CEE metropolises with higher labour resilience capacity assume a higher urban smartness (circle shape on the map), while the less resilient ones have implemented a limited number of smart projects (star shape on the map). The large number of cities from clusters 1 and 2 in our visual representation seems to support the general pattern. The first two categories include metropolises that registered an above-average resilience capacity and had quite good results in the implementation of smart projects, located in the western part of the CEE (North-West and West regions), near cities that have been both resilient and oriented towards smart city projects. This territorial pattern suggests that there could be spatial spillover effects in the implementation of smart city projects.
A well-defined classification results from the disaggregated approach. It has clusters of capital cities, separated by their development status; clusters of regions that are least economically developed; and clusters of regions that are at an average level of development. This brings empirical support for the fact that the relationship between the labour market resilience and urban smartness might be endorsed by the economic development of a metropolitan region, in the post-transition countries.
5. ROBUSTNESS AND DISCUSSION
The analysis using the six-subindexes for the smart dimensions gives insight into the four clusters’ profiles. The SOM method has the advantage of flexibility and its ability to approximate the probability density of input data, but it has a disadvantage that the number of nodes is user-defined. With too few nodes, the map fails to faithfully represent the full extent of the input data distribution, while maps with large numbers of nodes become susceptible to noise and overfitting. Thus, a robustness check is required. To this end, an aggregated index for the urban smartness is built, assigning equal weights to the six-subindexes that compose it. Using the two composite indexes, for the urban labour market resilience and for the urban smartness, the clustering method is applied also using four nodes, and for the two phases of resilience.
The visual representation of the metropolitan regions according to their labour market resilience and their urban smartness, for both resilience stages, is presented in and . The display of the regions will help assess the extent to which their measured labour market resilience associates with their urban smartness.
Figure 7. Resilience indexes for the urban labour market and the aggregated urban smartness of the metropolitan regions for the resistance timeframe.
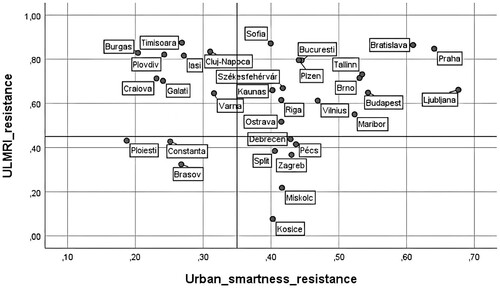
Figure 8. Resilience indexes for the urban labour market and the aggregated urban smartness of metropolitan regions for the recovery timeframe.
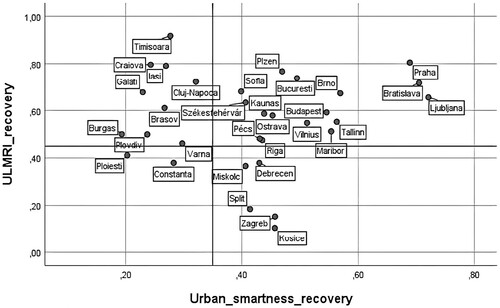
For each of the four quadrants there is a corresponding type of behaviour, defined by one of the four possible combinations of intensity (low/high) in the performance in labour market resilience and the degree of smartness. The first quadrant is where the most performing metropolitan regions are situated, with both high labour market resilience and high degree of smartness. In both stages of resilience, all the metropolitan regions of the capital cities for the countries included in the sample, except Zagreb, are in the first quadrant, highlighting the economic importance of the capital cities for the post-transition countries. Additionally, metropolitan regions from Czechia (Plzen, Brno, Ostrava), Slovenia (Maribor), Hungary (Székesfehérvár) and Lithuania (Kaunas) are found in this quadrant. These regions are regional capitals, great industrial and commercial centres, and/or university centres, so the association between high performance for labour market resilience and smartness is endorsed by a higher level of economic development.
The regions located in the second and fourth quadrants (mainly from Romania and Bulgaria), have high performances for one variable and low performances for the other. For them, their resilience, either low or high, is likely to be based on other determinants than their degree of smartness. For the regions in the second quadrant, there can be other factors that strengthen their labour market resilience (economic structure, high growth rates, etc.). Considering the low economic performance of these regions, there may be a certain rigidity of the labour market, which makes it more insensitive to possible shocks (in this case, a ‘bad resilience’ situation can be addressed). The regions in the third and fourth quadrants register low performances on labour market resilience and low or medium-low urban smartness. These characteristics are due to a lower level of economic development and poor economic structure in terms of industry-predominance or high dependency on a small number of industries.
The representation of the four nodes’ characteristics, for the two resilience phases are presented and , and the clusters’ compositions is presented in Tables A5 and A6 in the supplemental data online.
Figure 9. Index values for the six smart components and the urban labour market resilience index (UMLRI) in aggregate form, in the resistance period, for each of the four nodes.
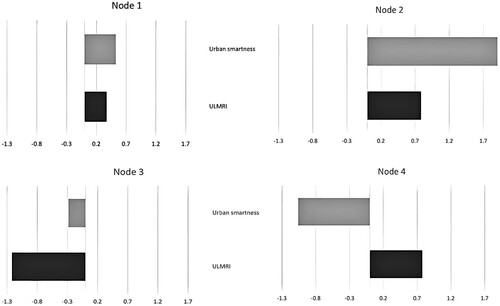
Figure 10. Index values for the six smart components and the urban labour market resilience index (UMLRI) in aggregate form, in the resistance period, for each of the four nodes.
For the resistance period, the second node is the best performing one. The metropolitan regions from this cluster have the highest values for resilience and smartness in the resistance period. The first node is also somewhat balanced, with positive averages for the two indicators, but it is significantly lower than the second node’s averages. The metropolitan regions belonging to these two clusters are those from the first quadrant from the visual representation. The SOM analysis refined the classification by separating the regions into homogenous groups (see Table A5 in the supplemental data online). The third and fourth nodes have the metropolitan regions with the lowest resilience and the lowest levels of smartness, respectively, with the third node containing the regions from the third and fourth quadrants, and the fourth node containing the regions in the second quadrant.
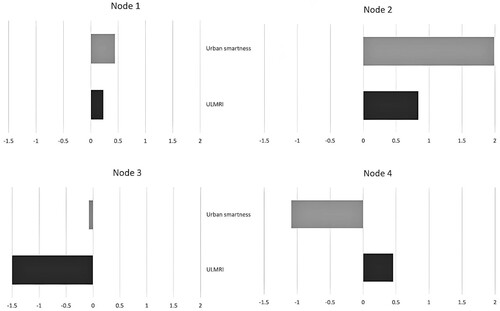
For the recovery period, the clusters’ characteristics resemble those from the resistance stage. The notable distinction is that, compared with the resistance stage, labour market resilience is lower in the recovery period, with the exception being the second cluster, which improved its resilience performance. When analysing the differences in smartness between the two stages, the situation is reversed – the clusters’ averages increased during the recovery period, with groups of regions improving their degrees of smartness. These findings are in accordance with the results from the visual representation. In terms of composition (see Table A6 in the supplemental data online), except for a few metropolitan regions that improved their labour market resilience and migrated in clusters with higher averages for this index, the rest of the regions remained in the same clusters formed in the resilience stage.
The spatial distribution of the metropolitan regions, according to the clusters to which they belong, for the two resilience phases, are presented in and . As previously, the mapping of the metropolitan regions is made also by arranging the clusters from the best performing cluster (cluster 1) to the worst performing cluster (cluster 4).
Figure 11. Spatial distribution of metropolitan regions in the resistance stage, according to their cluster membership, aggregated form.
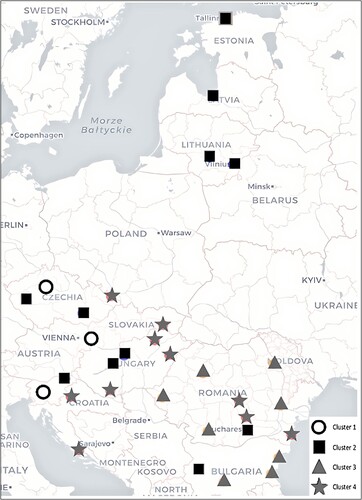
Figure 12. Spatial distribution of metropolitan regions in the recovery stage, according to their cluster membership, aggregated form.
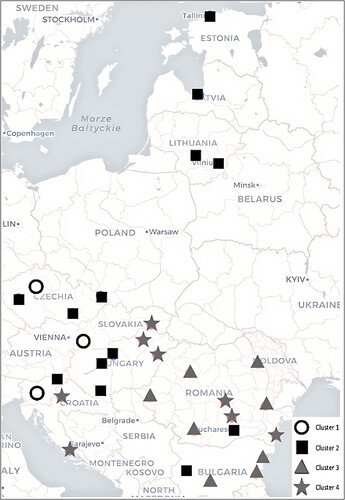
The same pattern emerges in the aggregated form as in the disaggregated form. There is very little variation of the clusters’ composition between phases, and the best performing clusters, 1 and 2, are mainly composed of metropolitan areas located in the western part of the CEE (North-West and West regions).
Overall, the results suggest some interesting aspects that have been also highlighted in the literature. First, the size of the city seems to play an important role in describing different behaviour during the economic crisis, since large cities are unevenly distributed among the four categories, and they are predominant in clusters 1 and 2. Second, metropolises located in poorer areas that are less economically integrated (in Bulgaria and Romania) were the most affected by the crisis, registering poor performance both in terms of resistance and recovery. Finally, the cases of Ostrava (Czechia); Zagreb and Split (Croatia); Miskolc, Pécs, and Debrecen (Hungary); Constanța, Brasov and Ploiesti (Romania); and Kosice (Slovakia) seem to confirm the existing theories in resilience that claim that endogenously developed economies are more resilient than others (Hudson, Citation2010). These metropolises are quite similar in rank and size, being located in the more developed western part of the CEE countries. This shows that the research hypothesis is partially confirmed, only for the metropolitan areas surrounding capital cities.
There are some observable changes for a small number of metropolitan regions, when crossing from the resistance stage into the recovery stage. Even if most regions remained in the same quadrant, their labour market resilience levels decreased in the recovery stage compared with the resistance. A possible explanation is the delay in the manifestation of the crisis effects, a situation specific to the less developed economies (Hendrikse & Sidaway, Citation2014). Also, in the recovery stage there is an increase in urban smartness levels, proving the cumulative effect of the orientation towards smartness. In the recovery stage of resilience, the three best performers from the sample, namely Prague, Bratislava and Ljubljana, are more grouped together and more distanced from the rest of the regions than in the resistance stage.
Regarding the labour market, behaviour was different for the resistance and resilience periods. During the period of resistance, for the metropolises analysed, there was a general decrease in the number of employees in industry, together with only a small increase in services. Instead, during the recovery period, especially after 2011, there was a revival of the low-tech industrial sector among the metropolises that did not massively implement innovative smart projects. For the service sector, the employment of the labour force assumed large fluctuations during the recovery period, especially for the metropolises that massively implemented smart projects.
The metropolises that massively implemented smart projects were also the most resistant cities during the crisis, undergoing profound transformations. The subsequent recovery from the crisis assumed the transition to another functional urban structure, not only to a more intelligent model. On the contrary, metropolises that did not implement smartness were stuck in a predetermined trajectory, without the chance (and/or resources) to innovate or take advantage of other opportunities. These kept their development pattern and were the least resistant. And for the recovery period, their behaviour was maintained, registering the poorest results. From a territorial perspective, the results show that cities tend to cluster based on their number of smart initiatives and their resilience performance index – cities that are both resilient and dynamic in implementing smart initiatives.
6. CONCLUSIONS
The study confirms that the economies of the CEE countries are quite heterogeneous as economic performance, including in terms of economic resilience in general and labour market resilience in particular. This is the case even though reforms and the process of transition to a market economy began around the same time, due to the strategies adopted and their efficiency, as well as several other specific factors. This study confirms our research hypothesis only partially, for the metropolitan areas surrounding capital cities and in a few other more developed urban centres. Differences are often found between metropolitan areas belonging to more economically developed countries and some countries such as Romania and Bulgaria, which performing worse economically and which have less sustainable economic structures.
The pronounced negative impact of the transition on certain sections of the population and economic sectors has, for these economies, reduced the ability to cope with a shock. This was the case with the global financial crisis of 2008–09, which justifies a specific approach to how to measure of the resilience of the labour market for this type of states.
The results obtained in measuring the resilience of the labour market for the analysed metropolitan areas highlighted the impact that several factors have on this performance, such as: the level of economic development, the structure of the economy, the characteristics of the business environment, the degree of market liberalisation, and labour productivity. From this point of view, ‘good’ resilience has been identified in the case of more developed economies or metropolitan areas, which justifies the ability of the labour market to cope with a shock or crisis. At the same time, ‘bad’ resilience in or less developed metropolitan areas, where the supposed performance in terms of resilience is due to a certain rigidity of the labour market, the existence of a more developed public sector, previous structural problems, and other factors.
The analysis of the results obtained in terms of labour market resilience shows insignificant differences between the performances of the metropolitan areas analysed in the recovery phase, compared with the resistance phase. From this perspective, the positioning of a metropolitan area in sections corresponding to low, medium, or high levels of resilience is much more informative, confirming the importance of capital city status or the belonging to a more developed economy.
The possible differences between resilience levels during the resistance period and the recovery period, respectively, are explained both by the differences in economic development, but also by a certain delay compared with the EU average or even to more developed economies in CEE. This delay has also had a positive effect on the results of these economies, which are less efficient and less connected to the global economy, in terms of resilience performance in the resistance phase.
The analysis of the way the resilience of the labour market and the level of smartness in the two analysed phases are associated shows that the metropolitan areas considered here exhibit approximately the same behaviour, explained by the socio-economic particularities of each of them. Thus, it is highlighted that the simultaneous existence of a high level of economic resilience and smartness is encountered in the case of capital cities and other highly developed metropolitan areas from an economic point of view, the effects of this factor being more evident in the recovery phase. Consequently, it can be appreciated that smartness can act as a catalyst for increasing the resilience of the labour market in the conditions of a developed economy, characterised by dynamism, a high level of labour productivity, competitiveness, and other factors. In terms of situations where high resilience is not associated with a high level of smartness, we are dealing with less economically developed metropolitan areas in states where the public sector is still very important, with a deficient and insufficiently consolidated economic structure to benefit from the advantages of new technologies, more rigid labour markets and negatively affected by the phenomenon of external migration, as well as other drivers.
The study shows that, although assessing the level of smartness by aggregating relevant indicators for the six dimensions proposed by the literature can be considered relevant for characterising regions and possibly conducting rankings or comparative analyses, it is less useful for mechanisms whereby a high level of smartness can favourably influence the resilience of the labour market. Thus, the separate analysis of the six dimensions considered for measuring the level of smartness highlighted the higher importance of aspects related to smart economy and smart people. These are associated with higher levels of resilience of the labour market, as opposed to aspects related to smart environment and smart governance, which is associated with lower performance in this regard.
Thus, it has become clear that any public policy proposals aimed at increasing the resilience capacity of cities in CEE should concentrate on, or at least include, an approach focusing on increasing the overall level of smartness on those sufficiently economically developed metropolitan areas. At the same time, for stimulating city resilience in less developed areas, the focus should be on targeting other specific mechanisms that are more efficient in building resilience capacity. Secondly, one should consider those dimensions that could play a greater role in increasing the performance of the labour market in terms of resilience, all the more so as it is always possible that an economic crisis or a potentially negative impact shock on the labour market can occur.
Supplemental Material
Download PDF (203.7 KB)DISCLOSURE STATEMENT
No potential conflict of interest was reported by the authors.
Additional information
Funding
REFERENCES
- Albino, V., Berardi, U., & Dangelico, R. M. (2015). Smart cities: Definitions, dimensions, performance, and initiatives. Journal of Urban Technology, 22(1), 3–21. https://doi.org/10.1080/10630732.2014.942092
- Angelidou, M. (2017). The role of smart city characteristics in the plans of fifteen cities. Journal of Urban Technology, 24(4), 3–28. https://doi.org/10.1080/10630732.2017.1348880
- Babecky, J., & Havranek, T. (2014). Structural reforms and growth in transition: A meta-analysis. Economics of Transition, 22(1), 13–42. https://doi.org/10.1111/ecot.12029
- Bah, E. H., & Brada, J. C. (2014). Labor markets in the transition economies: An overview. The European Journal of Comparative Economics, 11(1), 3.
- Banică, A., Eva, M., Corodescu-Rosca, E., Ibănescu, B. C., Opria, A. M., & Pascariu, G. C. (2020). Towards smart(er) resilient cities. Evidences from Romanian urban areas. Geografie, 125(4), 397–422. https://doi.org/10.37040/geografie2020125040397
- Boeri, T. (2000). Structural change, welfare systems, and labour reallocation: Lessons from the transition of formerly planned economies. Oxford University Press.
- Cantafio, G. U., & Ryan, S. (2020). Incorporating innovation metrics in urban indices: The sustain-LED index. Regional Studies, Regional Science, 7(1), 133–163. https://doi.org/10.1080/21681376.2020.1760731
- Čapkovičová, A. (2016). Transformation of the employment base in Czech rural regions. Regional Studies, Regional Science, 3(1), 229–238. https://doi.org/10.1080/21681376.2016.1165626
- Caragliu, A., & Del Bo, C. F. (2022). Smart cities and urban inequality. Regional Studies, 56(7), 1097–1112. https://doi.org/10.1080/00343404.2021.1984421
- Cardoso, R. V., & Meijers, E. J. (2017). Secondary yet metropolitan? The challenges of metropolitan integration for second-tier cities. Planning Theory & Practice, 18(4), 616–635. https://doi.org/10.1080/14649357.2017.1371789
- Carmo, R. M., & Ferreira, D. (2019). Resilience and transformation in times of economic crisis: The persistence of community in the Lisbon metropolitan area. Community Development, 50(5), 515–535. https://doi.org/10.1080/15575330.2019.1666156
- Di Caro, P. (2015). Recessions, recoveries and regional resilience: Evidence on Italy. Cambridge Journal of Regions, Economy and Society, 8(2), 273–291. https://doi.org/10.1093/cjres/rsu029
- de Falco, S., Angelidou, M., & Addie, J. P. D. (2019). From the ‘smart city’ to the ‘smart metropolis’? Building resilience in the urban periphery. European Urban and Regional Studies, 26(2), 205–223. https://doi.org/10.1177/0969776418783813
- Cevik, S., & Correa-Caro, C. (2020). Taking down the wall: Transition and inequality. Review of Development Economics, 24(1), 238–253. https://doi.org/10.1111/rode.12637
- Cichocki, S., Tyrowicz, J., & van der Velde, L. (2017). Cyclical trend of labor reallocation in Poland: Transition and structural change. Eastern European Economics, 55(6), 543–556. https://doi.org/10.1080/00128775.2017.1381027
- Coyle, D. (2014). GDP: A brief but affectionate history. Princeton University Press.
- Drahokoupil, J. (2009). After transition: Varieties of political-economic development in Eastern Europe and the former soviet union. Comparative European Politics, 7(2), 279–298. https://doi.org/10.1057/cep.2008.30
- Egedy, T., Kovács, Z., & Kondor, A. C. (2017). Metropolitan region building and territorial development in Budapest: The role of national policies. International Planning Studies, 22(1), 14–29. https://doi.org/10.1080/13563475.2016.1219652
- Erixon, H., Borgström, S., & Andersson, E. (2013). Challenging dichotomies – Exploring resilience as an integrative and operative conceptual framework for large-scale urban green structures. Planning Theory & Practice, 14(3), 349–372. https://doi.org/10.1080/14649357.2013.813960
- Feria, J. M., Casado-Díaz, J. M., & Martínez-Bernabéu, L. (2015). Inside the metropolis: The articulation of Spanish metropolitan areas into local labor markets. Urban Geography, 36(7), 1018–1041. https://doi.org/10.1080/02723638.2015.1053199
- Filandri, M., & Struffolino, E. (2019). Individual and household in-work poverty in Europe: Understanding the role of labor market characteristics. European Societies, 21(1), 130–157. https://doi.org/10.1080/14616696.2018.1536800
- Fingleton, B., Garretsen, H., & Martin, R. (2012). Recessionary shocks and regional employment: Evidence on the resilience of U.K. Regions. Journal of Regional Science, 52(1), 109–133. https://doi.org/10.1111/j.1467-9787.2011.00755.x
- Giannakis, E., & Bruggeman, A. (2017). Determinants of regional resilience to economic crisis: A European perspective. European Planning Studies, 25(8), 1394–1415. https://doi.org/10.1080/09654313.2017.1319464
- Giffinger, R., & Gudrun, H. (2010). Smart cities ranking: An effective instrument for the positioning of cities? ACE architecture. City and Environment, 4(12), 7–25. https://doi.org/10.5821/ace.v4i12.2483
- Golubchikov, O. (2016). The urbanization of transition: Ideology and the urban experience. Eurasian Geography and Economics, 57(4–5), 607–623. https://doi.org/10.1080/15387216.2016.1248461
- Guadagno, E. (2017). Technology and the resilience of metropolitan region. Information, Communication & Society, 20(12), 1802–1804. https://doi.org/10.1080/1369118X.2017.1365154
- Hendrikse, R. P., & Sidaway, J. D. (2014). Financial wizardry and the golden city: Tracking the financial crisis through Pforzheim, Germany. Transactions of the Institute of British Geographers, 39(2), 195–208. https://doi.org/10.1111/tran.12024
- Hollands, R. G. (2008). Will the real smart city please stand up? City: Analysis of Urban Trends, Culture, Theory, Policy, Action, 12(3), 303–320. https://doi.org/10.1080/13604810802479126
- Hudson, R. (2010). Resilient regions in an uncertain world: Wishful thinking or a practical reality? Cambridge Journal of Regions, Economy and Society, 3(1), 11–25. https://doi.org/10.1093/cjres/rsp026
- Iwasaki, I., & Tokunaga, M. (2016). Technology transfer and spillovers from FDI in transition economies: A meta-analysis. Journal of Comparative Economics, 44(4), 1086–1114. https://doi.org/10.1016/j.jce.2016.10.005
- Kohonen, T. (1997). Self-organizing maps, 2nd Extended Ed. Springer.
- Kourtit, K., Nijkamp, P., & Arribas, D. (2012). Smart cities in perspective–a comparative European study by means of self-organizing maps. Innovation: The European Journal of Social Science Research, 25(2), 229–246. https://doi.org/10.1080/13511610.2012.660330
- Kumar, T. V., & Dahiya, B. (2017). Smart economy in smart cities. In T. V. Kumar (Ed.), Smart economy in smart cities (pp. 3–76). Springer.
- Leick, B., & Lang, T. (2018). Re-thinking non-core regions: Planning strategies and practices beyond growth. European Planning Studies, 26(2), 213–228. https://doi.org/10.1080/09654313.2017.1363398
- Ling, T. Y. (2021). Investigating the malleable socioeconomic resilience pathway to urban cohesion: A case of Taipei metropolitan area. Environment, Development and Sustainability, 23, 13016–13041. https://doi.org/10.1007/s10668-020-01197-9
- Lisbon European Council. (March 2000). http://www.consilium.europa.eu
- Lombardi, P., Giordano, S., Farouh, H., & Yousef, W. (2012). Modelling the smart city performance. Innovation: The European Journal of Social Science Research, 25(2), 137–149. https://doi.org/10.1080/13511610.2012.660325
- Martin, R., Sunley, P., Gardiner, B., & Tyler, P. (2016). How regions react to recessions: Resilience and the role of economic structure. Regional Studies, 50(4), 561–585. https://doi.org/10.1080/00343404.2015.1136410
- Mieszkowski, K., & Barbero, J. (2021). Territorial patterns of R&D+ I grants supporting smart specialisation projects funded from the ESIF in Poland. Regional Studies, 55(3), 390–401. https://doi.org/10.1080/00343404.2020.1782877
- Mikuła, Ł. (2022). Creating planning visions for fragmented post-socialist city-regions. Regional Studies, 57(4), 670–684. https://doi.org/10.1080/00343404.2022.2051469
- Mikuła, Ł, & Kaczmarek, T. (2017). Metropolitan integration in Poland: The case of Poznań metropolis. International Planning Studies, 22(1), 30–43. https://doi.org/10.1080/13563475.2016.1256191
- Nardo, M., Saisana, M., & Saltelli, A. (2019). Smart cities and inclusive growth. 1st OECD Roundtable on Smart Cities and Inclusive Growth.
- Nardo, M., Saisana, M., Saltelli, A., Tarantola, S., Hoffman, A., & Giovannini, E. (2008). Handbook on constructing composite indicators and user guide. Organisation for Economic Co-operation and Development (OECD).
- Nesporova, A. (2001). Unemployment in transition economies. Employment Strategy Department, International Labour Office (ILO).
- Organisation for Economic Co-operation and Development (OECD). (2020). Measuring smart cities’ performance. Do smart cities benefit everyone? 2nd OECD Roundtable on Smart Cities and Inclusive Growth.
- Oke, A. E., Aghimien, D. O., Akinradewo, O. I., & Aigbavboa, C. O. (2020). Improving resilience of cities through smart city drivers. Construction Economics and Building, 20(2), 45–64. https://doi.org/10.5130/AJCEB.v20i2.6647
- Reveiu, A., Vasilescu, M. D., & Banica, A. (2022). Digital divide across the European union and labour market resilience. Regional Studies, 1–15. https://doi.org/10.1080/00343404.2022.2044465
- Rigby, D. L., Roesler, C., Kogler, D., Boschma, R., & Balland, P. A. (2022). Do EU regions benefit from smart specialisation principles? Regional Studies, 1–16. https://doi.org/10.1080/00343404.2022.2032628
- Rizzi, P., Graziano, P., & Dallara, A. (2017). A capacity approach to territorial resilience: The case of European regions. The Annals of Regional Science, 60(3), 285–328. https://doi.org/10.1007/s00168-017-0854-1
- Sensier, M., Bristow, G., & Healy, A. (2016). Measuring regional economic resilience across Europe: Operationalizing a complex concept. Spatial Economic Analysis, 11(2), 128–151. https://doi.org/10.1080/17421772.2016.1129435
- Svejnar, J. (1999). Labour market in the transitional central and east European economies. In O. Ashenfelter & D. Card (Eds.), Handbook of labour economics, volume 3 (pp. 2810–2857). Elsevier.
- Sýkora, L., & Ourednek, M. (2007). Sprawling post-communist metropolis: Commercial and residential suburbanization in Prague and Brno, the Czech Republic. In Razin, E., Dijst, M., & Vazquez, C. (Eds.), Employment deconcentration in European metropolitan areas (pp. 209–233). Springer. https://doi.org/10.1007/978-1-4020-5762-5_8
- Wiest, K. (2012). Comparative debates in post-socialist urban studies. Urban Geography, 33(6), 829–849. https://doi.org/10.2747/0272-3638.33.6.829
- Wojnicka-Sycz, E. (2020). Theory-based evaluation criteria for regional smart specializations and their application in the Podkarpackie voivodeship in Poland. Regional Studies, 54(11), 1612–1625. https://doi.org/10.1080/00343404.2020.1802419
- Ženka, J., Slach, O., & Pavlík, A. (2019). Economic resilience of metropolitan, old industrial, and rural regions in two subsequent recessionary shocks. European Planning Studies, 27(11), 2288–2311. https://doi.org/10.1080/09654313.2019.1638346
- Zhang, X., & Li, H. (2018). Urban resilience and urban sustainability: What we know and what do not know? Cities, 72, 141–148. https://doi.org/10.1016/j.cities.2017.08.009
- Zhu, S., Li, D., & Feng, H. (2019). Is smart city resilient? Evidence from China. Sustainable Cities and Society, 50. https://doi.org/10.1016/j.scs.2019.101636
