
ABSTRACT
This article focuses on the neighbourhoods and people that have been left behind in the economic transformation of two now-diversified old industrial regions: Geelong (Victoria) in Australia and Oshawa (Ontario) in Canada. Political discontent has found expression in different ways in the two locations. This, we contend, reflects policy frameworks that dampen the extent to which socio-spatial inequality and entrenched disadvantage generate discontent within regions. In assessing the factors producing this outcome, this article clarifies both the who, what and where of ‘left behindness’ and related regional policy responses.
1. INTRODUCTION
This article examines the neighbourhoods and people that have been left behind in the diversification and economic transformation of old industrial regions. It focuses on the former manufacturing-dominated cities of Geelong in Australia and Oshawa in Canada, both of which have successfully diversified their economies through a combination of infrastructure projects, property-driven urban rejuvenation and crisis interventions associated with automotive plant closures. The article is principally concerned with the neighbourhoods within these cities where living conditions have stagnated or deteriorated despite the regeneration of their immediate environment. Whilst the left-behind approach would expect evidence of rising intra-regional inequality to generate a similar politics of discontent in both cities (Dijkstra et al., Citation2020; Jennings & Stoker, Citation2019), in practice this outcome was more prevalent in Oshawa than Geelong. This, we contend, reflects how institutional arrangements and policy frameworks can dampen or exacerbate the extent to which disadvantage produces a sense of discontent.
The article contends that political discontent associated with ‘left behindness’ is the product of regional development policy approaches that are blind to the production of inequalities. By teasing out the factors contributing to different outcomes in the two case study sites – both deindustrialising cities in jurisdictions that have never fully embraced a winner-takes-all model of market capitalism – we argue that tackling left behindness demands a rethink of policy frameworks that condone or encourage uneven development. We demonstrate that industrial diversification policies have a dark side that downplays and actively exacerbates the problems faced by workers and residents in disadvantaged neighbourhoods of diversifying cities. Geographies of discontent (Dijkstra et al., Citation2020), we contend, are created by the structural intersection of economic and policy regimes, and the barriers and exclusions they create for people living and working in these places.
The remainder of the paper is structured as follows. The next section presents a brief review of various understandings of ‘left behindness’. The third section introduces the article’s two case study locations and explains the merits of multi-method comparative case study research. The paper then details recent economic development in each place, both of which have been lauded as success stories of regional diversification. It highlights their parallel industrial histories, similar sizes and positionings within inter-urban hierarchies. It then documents each city’s experience of planned urban regeneration, diversification-oriented regional policy, and crisis-based structural adjustment interventions, contrasting Geelong’s more state-led approach with Oshawa’s more market-led orientation. In both cases, proximity to major cities, Melbourne and Toronto, respectively, has facilitated population-led growth, but also resulted in deeper intra-regional inequality at the neighbourhood scale. The fourth section highlights how socio-spatial inequalities map spatially and temporally, with prosperity concentrating in ‘new’ neighbourhoods as relative disadvantage worsens in ‘old’ industrial neighbourhoods. The penultimate section contends that neighbourhood-scale socio-spatial inequalities are the direct by-product of the spatial selectivity of pro-diversification regional policies, which necessarily create winners and losers. It follows that policy responses should focus on bridging the social divisions between old and new places. Effective interventions would address existing intra-regional spatial inequality and thereby forestall the political disaffection associated with left behindness.
2. LEFT-BEHIND PLACES
The political discontent expressed in support for populist parties in Europe and the United States has renewed policy interest in uneven development. There is new recognition that market-oriented regional development has been blind to the growing inequalities these policies produce. Even in prosperous growing areas, prosperity does not ‘trickle down’ to the poorest residents (Arndt, Citation1983), and in many places austerity policies have worsened socio-spatial inequalities (Fetzer, Citation2019). Despite growing academic interest in the ‘left-behind’ places within advanced economies, there is unresolved debate about what left-behind places are and what they are left behind from (MacKinnon et al., Citation2022). The shorthand definition that such places are losers generated by international competition and processes of globalisation since the 1970s (Goodwin & Heath, Citation2016) appears both too general and too simplistic (Gordon, Citation2018).
MacKinnon et al. (Citation2022) list possible indicators of left behindness as economic underperformance, below-average rates of pay, employment and productivity, comparatively low educational qualifications and skills, high rates of poverty and disadvantage, shrinking or ageing populations with high rates of outmigration, poor health outcomes, low rates of inward investment, and perceptions of political neglect that result in high levels of political disengagement (see also Furlong, Citation2019). They stress the variegated nature of left behindness, wherein local combinations of disadvantage do not necessarily include all of these indicators at once. In practice, the concept has been grounded in material disadvantage. The Local Trust organisation in the UK, for example, defines places as left behind when high levels of measurable deprivation in multiple dimensions combine with a lack of social infrastructure (Oxford Consultants for Social Inclusion (OCSI), Citation2019). Importantly for our analysis, Bolton et al. (Citation2019) note that left-behind places are likely to be sub-regional, including the sorts of neighbourhoods found at the epicentre of major plant closures, as well as places that house large proportions of disadvantaged people, such as current and former public housing estates.
However, what distinguishes a left-behind place from a disadvantaged place is that the sense of being left behind is acknowledged and that local residents perceive themselves as disempowered. The notion of ‘left behindness’ therefore hinges on grass-roots recognition of entrenched disadvantage. Material relative socio-economic disadvantage is a necessary, but not sufficient, condition of a place being ‘left behind’; it can only be labelled as such when material disadvantage gives rise to particular forms of political disaffection. Claiming the status of ‘left behind’ signifies a sense of injury or opposition to the economic and political orthodoxies that have produced adverse local outcomes. The resulting ‘geographies of discontent’ challenge established policy regimes (Crescenzi & Rodríguez-Pose, Citation2011; MacKinnon et al., Citation2022; Weller, Citation2021).
There is considerable interest in developing policies that contain or reverse political discontent, for example, by ‘levelling up’ left-behind places (Martin et al., Citation2021, p. 14). This includes an awareness that conventional regional policies – which are dominated by a focus on endogenous growth and the entrepreneurial capacities of local actors – are unlikely to reverse the fortunes of lagging places (Hassink & Kiese, Citation2021). There is also an awareness that such policies represent a failure of urban and regional planning, especially when ‘left behindness’, conceived at the inter-city scale, is viewed as the outcome of a ‘relational process of metropolitanisation’ and the associated marginalisation of less favoured places (MacKinnon et al., Citation2022, p. 41). Allowing such places to languish and decline while ‘core’ cities thrive has become untenable, as it risks the deterioration of economic performance and institutional credibility at national and supra-national scales (Rodríguez-Pose, Citation2018).
MacKinnon et al. (Citation2022, p. 40, emphasis added) define left-behind places as ‘the kinds of economically lagging and declining places, particularly former industrial and rural regions, which have expressed feelings of marginalisation and abandonment through increasing support for populist movements and parties’. This leads them to advocate reorienting policy settings to focus on social innovation and community development, with a view to rebuilding a sense of belonging and attachment. However, this solution implies that the problem is within disadvantaged locations, when perhaps the issue is actually the relationship between adjacent disadvantaged and advantaged places. In the latter case, disaffection can be associated with a fear of relegation to poverty (Wacquant, Citation2016).
The analysis in this paper is informed by perspectives that view ‘left behindness’ as an intrinsic component of wider policy settings. Antink (Citation2019, n.p.) accuses the term ‘left behind’ of normalising the predicament of disadvantaged places and their residents in a way that actively erases awareness that the deprivation in such places is the direct result of political decisions made by governments (and, we would add, the locational decisions made by firms). She sees the term as justifying abandonment:
the words ‘left behind’ imply something neutral. Something that just happened naturally. It fails to recognise the complexity of geographical inequalities … what’s happened to these towns is a direct and inevitable consequence of political decisions made by governments (of all parties) in recent decades.
The net effect of this framing has not been to question the hegemony of conventional market-oriented regional policy, but rather to justify the insertion of add-ons that seek to assuage discontent and create illusions of local control. The empirical work in the next section challenges this conclusion by showing that left behindness is produced at the same time, and by the same policies, as regional growth. Therefore, left behindness is necessarily the ‘dark side’ of conventional market-based regional development policies in old industrial places (Pinheiro et al., Citation2022). If policies that regenerate lagging regions also perpetuate intra-regional inequalities, then those policies need to change. What is needed, we argue, is more redistributive intervention, a better balance between ‘top-down’ and ‘bottom-up’ policy settings (Crescenzi & Rodríguez-Pose, Citation2011), and a stronger relationship between long-term planning and short-term crisis intervention (Harrison et al., Citation2021).
3. DIVERSIFYING DEINDUSTRIALISING CITIES: COMPARING GEELONG AND OSHAWA
This empirical section focuses on two deindustrialising cities – Geelong in the Australian state of Victoria and Oshawa in the Canadian province of Ontario. Both cities’ economies have been dependent on manufacturing historically and both have experienced a gradual process of deindustrialisation. This typically culminates in long-term regional economic decline and growing inequality relative to other regions (Bailey et al., Citation2014; Marchand et al., Citation2020). However, despite sharing many of the evolutionary characteristics of declining places, both Geelong and Oshawa have successfully diversified their economies. This outcome has been made possible by various ‘top-down’ policy interventions and by their proximity to the much larger global cities of Melbourne and Toronto. Yet, despite their growth overall, both cities contain significant pockets of disadvantage. As Boswell et al. (Citation2022, p. 170) emphasise, both the spatial concentration of disadvantage and the political discontent characteristic of left behindness can be found ‘anywhere designated a “winner” in broad macro accounts’.
The research design responded to calls for multi-scalar, mixed methods and comparative case study approaches (Boschma et al., Citation2017). The selection of the two case study sites was guided by the ‘indirect method of difference’ approach (Mill, Citation1975/1843), which compares ‘most similar’ cases that lead to ‘different outcomes’ (MSDO). The two cases were paired because they share similar key characteristics (in this case similar historical path trajectories, population sizes, economic and industrial profiles, and geographical proximity to global cities) but possess at least one differing causal mechanism that produces diverging developmental outcomes. The principal differences between Geelong and Oshawa concern each city’s institutional architecture and the extent to which development in each place has been state or market oriented.
Mixed-methods data collection involved a review of policy documents and previous research on both places, observation of key sites, interviews with key informants in both places, and detailed analysis of statistical resources. Field research conducted by the lead author in both cities in 2018 and 2019 involved semi-structured, open-ended interviews with key informants in policymaking, industry, research institutions and civic organisations. Fifteen formal interviews, each scheduled for 30–60 min, compared key dimensions of policy design and delivery in each city. The interviews used open-ended questions to reveal the logic of informants’ decision making (Clark, Citation1998, p. 73), focusing on themes related to deindustrialisation – diversification, socio-economic inequality and regional development priorities – and exploring policy initiatives relevant to each informant’s area of expertise. A total of 13 of the interviews were tape recorded and partially transcribed. For the remainder, extensive handwritten notes were taken. Data analysis followed Miles and Huberman’s (Citation1994) method of coding and comparative matrix construction. The quotes selected for inclusion are illustrative of the dominant policy agendas, decision logics and enduring challenges in these cities. They have been assigned taglines which indicate informants’ positions whilst protecting anonymity.
Publicly available statistical data were used to assess economic change. Shift–share analyses were undertaken to understand the extent to which the cities and their neighbourhoods differed from broader regional trends. Census-based data were used to assess neighbourhood-level disadvantage. For Geelong, the main source was the Australian Bureau of Statistics’ (ABS) (Citation2018) Index of Relative Socio-economic Advantage and Disadvantage (IRSAD), which integrates multiple measures of disadvantage. The Oshawa analysis used median household income, which is a widely recognised as a benchmark for socio-economic development (Marchand et al., Citation2020).
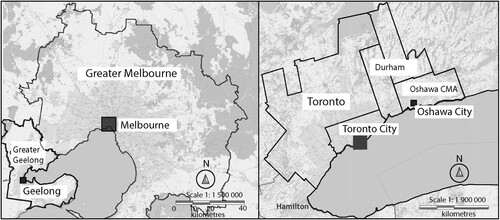
Among Geelong and Oshawa’s numerous similarities, the most important are their common histories as the most specialised manufacturing cities in their respective nations, their shared focus on the manufacture of automobiles, and their development as satellites of global cities. As shown in , central Geelong is located 45 miles (72 km) south-west of Melbourne, while the City of Oshawa is located 38 miles (61 km) north-east of downtown Toronto. The two cities are similar in size: in 2021, the City of Greater Geelong had a population of around 271,000 people, of which about 180,000 lived in the urban centre, while the City of Oshawa’s population stood at around 175,000 (ABS, Citation2022; Statistics Canada, Citation2022). Both cities are governed by a regional administration (the State of Victoria and the Province of Ontario), and both have an intermediate tier of governance (the Geelong Region Alliance (G21) and the Regional Municipality of Durham). An important difference is that Geelong is positioned as a separate regional city which is distinct from Melbourne, whereas Oshawa is considered part of the Greater Toronto Area (GTA). This, we will show, has had implications for access to redistributive regional development funding.
Figure 1. Greater Geelong and Oshawa.
Note: Shown is the City of Greater Geelong and Greater Melbourne (left-hand side); the Oshawa Census Metropolitan Area (CMA), the Region of Durham, the City of Toronto and Toronto CMA (right-hand side). The Oshawa Census Metropolitan Area contains the City of Oshawa, the Town of Whitby and the Municipality of Clarington.
For much of the second half of the 20th century, both cities were the most automotive industry-dependent cities in each country. Geelong was the centre of US-based Ford Motor Company’s Australian production, while Oshawa remains the headquarters of General Motors Canada, the subsidiary of US-based General Motors (GM). In both cases, the ‘Fordist’ manufacturing approach of the last century nurtured stable and well-paid employment for automotive workers and built local communities in which each company was an influential stakeholder. shows that in both Oshawa and Geelong, industrialisation in the post-war era generated strong population growth. However, in response to the combined effects of globalisation and labour-saving technological change since the 1970s, the automotive-dominated manufacturing sectors in both cities have experienced relentless restructuring. As shows, this has resulted in significant manufacturing job losses in both places and a declining share of manufacturing employment relative to population (on average a decline of 3.8% and 3.7% per annum, respectively, between 2006 and 2016). By 2016, the manufacturing component of their labour forces approximated each country’s national average (ABS, Citation2007, Citation2017; Statistics Canada, Citation2007, Citation2017).
Table 1. Manufacturing employment and total population, Oshawa and Greater Geelong, 1951–2016
Notably, the decline in manufacturing employment from the mid-1980s has been accompanied by steady population growth. As later sections will show, growth in Oshawa was mainly associated with commuter suburbs, reflecting proximity to Toronto, while the growth of new suburbs in Geelong accompanied local diversification into non-manufacturing industries.
Both places have faced recent crises associated with the United States’ reshoring of automotive production following the 2008 financial crisis (Vanchan et al., Citation2018). Ford’s automotive assembly operations withdrew from Geelong in 2016, while in Oshawa automotive assembly operations were shut down in late 2019, then restarted in late 2021 (Yates & Holmes, Citation2019). Well before the recent crises, however, policies in both places sought to promote economic diversification. These policies had many similarities, since both cities followed global trends that combined diversification-based long-term planning with short-term crisis intervention. Policy differences are mainly associated with the nature and degree of intervention by higher tier state institutions.
3.1. Geelong’s state-led approach
The state government of Victoria has taken a leading role in the transformation of Geelong. In 1954, nearly half (46%) of Geelong’s labour force was employed in manufacturing (ABS, Citation1955). As industries globalised and as the federal government relaxed policies of industrial protection from the mid-1970s, Geelong experienced multiple plant closures and mass job losses across manufacturing and heavy industries. This culminated in Ford’s 2013 decision to close its Geelong plants by 2016, as well as US firm Alcoa’s decision to close its Geelong aluminium plant in 2014 (Johnson, Citation2021; Johnson et al., Citation2021). Ford’s announcement precipitated the end of car manufacturing in Australia (Barnes & Weller, Citation2020; Stanford, Citation2017).
However, well before this crisis, the Victorian state government had instigated plans to diversify and revitalise Geelong. As early as the 1970s the city was identified as a site for growth to ease pressure on population and land use in Melbourne. Proposals for the relocation of government offices and higher education facilities aimed to establish Geelong as a viable alternative for private investment and to overcome Melbourne’s ‘overshadowing’ influence (Cities Commission, Citation1973, p. 71). The state government established Victoria’s first non-metropolitan university, Deakin University, in Geelong in 1974.
State policies promoting Geelong’s industrial diversification have existed since the 1990s (Johnson, Citation2021; Johnson et al., Citation2021). After a 2002 report warned of looming growth pressures in Melbourne, the Victorian Government (Citation2002) committed to major infrastructure projects to accelerate growth in Geelong, including the upgrading of rail and road links between Melbourne and Geelong, improvements to the Port of Geelong, and the development of an international airport. State policies also supported Deakin University’s expansion to a ‘triple helix’ role in local innovation and skill development.
The relocation of a range of public institutions, including the state government’s Transport Accident Commission (TAC) in 2005 and the newly created National Disability Insurance Agency (NDIA) in 2013, as well as the redevelopment and expansion of Barwon Health, generated numerous employment opportunities in the city. Whilst these public sector initiatives created direct employment growth, they also aimed to stimulate jobs indirectly through increased private investment in related services. A former advisor (interview code RER29) to the Victorian government suggested that the purpose of increased state investment was to create a ‘multiplier effect in those communities’:
When you take all of the human service investments that have been made, education and health being the two largest obviously, then you can really influence broader economic development opportunities and ways in which then you can get other industries to move into those communities.
These expenditures stimulated significant population inflows, mainly from Melbourne (Victorian Government, Citation2020), and have been accompanied by growth in private residential housing development, including the creation of entirely new suburbs on Geelong’s outskirts. Housing is significantly less expensive in Geelong compared with Melbourne: as former Geelong Deputy Mayor Peter Murrihy explained in 2018, ‘it’s because of the affordability that people want to come to Geelong’ (cited in Dyett, Citation2018). Overall, this long-term, state-led project of urban development has diversified Geelong’s local economy into service industries which are unrelated to its earlier manufacturing specialisation.
The policy response to the automotive closure crisis added new layers of short-term crisis intervention. The ‘unusually centralised’ nature of the Australian federal system (Hooghe et al., Citation2010, p. 102) encourages both state and federal government intervention in local crises through the deployment of ad hoc place-based ‘structural adjustment’ policies (Beer, Citation2015; Weller, Citation2017; Weller & Tierney, Citation2017). In Geelong, intervention was triggered following Ford’s closure announcement and involved a combination of people- and place-based measures. The place-based Geelong Region Innovation and Investment Fund (GRIIF) provided financial support to firms in any sector that could demonstrate a capacity for job-creating expansion. The funds, which were provided by contributions from the federal government, state government, Ford and Alcoa, were administered by a committee of regional stakeholders, which included firms, unions and community agencies. However, funding allocations were decided and controlled centrally by the federal government. Funding, which provided assistance for firms to plan, finance and implement product or process diversification and/or export market development, was conditional on new local employment creation.
The people-based component of the crisis response focused on providing counselling, upskilling and job search assistance for retrenched former automotive workers. Managed through the Ford Transition Project (FTP), this intervention aimed to improve the market-based reallocation of the displaced automotive workforce to new jobs. However, the assistance did not match displaced workers directly with the new jobs created by the GRIIF. An informant (interview code IOI88) involved in managing the assistance project saw this as a limitation:
If you don’t lock in through jobs the opportunity for the retrenched workers to apply, and perhaps corral a number of jobs in that area, then you’ve lost an opportunity. Because (otherwise) you don’t know who is going to apply for those roles and they’re not necessarily retrenched people. … They’re not really targeted programs.
Overall, the diversification of Geelong’s economy created new employment in the public sector and in construction, technical, administrative, professional and other services. This – as well as the improved capacity to commute to Melbourne – attracted population growth (Johnson, Citation2021). By 2016, manufacturing had become the city’s fifth largest industry behind health, retail, construction and education (ABS, Citation2017). Recent rebranding of the city celebrates these changes as new-found strengths. Importantly, groups such as the regional G21 Alliance also acknowledge – indeed, they emphasise – areas that still require action, thus creating the basis for new mission-like projects in need of state support.
3.2. Oshawa’s market-led framework
Like Geelong’s role in Australia, Oshawa developed as Canada’s most specialised manufacturing city. In 1951, nearly two-thirds (64%) of Oshawa workers were employed in manufacturing – a higher concentration than any other significant urban area in the country (Statistics Canada, Citation1952). With automotive assembly operations dating back more than a century, Oshawa was known as ‘Canada’s Motor City’ (Hood, Citation1968). Oshawa is the headquarters of General Motors (GM) Canada and its massive ‘Autoplex’ facilities dominate the south Oshawa landscape. At its peak in the mid-1980s, GM Oshawa employed around 23,000 people (Gee, Citation2018). According to Durham federal MP and former federal Conservative opposition leader, Erin O’Toole, Oshawa once ‘epitomised the concept of a “company town”’ (O’Toole, Citation2018).
Deindustrialisation in Oshawa has largely centred on retrenchments at GM and its various suppliers, with major shocks including the closures of a fabrication plant in 1997 and a truck plant in 2009. Despite the reversal of the 2019 closure of local GM assembly operations – which occurred in the context of the Donald Trump administration’s opposition to the North American Free Trade Agreement (NAFTA) – in late 2021, local employment was estimated to have declined to approximately 2000 workers (GMC, Citation2021), a small fraction of peak employment in the 1980s (Aquanno & Bryant, Citation2021).
Like Geelong, Oshawa’s economic diversification has been a long-term process with significant input from state institutions. The relocation of the headquarters of the Ontario Ministry of Finance to Oshawa in 1982, under the ‘Go East’ spatial equalisation policy of the Davis provincial government (1971–85), is an important example. The ministry remains one of Oshawa’s largest employers. More recently, investments in the health and education sectors, anchored by the establishment of the University of Ontario Institute of Technology (UOIT) in 2002, have underpinned the city’s diversification (Siemiatycki, Citation2013). By 2019, eight of Oshawa’s top 10 largest employers were in the public sector (Region of Durham, Citation2019).
However, in contrast to Geelong, Oshawa’s access to funding from the provincial government has been restricted by its administrative positioning. The government of Ontario considers Oshawa a part of the metropolitan GTA and includes the city in Toronto’s transport and regional planning (even though Canada’s census considers Oshawa to be separate from Toronto). This has prevented Oshawa from accessing regional spatial equalisation funds, which are Ontario’s main mechanism for addressing uneven development, usually available only to areas outside the GTA. An Ontario government official explained (interview code ABA12) that Oshawa was perceived as being in an advantageous position relative to remote disadvantaged places: ‘Oshawa is seen as part of the GTA for better or for worse. If that means they’re not eligible for funding that’s supposed to go to external regions, so be it.’
Much of the recent growth in Oshawa has been driven by private housing development. Like Geelong, affordability has been a key driver: in 2019, Oshawa had the second lowest average house price in the GTA (Toronto Real Estate Board (TREB), Citation2019). From 2012 to 2015, the Oshawa census metropolitan area was Canada’s second most attractive destination for net positive internal migration after Edmonton, driven by net inflows from Toronto which more than compensated for outflows to other areas (Sergerie, Citation2016).
Oshawa’s workforce increasingly commutes to Toronto for employment (Statistics Canada, Citation2007, Citation2017) (). As a City of Oshawa official (interview code FGH32) explained:
Our ratio of jobs to labour force is not quite as strong as I’d like it to be. I think if we start looking at the demographic shift and commuting pattern, a lot of that is related to the growth of north Oshawa where we’ve had significant new residential development.
Table 2. Employment, population and commuting, Greater Geelong and Oshawa, 2006–16.
Worker assistance services were limited compared with Geelong. Furthermore, there was no job creation programme equivalent to Geelong’s GRIIF.
These limitations are partly explained by Ontario’s more market-driven policy orientation. Ontario is a ‘business-led competition state’ or ‘business government alliance’ (Rutherford et al., Citation2018, pp. 574, 581), which has tended to marginalise labour and redistributive social welfare (Boudreau et al., Citation2007). Ontario’s market-led approach stands in contrast to other Canadian provinces, such as the more ‘dirigiste’ developmental state in Quebec (Boudreau et al., Citation2007, p. 50). The Ontario government’s embrace of spatially competitive policies has weakened labour’s bargaining capacity, particularly in the auto industry, enabling GM to win increasing concessions from Oshawa workers (Aquanno & Bryant, Citation2021; Siemiatycki, Citation2012; see also Rutherford et al., Citation2018). As a consequence, diversification in Oshawa has relied on attracting private investment in recent years, which has materialised mainly in population-based service industries and residential housing development. Retail and health services have become the largest industries in the city, with construction, education and professional service industries also increasing (Statistics Canada, Citation2017). By 2016, the manufacturing proportion of Oshawa’s labour force was roughly equivalent to the provincial and national average – a far cry from its heyday.
The more market-based diversification process in Oshawa has not created new employment as quickly as state-led, project-driven policies in Geelong. This reflects the more decentralised nature of the Canadian model, where different provincial spatial equalisation regimes dilute the rationale for federal place-based crisis interventions (Higgins & Savoie, Citation1994). In addition, the competitive context impels municipal officials to adopt upbeat public positions focused on attracting private investment, an orientation that demands the downplaying of crises and social inequalities (Siemiatycki, Citation2013; Tierney, Citation2021).
3.3. Comparing outcomes in Geelong and Oshawa
These different approaches have influenced different rates of job creation and population growth. shows that between 2006 and 2016, the employed labour force in Geelong grew by 20% and the population by 18%, suggesting a virtuous cycle in which employment growth accompanied population growth. In Oshawa, on the other hand, the population grew by 13%, far exceeding the 4% increase in the employed labour force, suggesting a declining local employment-to-population ratio. also shows that a significantly higher proportion of the workforce is employed locally in Geelong compared with Oshawa. Moreover, this local share of employment in Geelong was largely maintained between 2006 and 2016, whilst falling in Oshawa from 46% to 38% as the city transitioned from an industrial hub to an increasingly commuter-based town.
Between 2006 and 2016, direct public administration employment in Oshawa barely changed (increasing by only 200 jobs) while public administration employment in Greater Geelong recorded a net increase of 1615 jobs (ABS, Citation2007, Citation2017; Statistics Canada, Citation2007, Citation2017). This difference reflects the more interventionist approach to attracting both employment and population growth in Geelong. Nonetheless, in both cases, agglomeration diseconomies in the adjacent global cities of Toronto and Melbourne have pushed low- and middle-income residents outward, creating a demand for housing-led growth in the two satellite cities (August & Walks, Citation2018; United Way, Citation2017; Weller & van Hulten, Citation2012). While this process has enabled both cities to side-step several outcomes commonly associated with ‘left-behind’ deindustrialised places, it has also led to increasing socio-economic polarisation at the neighbourhood level.
4. UNEVEN NEIGHBOURHOOD TRAJECTORIES
This section will show that core former industrial neighbourhoods in both cities have not benefitted equally from diversification-based growth. It examines socio-economic change within each city to better understand the who, what and where of left-behind places.
4.1. Old and new Oshawa
In Oshawa’s market-led economy, diversification has sharpened internal spatial divisions. Most local growth has been to the north of the city. This area, now called north Oshawa, was once the sparsely populated rural municipality of East Whitby. When East Whitby was merged into the City of Oshawa in 1974, there was very little difference, in income terms, between residents of East Whitby and residents of Oshawa’s south-western neighbourhoods who lived close to the GM Autoplex (Tierney, Citation2021).
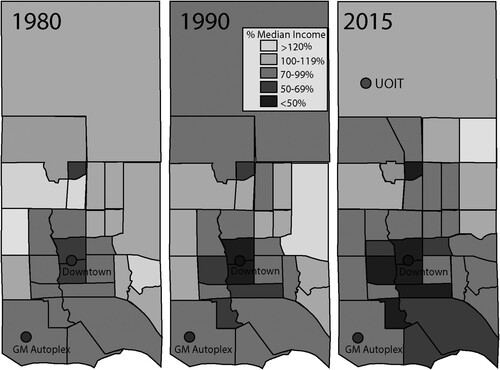
shows the median income of neighbourhoods in the City of Oshawa as a proportion of the Durham regional median for 1980, 1990 and 2015. In 1980, when manufacturing employment was near its peak, half of the city’s census tracts, including those in the central-west and central-east, had relatively high median incomes compared with the wider Durham region. By 2015, fewer than 20% of Oshawa census tracts had median incomes above the Durham median; all of those were clustered in northern areas, where residential development was transforming formerly rural land contained within the pre-1974 border of East Whitby. In the ‘old’ industrial neighbourhoods contained within the urban pre-1974 Oshawa boundaries, median household income had deteriorated relative to the regional median, particularly in industrial south Oshawa and the city’s downtown core, but also in central east and west areas that were formerly relatively advantaged. By 2016, the lowest income neighbourhoods in Oshawa comprised five of Durham’s seven most socio-economically disadvantaged neighbourhoods according to the Region of Durham (Citation2016), despite Oshawa only comprising one quarter (25%) of Durham’s population (Statistics Canada, Citation2022).
Figure 2. Median income, neighbourhoods of Oshawa, 1980, 1990, 2015.
Note: Median household income is benchmarked to the Durham Region median.
Sources: Authors’ calculations based on Statistics Canada census tract data (1982, 1992, 2017).
To clarify this shift in employment terms, reassembles data published at the census tract level to compare the ‘Old’ and ‘New’ Oshawa. ‘Old’ Oshawa is defined by pre-1974 city boundaries while ‘New’ Oshawa comprises the north and north-western tracts that correspond to the former East Whitby.Footnote2
Figure 3. Industrial change, ‘new’ and ‘old’ Oshawa, 1991–2016.
Note: Shown is the regional ‘competitive effect’ (percentage increase/decrease) in selected industries relative to Ontario.
Sources: Authors’ calculations based on custom geography from Statistics Canada (Citation1992, Citation2017).
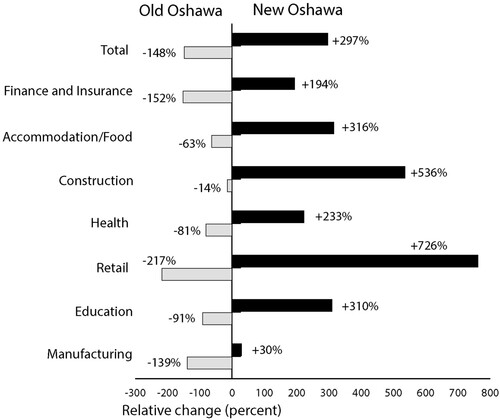
reports the results of a shift–share analysis that compared the percentage change in employment in key industries relative to Ontario-wide changes between 1991 (when net manufacturing was already in the process of decline) and 2016. Results reveal that employment growth in New Oshawa has coexisted with a significant relative decline in Old Oshawa. This demonstrates that residential development and diversification-led prosperity in the north has not ‘trickled down’ to deindustrialising neighbourhoods in the south. It also shows that the magnitude of relative decline in Old Oshawa was greater in retail and finance/insurance than the expected decline in manufacturing. The relative gain in New Oshawa spanned every sector and was greatest in the (housing-related) retailing and construction sectors.
Overall, representations of Oshawa as a diversification success story mask widening internal socio-spatial polarisation and a concentration of the effects of deindustrialisation in the neighbourhoods of Old Oshawa. These changes have been accompanied by a heightened local awareness of socio-spatial divisions. In the local vernacular, the rapidly expanding north Oshawa, near the main campus of UOIT, has become known as ‘Poshawa’, while the industrial heartland of south Oshawa near the Autoplex, where disadvantage has concentrated, has become known as the ‘dirty ‘Shwa’ (Gee, Citation2018). Spatial ostracisation fuels the resentments associated with left behindness.
4.2. Old and new Geelong
A similar pattern of intra-urban inequality has emerged in Greater Geelong. compares the relative disadvantage of suburbs within Geelong in 2006 and 2016, as assessed by the ABS (Citation2018) Index of Relative Socio-Economic Advantage and Disadvantage (IRSAD), which incorporates multiple economic and social indicators. ABS data categorises Geelong’s suburbs by their IRSAD score in quintiles that indicate the severity of (dis)advantage. shows that the northern and south-eastern industrial areas of Geelong clustered around the old Ford and Alcoa production plants are the most disadvantaged suburbs in Geelong and that their relative disadvantage has increased as Geelong has diversified.
Figure 4. Relative disadvantage, Geelong urban centre and surrounds, 2006, 2016.
Note: Based on Australian Bureau of Statistics (ABS) (Citation2018) IRSAD quintiles. Quintile 1 represents ‘most disadvantaged’ suburbs, while quintile 5 represents ‘most advantaged’ suburbs.
Sources: ABS (Citation2007, Citation2017).
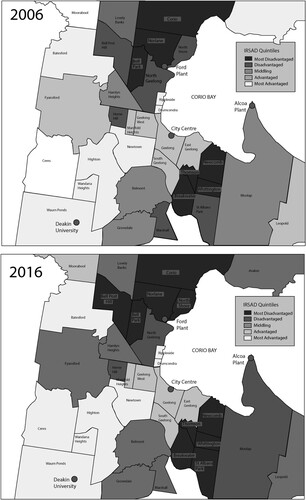
The suburb closest to Ford’s former Geelong facilities (Norlane) is recognised as one of the most disadvantaged places in Victoria (Victorian Government, Citation2010; Weller, Citation2021). As was the case with Oshawa and UOIT, the most advantaged suburbs of Geelong are new developments close to Deakin University to the south-west of the city. Like Oshawa, there is a clear divide between the prosperous new suburbs and the old industrial suburbs (Victorian Government, Citation2010).
compares employment growth by sector for Greater Geelong as a whole and in Geelong’s 10 most disadvantaged urban suburbs (IRSAD 1) relative to the Victorian trend between 2006–2016. It shows that the relative decline of employment in the old industrial suburbs has impacted multiple sectors, including services. Most relative employment growth has been in Geelong’s booming finance and insurance sector, with a 162% relative increase, mainly due to the NDIA relocation. In contrast to ‘Old’ Oshawa, relative employment in finance and insurance has grown by 60% in disadvantaged locations as well, suggesting that – to a limited extent – prosperity has ‘trickled down’ through the city. There has also been a small relative gain in health sector employment in disadvantaged areas, further suggesting redistributive gains.
Figure 5. Industrial change, Greater Geelong and 10 disadvantaged industrial suburbs, 2006–16.
Note: Shown is the regional ‘competitive effect’ (percentage increase/decrease) in selected industries in Greater Geelong and the Geelong Urban Centre’s 10 most disadvantaged suburbs (IRSAD 1) relative to Victoria.
Sources: Authors’ calculations based on Australian Bureau of Statistics (ABS) (Citation2007, Citation2017).
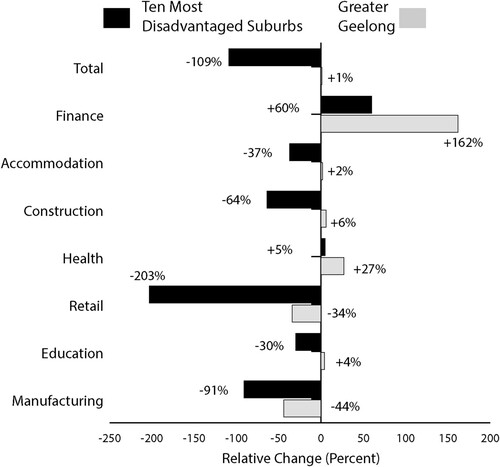
As well as the expected decline in manufacturing employment, the disadvantaged suburbs have also lost out in the construction and education sectors. As in the case of Oshawa, the relative decline in retail services, down by 203%, is the most striking aspect of the changed industrial profile of Geelong’s disadvantaged suburbs.
5. DISADVANTAGED PLACES OR LEFT-BEHIND PLACES?
Economic change is always a spatially selective process. In both case studies, this process has manifested in the concentration of disadvantage in old industrial neighbourhoods of now thriving cities. In both cities, nominally successful regional diversification has been accompanied by entrenched disadvantage, rising inequality and deepening social division between old and new neighbourhoods. Worsening disadvantage in old industrial neighbourhoods suggests that neither former industrial workers nor their family members are accessing new service sector jobs located nearby in sufficiently large numbers.Footnote3 Despite the job search assistance provided to retrenched workers, the actual allocation of jobs was governed by competitive labour market processes in which industrial workers struggled to compete for new jobs unrelated to their skills and previous occupations. Consequently, in both locations, many former automotive workers – most of whom had previously enjoyed stable jobs that paid relatively high wages – have been relegated to low-wage work and insecure employment (Barnes & Weller, Citation2020; Siemiatycki, Citation2013).
In both places, the disadvantaged neighbourhoods where many of these workers live feature many of the characteristics associated with ‘left behindness’, including high unemployment rates, poor quality, low paid and precarious employment, skills deficits, health challenges and low rates of inward investment. In both places, disadvantage and advantage coexist in close proximity. In Geelong, areas of extreme disadvantage are walking distance from places of extreme advantage. The question is whether, or under what circumstances, the increasing relative disadvantage of these neighbourhoods fuels the emotional and political responses of disengagement (Furlong, Citation2019) or discontent (Dijkstra et al., Citation2020) that are indicative of ‘left behindness’.
As suggested by the contrast between ‘Poshawa’ and the ‘dirty Shwa’, discontent is overtly evident in the more market-oriented and stigmatising Oshawa context. Over time, Oshawa’s market-led transformation has generated profound political change, shifting local politics to the right and fuelling disengagement and disaffection. Despite Oshawa having been a centre for union activism and left-wing politics in the automotive sector’s heyday, both of Oshawa’s federal electoral districts (one centred on prosperous north Oshawa and surrounding Durham areas, the other on industrial central and south Oshawa) have become Conservative strongholds since 2004. This is notable because in 2021, these were among only a small handful of GTA districts held by Conservatives, while almost fifty were held by Liberals. This reflects a political divide between the centre-left Liberal-dominated city and its Conservative-dominated hinterlands, where perceptions of neglect have stoked discontent (Taylor, Citation2019). Political disengagement is also evidenced by low voter turnout. In the 2021 provincial election, for example, the estimated 56% turnout in the district of Oshawa was far short of the 63% national turnout.
Although the social democratic New Democratic Party (NDP) has held the provincial electorate of Oshawa since 2014, a right-wing populist faction within Oshawa’s local union movement has long challenged the NDP’s progressive politics (Aquanno & Bryant, Citation2021). Racist and xenophobic rhetoric has been commonplace in the campaign against offshoring (Fairweather, Citation2022). This suggests the emergence of anxieties about being ‘left behind’ in the remaining, and still threatened, industrial core.
Local politics in Geelong, by contrast, has long been dominated by the social democratic and union-affiliated Australian Labor Party. Here, extensive and timely interventions orchestrated by Labor federal and state governments have significantly assuaged political discontent, including in the disadvantaged suburbs. Weller (Citation2021) attributes this to the perceived quality of the crisis interventions, which were widely understood as having improved local opportunities, and which thereby mollified the sense of abandonment that produces discontent.
If left behindness is defined by overt political discontent then, despite similar patterns of socio-spatial polarisation in the two places, the neighbourhoods of ‘old’ Oshawa are left behind, but the industrial suburbs of Geelong are not. This outcome reflects the different political systems and redistributive frameworks of the two places. In Australia, long- and short-term policy interventions mitigate the spatial effects of market forces and discourage the political excesses characteristic of Anglo-American liberal market political economic systems, such as Ontario’s ‘competition state’. It follows that the sense of being left behind is the consequence not only of economic processes associated with deindustrialisation, but also the quality of the political responses to those processes (Leyshon, Citation2021; Weller, Citation2021).
These findings support the contention that research into left behindness needs to move beyond simplistic, dichotomous ‘grand narratives’ about winners and losers, such as ‘superstar’ versus lagging cities, to give more nuanced accounts of uneven development (Boswell et al., Citation2022, p. 187). Although both cities are, in certain respects, diversification success stories, the devastating socio-economic impacts of deindustrialisation are still evident in each city’s most affected industrial neighbourhoods. In each case, the intensity of political discontent mirrored the extent of timely redistributive intervention. Nonetheless, place-based interventions that aided the transition of these economies into new industries also contributed to the ‘dark side’ of diversification by exacerbating relative intra-regional socio-spatial inequality. This suggests that future research should focus on the relational, multi-scalar reality of ‘left behindness’.
6. POLICY IMPLICATIONS AND CONCLUSIONS
This article has documented the growing socio-spatial polarisation produced by economic diversification in Geelong and Oshawa. In both locations, socio-economic disadvantage has concentrated in old industrial areas with hitherto high levels of manufacturing employment, while employment growth has concentrated in adjacent and increasingly prosperous areas largely unaffected by deindustrialisation. This has left both cities socio-spatially divided between ‘old’ industrial and ‘new’ service-oriented or commuter neighbourhoods. New sources of economic prosperity, generated by new layers of diversified industry, have in both cases excluded the poorest neighbourhoods. These findings corroborate claims that intra-regional socio-spatial inequality is a ‘dark side’ of regional diversification policies (Pinheiro et al., Citation2022), especially those focused on promoting the growth of unrelated industries in deindustrialising places.
From the perspective of this study, social deprivations associated with left-behind places reflect a sense of exclusion from adjacent prosperity, one that has arisen from the material facts of deindustrialisation, long-term restructuring and economic diversification. Two policy implications follow from this prognosis. First, if the intra-regional spatial blindness of regional policies simply reproduce pockets of deprivation, then regional policy has to change to ensure that these places are not left behind. This might include, for example, mandating that a minimum proportion of revitalisation funding is spent in neighbourhoods experiencing deindustrialisation. If residents of these neighbourhoods are not able to compete in the labour market, then policies need to intervene to place disadvantaged people into jobs where labour market mechanisms alone will not.
Second, it suggests that policy responses need to tackle the causes, rather than simply the effects of discontent. In the UK, renewed interest in uneven development has produced a ‘levelling up’ agenda (Martin et al., Citation2021). Although what this means for policy is not yet entirely clear (Tomaney & Pike, Citation2020), indications are that levelling up will append remedial social infrastructure funding to the existing market-based framework (MacKinnon et al., Citation2022). The evidence presented in this paper suggests that such minor adjustments to the status quo might simply displace the geographical scale at which entrenched structural inequality manifests.
This article supports calls for a more thorough-going rethink of policies predicated, in recent years, on a laissez-faire form of capitalism (Bailey et al., Citation2019). It has identified three main avenues for change. First, it has shown that with supportive policy settings, state-led initiatives to increase public sector employment in diversifying regions can stimulate private sector job creation. Effective regenerative state interventions involve regional planning with long time horizons (Harrison et al., Citation2021). Second, it demonstrates the positive political results of responding to crises with timely local support, rather than austerity measures that demoralise workers and residents in already-disadvantaged places, and which increase socio-spatial inequalities (Fetzer, Citation2019; MacLeod & Jones, Citation2018). Third, it questions the ‘go-to’ response that crises demand more devolution of responsibility and more local-level autonomy and agency in left-behind places. On the contrary, our findings confirm the need to search for efficacious combinations of ‘top-down’ and ‘bottom-up’ initiatives (Crescenzi & Rodríguez-Pose, Citation2011). These would ensure that timely interventions target affected neighbourhoods to both address past injustices and prevent the perpetuation of disadvantage by purposefully building the capabilities of residents.
Finally, if the problems of uneven development in left-behind places are reproduced by ‘conventional’ laissez-faire regional development orthodoxy, then the solution should be to rework the policy framework to prioritise interventions that prevent the exclusion of places, residents and workers. This study suggests that timely, targeted and coordinated place-based interventions can reduce political alienation. Further research could focus on identifying the optimal mix of long-term versus short-term and top-down versus bottom-up initiatives.
ETHICS STATEMENT
Ethics approval for the PhD research project on which this paper is based was received from the University of South Australia’s UniSA Business School Ethics Committee [register number 48/2019] and the Australian Catholic University Human Research Ethics Committee [register number 2018-3E]. Before the interviews, participants were provided with written information that explained the purpose of the research, detailed the format and duration of the interview, outlined foreseeable risks and benefits, and specified how anonymity and confidentiality would be protected. Participants provided informed written consent to participate in the interview, for the interview to be recorded and for de-identified interview data to be published by signing a consent form. Participants also provided verbal consent at the start of each interview.
DISCLOSURE STATEMENT
No potential conflict of interest was reported by the authors.
Additional information
Funding
Notes
1. Maintaining an ‘effective physical barrier’ between Geelong and Melbourne has been a longstanding development priority in Victoria (Geelong Regional Commission, Citation1988, p. 40).
2. ‘New’ Oshawa contains the following 2016 census tracts, which includes 1991 census tracts that were subdivided: 5320016.04, 5320016.03, 5320016.01, 5320015.04, 5320015.03, 5320015.02, 5320009.05, 5320009.03, 5320008.07, 5320008.06 and 5320008.05. ‘Old’ Oshawa comprises the remaining 1991 and 2016 census tracts. These do not represent an exact division between pre-1974 Oshawa and East Whitby as some census tracts overlap.
3. The aggregate statistics may mask the outmigration of the residents of disadvantaged areas that do access secure well-paid jobs, and their replacement by other disadvantaged families attracted to inexpensive housing. However, our examinations of census data suggest that is less of an issue in Geelong than Oshawa.
REFERENCES
- Antink, B. (2019). Our towns have not been ‘left behind’, they have been actively excluded. RSA Blog. 2 May. https://www.thersa.org/discover/publications-and-articles/rsa-blogs/2019/05/left-behind
- Aquanno, S. M., & Bryant, T. (2021). Workplace restructuring and institutional change: GM Oshawa from 1994 to 2019. Studies in Political Economy, 102(1), 25–50. https://doi.org/10.1080/07078552.2021.1901012
- Arndt, H. (1983). The ‘trickle-down’ myth. Economic Development and Cultural Change, 32(1), 1–10. https://doi.org/10.1086/451369
- August, M., & Walks, A. (2018). Gentrification, suburban decline, and the financialization of multifamily rental housing: The case of Toronto. Geoforum, 89, 124–136. https://doi.org/10.1016/j.geoforum.2017.04.011
- Australian Bureau of Statistics (ABS). (1955). Census of population and housing 1954. ABS.
- Australian Bureau of Statistics (ABS). (1987). Census of population and housing 1986. ABS.
- Australian Bureau of Statistics (ABS). (2007). Census of population and housing 2006. ABS.
- Australian Bureau of Statistics (ABS). (2017). Census of population and housing 2016. ABS.
- Australian Bureau of Statistics (ABS). (2018). Census of population and housing: Socio-Economic Indexes for Areas (SEIFA), Australia, 2016. cat. no. 2033.0.55.001. ABS.
- Australian Bureau of Statistics (ABS). (2022). Census of population and housing 2021. ABS.
- Bailey, D., Bentley, G., De Ruyter, A., & Hall, S. (2014). Plant closures and taskforce responses: An analysis of the impact of and policy response to MG Rover in Birmingham. Regional Studies, Regional Science, 1(1), 60–78. https://doi.org/10.1080/21681376.2014.899477
- Bailey, D., Glasmeier, A., & Tomlinson, P. (2019). Industrial policy back on the agenda: Putting industrial policy in its place? Cambridge Journal of Regions, Economy and Society, 12(3), 319–326. https://doi.org/10.1093/cjres/rsz010
- Barnes, T., & Weller, S. (2020). Becoming precarious? Precarious work and life trajectories after retrenchment. Critical Sociology, 45(4–5), 527–541. https://doi.org/10.1177/0896920519896822
- Beer, A. (2015). Structural adjustment programs and regional development in Australia. Local Economy, 30(1), 21–40. https://doi.org/10.1177/0269094214562171
- Bolton, M., Day, R., & Leach, M. (2019). England’s overlooked neighbourhoods: Defining, understanding and regenerating ‘left behind’ communities. Journal of Urban Regeneration & Renewal, 13(2), 116–123. https://www.ingentaconnect.com/content/hsp/jurr/2019/00000013/00000002/art00002?crawler=true&mimetype=application/pdf
- Boschma, R., Coenen, L., Frenken, K., & Truffer, B. (2017). Towards a theory of regional diversification. Regional Studies, 51(1), 31–45. https://doi.org/10.1080/00343404.2016.1258460
- Boswell, J., Denham, J., Furlong, J., Killick, A., Ndugga, P., Rek, B., Ryan, M., & Shipp, J. (2022). Place-based politics and nested deprivation in the U.K. Representation, 58(2), 169–190. https://doi.org/10.1080/00344893.2020.1751258
- Boudreau, J., Hamel, P., Jouve, B., & Keil, R. (2007). New state spaces in Canada: Metropolitanization in Montreal and Toronto compared. Urban Geography, 28(1), 30–53. https://doi.org/10.2747/0272-3638.28.1.30
- Cities Commission. (1973). A recommended new cities programme for the period 1973–1978. Parliament of Australia.
- City of Greater Geelong. (2018). Select major employers: Barwon region.
- Clark, G. L. (1998). Stylized facts and close dialogue: Methodology in economic geography. Annals of the Association of American Geographers, 88(1), 73–87. https://doi.org/10.1111/1467-8306.00085
- Crescenzi, R., & Rodríguez-Pose, A. (2011). Reconciling top-down and bottom-up development policies. Environment and Planning A, 43(4), 773–780. https://doi.org/10.1068/a43492
- Dijkstra, L., Poelman, H., & Rodríguez-Pose, A. (2020). The geography of EU discontent. Regional Studies, 54(6), 737–753. https://doi.org/10.1080/00343404.2019.1654603
- Dyett, G. (2018). Two years on from Ford factory closure, how are workers coping? SBS News, September 15.
- Fairweather, C. (2022). ‘We can’t just wrap ourselves in the flag’: labour nationalism, global solidarity, and the 2016 fight to save GM Oshawa. Journal of Labor and Society, 25(3), 367–394. https://doi.org/10.1163/24714607-bja10040
- Fetzer, T. (2019). Did austerity cause Brexit? American Economic Review, 109(11), 3849–3886. https://doi.org/10.1257/aer.20181164
- Furlong, J. (2019). The changing electoral geography of England and Wales: Varieties of ‘left-behindedness’. Political Geography, 75(2), 102061. https://doi.org/10.1016/j.polgeo.2019.102061
- Gee, M. (2018). A clash of classes: The other side of Oshawa, Ont. The Globe and Mail, July 15.
- Geelong Regional Commission. (1988). Directions: The Geelong region development strategy.
- GMC. (2021). General Motors Oshawa Assembly plant reopens creating thousands of jobs and boosting economic growth (10 November). General Motors Canada. https://media.gm.ca/media/ca/en/gm/home.detail.html/content/Pages/news/ca/en/2021/Nov/1110_oshawa-production.html
- Goodwin, M., & Heath, O. (2016). The 2016 referendum, Brexit and the left behind: An aggregate-level analysis of the result. The Political Quarterly, 87(3), 323–332. https://doi.org/10.1111/1467-923X.12285
- Gordon, I. (2018). In what sense left behind by globalisation? Looking for a less reductionist geography of the populist surge in Europe. Cambridge Journal of Regions, Economy and Society, 11(1), 95–113. https://doi.org/10.1093/cjres/rsx028
- Harrison, J., Galland, D., & Tewdwr-Jones, M. (2021). Whither regional planning? Regional Studies, 55(1), 1–5. https://doi.org/10.1080/00343404.2020.1862412
- Hassink, R., & Kiese, M. (2021). Solving the restructuring problems of (former) old industrial regions with smart specialization? Conceptual thoughts and evidence from the Ruhr. Jahrbuch Für Regionalwissenschaft, 41(2), 131–155. https://doi.org/10.1007/s10037-021-00157-8
- Higgins, B., & Savoie, D. (1994). Comparing Australian and Canadian regional development policy: Lessons for Canada. Canadian Journal of Regional Science, 17(1), 1–22. https://idjs.ca/images/rcsr/archives/V17N1-Higgins-Savoie.pdf
- Hood, M. (1968). Oshawa: Canada’s motor city. McLaughlin Public Library Board.
- Hooghe, L., Marks, G., & Schakel, A. (2010). The rise of regional authority: A comparative study of 42 democracies. Routledge.
- Jennings, W., & Stoker, G. (2019). The divergent dynamics of cities and towns: Geographical polarisation and Brexit. The Political Quarterly, 90(S2), 155–166. https://doi.org/10.1111/1467-923X.12612
- Johnson, L. (2021). From sleepy hollow to winning from second: Identity, autonomy and borrowed size in an Australian urban region. In M. Pendras & C. Williams (Eds.), Secondary cities: Exploring uneven development in dynamic urban regions of the global north (pp. 79–102). Bristol University Press.
- Johnson, L., Weller, S., & Barnes, T. (2021). (Extra) ordinary Geelong: State-led urban regeneration and economic revival. In J. R. Bryson, R. V. Kalafsky, & V. Vanchan (Eds.), Ordinary cities, extraordinary geographies: People, place and space (pp. 85–107). Edward Elgar.
- Leyshon, A. (2021). Economic geography I: Uneven development, ‘left-behind places’ and ‘levelling up’ in a time of crisis. Progress in Human Geography, 45(6), 1678–1691. https://doi.org/10.1177/03091325211011684
- MacKinnon, D., Mepton, L., O’Brien, P., Ormerod, E., Pike, A., & Tomaney, J. (2022). Reframing urban and regional ‘development’ for ‘left behind’ places. Cambridge Journal of Regions, Economy and Society, 15(1), 39–56. https://doi.org/10.1093/cjres/rsab034
- MacLeod, G., & Jones, M. (2018). Explaining ‘Brexit capital’: Uneven development and the austerity state. Space and Polity, 22(2), 111–136. https://doi.org/10.1080/13562576.2018.1535272
- Marchand, Y., Dubé, J., & Breau, S. (2020). Exploring the causes and consequences of regional income inequality in Canada. Economic Geography, 96(2), 83–107. https://doi.org/10.1080/00130095.2020.1715793
- Martin, R., Gardiner, B., Pike, A., Sunley, P., & Tyler, P. (2021). Levelling up left behind places: The scale and nature of the economic and policy challenge. Routledge. https://doi.org/10.4324/9781032244341
- Miles, M. B., & Huberman, A. M. (1994). Qualitative data analysis: An expanded sourcebook. Sage.
- Mill, J. S. (1975/1843). A system of logic. Longman Cheshire.
- O’Toole, E. (2018). Labour and prosper. Erin O’Toole, Member of Parliament for Durham, 4 December, https://erinotoolemp.com/2018/12/04/labour-and-prosper/
- Oxford Consultants for Social Inclusion (OCSI). (2019). Left behind? Understanding communities on the edge. Report for Local Trust Organisation. OCSI.
- Pinheiro, F. L., Balland, P. A., Boschma, R., & Hartmann, D. (2022). The dark side of the geography of innovation: Relatedness, complexity, and regional inequality in Europe. Papers in Evolutionary Economic Geography 22.02. Utrecht University.
- Region of Durham. (2016). Overview report: Health neighbourhoods in Durham.
- Region of Durham. (2019). Business counts: Highlights.
- Rodríguez-Pose, A. (2018). The revenge of the places that don’t matter (and what to do about it). Cambridge Journal of Regions, Economy and Society, 11(1), 189–209. https://doi.org/10.1093/cjres/rsx024
- Rutherford, T., Murray, G., Almond, P., & Pelard, M. (2018). State accumulation projects and inward investment regimes strategies. Regional Studies, 52(4), 572–584. https://doi.org/10.1080/00343404.2017.1346368
- Sergerie, F. (2016). Internal migration in Canada from 2012/2013 to 2014/2015: Report on the demographic situation in Canada (cat. no. 91-209-X). Statistics Canada.
- Siemiatycki, E. (2012). Forced to concede: Permanent restructuring and labour’s place in the north American auto industry. Antipode, 44(2), 453–473. https://doi.org/10.1111/j.1467-8330.2010.00863.x
- Siemiatycki, E. (2013). A smooth ride? From industrial to creative urbanism in Oshawa, Ontario. International Journal of Urban and Regional Research, 37(5), 1766–1784. https://doi.org/10.1111/j.1468-2427.2012.01196.x
- Stanford, J. (2017). Automotive surrender: The demise of industrial policy in the Australian vehicle industry. The Economic and Labour Relations Review, 28(2), 197–217. https://doi.org/10.1177/1035304617709659
- Statistics Canada. (1952). 1951 census.
- Statistics Canada. (1987). 1986 census.
- Statistics Canada. (1992). 1991 census.
- Statistics Canada. (2007). 2006 census.
- Statistics Canada. (2017). 2016 census.
- Statistics Canada. (2022). 2021 census.
- Taylor, Z. (2019). Ontario’s ‘places that don't matter’ send a message: The fault lines dividing the province are getting deeper. Inroads: A Journal of Opinion, 44, 93–99. https://inroadsjournal.ca/ontarios-places-dont-matter-send-message/
- Tierney, J. (2021). Will diversification save regional economies after the exit of automotive production? [PhD thesis]. University of South Australia. https://unisa.alma.exlibrisgroup.com/view/delivery/61USOUTHAUS_INST/12242322200001831
- Tomaney, J. (2018). Economics, democratisation and localism: The lost world of Peter Lee. Renewal: A Journal of Social Democracy, 26, 78–82.
- Tomaney, J., & Pike, A. (2020). Levelling up? The Political Quarterly, 91(1), 43–48. https://doi.org/10.1111/1467-923X.12834
- Toronto Real Estate Board (TREB). (2019). Market watch: October 2019. Toronto Real Estate Board.
- United Way. (2017). The opportunity equation in the greater Toronto area: An update on neighbourhood income inequality and polarization. United Way Toronto & York Region.
- Vanchan, V., Mulhall, R., & Bryson, J. (2018). Repatriation or reshoring of manufacturing to the US and UK: Dynamics and global production networks or from here to there and back again. Growth and Change, 49(1), 97–121. https://doi.org/10.1111/grow.12224
- Victorian Auditor-General. (2019). Outcomes of investing in regional Victoria. Victorian Auditor-General’s Office.
- Victorian Government. (2002). Melbourne 2030.
- Victorian Government. (2010). Victoria’s regional centres: A generation of change – Geelong.
- Victorian Government. (2020). Population and housing in regional Victoria: Trends and policy implications.
- Wacquant, L. (2016). Revisiting territories of relegation: Class, ethnicity and state in the making of advanced marginality. Urban Studies, 53(6), 1077–1088. https://doi.org/10.1177/0042098015613259
- Weller, S. (2017). Fast parallels? Contesting mobile policy technologies. International Journal of Urban and Regional Research, 41(5), 821–837. https://doi.org/10.1111/1468-2427.12545
- Weller, S. (2021). Places that matter: Australia’s crisis intervention framework and voter response. Cambridge Journal of Regions, Economy and Society, 14(3), 529–544. https://doi.org/10.1093/cjres/rsab002
- Weller, S., & Tierney, J. (2017). Evidence in the networked governance of regional decarbonisation: A critical appraisal. Australian Journal of Public Administration, 77(2), 280–293. https://doi.org/10.1111/1467-8500.12244
- Weller, S., & van Hulten, A. (2012). Gentrification and displacement: The effects of a housing crisis on Melbourne's low-income residents. Urban Policy and Research, 30(1), 25–42. https://doi.org/10.1080/08111146.2011.635410
- Yates, C., & Holmes, J. (2019). The future of the Canadian auto industry. Canadian Centre for Policy Alternatives.