
 ?Mathematical formulae have been encoded as MathML and are displayed in this HTML version using MathJax in order to improve their display. Uncheck the box to turn MathJax off. This feature requires Javascript. Click on a formula to zoom.
ABSTRACT
We examine the role of population density and accessibility in shaping innovation intensity in the 32,000 lower super output areas (LSOAs) in England. Our analysis focuses on firms’ registered intellectual property – patents, trademarks and registered designs – and using spatial autoregression models suggests four key results. We find a positive relationship between population density and innovation intensity, a consistent negative relationship between longer journey times to the nearest town centre and innovation intensity, and a strong interaction effect between population density and accessibility. Finally, we find strong evidence of local innovation spillovers reflecting either competition or demonstration effects.
1. INTRODUCTION
Innovation is driven by knowledge: technological, commercial and strategic. However, firms’ and individuals’ ability to access and implement innovation-relevant knowledge is shaped by their own search capabilities, and their ability to access learning opportunities (Keeble & Wilkinson, Citation1999). In any specific locality, learning is also related to knowledge-sharing and -matching (Scott & Storper, Citation2015) and the intensity of local interactions or ‘buzz’ (Storper & Venables, Citation2004). Spatial contrasts in knowledge environments and related learning processes have typically been considered at the scale of cities or regions, but more recent studies have also emphasised the micro-geographies within which innovation takes place. Rammer et al. (Citation2020), for example, examine the knowledge environment for firms in Berlin and demonstrate that knowledge environments differ over distances as short as 50–250 m. These localised learning processes, enabled by spatial proximity, may be enhanced and reinforced by non-local knowledge-sharing opportunities which may enable learning (Hjaltadottir et al., Citation2020) and help avoid local lock-in (Visser & Boschma, Citation2004) through knowledge pipelines (Aarstad et al., Citation2016; Esposito & Rigby, Citation2019; Trippl et al., Citation2009).
These conceptual arguments suggest that levels of innovation will be lower in more sparsely populated and remote areas due to lower levels of local interaction, knowledge exchange, and weaker endogenous and non-local learning processes (Scott & Storper, Citation2015). The empirical evidence for the UK, however, tells a rather different story. Early evidence suggested that rural firms were more likely to be innovating than firms in urban areas, and also more likely to introduce new to the market innovations (Cosh & Hughes, Citation1996). More recent survey evidence for England suggests that the innovation landscape has remained similar in this regard, with generally higher levels of innovative activity in rural than urban areas (Phillipson et al., Citation2019). This may partly reflect a selection of larger and more innovative firms to rural areas, for example, to avoid space constraints and risks of knowledge spillovers in urban areas. For instance, using data on US firms, Alcacer and Chung (Citation2007) find that technologically advanced firms choose areas with high level of academic activity but low levels of industrial activity, thereby maximising inward spillovers and minimising outward spillovers. Similarly, larger firms may avoid co-locating with competitors so that they do not contribute resources that may ultimately benefit competitors in proximate areas (Alcacer & Chung, Citation2010). Nevertheless, where sparse populations confer localised disadvantages in terms of interaction and learning, this may be reinforced if accessibility is limited and therefore access to external learning opportunities is costly (Hansen, Citation1959;Wu et al., Citation2020). Indeed, studies analysing UK firms have found that accessible rural firms are more innovative than those in more remote areas (Keeble & Tyler, Citation1995; North & Smallbone, Citation2000). This type of evidence suggests the potential for (non-linear) reinforcing effects of population density and accessibility on the development potential of remote areas.
Each of these studies of innovation in urban and rural areas in the UK has been based on business survey data. Due to limited sample sizes this often restricts the unit of analysis to be relatively large regions or categories of rural area (Phillipson et al., Citation2019). Here, using data on all UK firms registered intellectual property – patents, trademarks and registered designs – we are able to adopt a granular geographical, population-wide approach to consider the individual and combined impacts of population density and accessibility on innovation in small areas (lower super output areas – LSOAs) in England. For each LSOA we construct indicators of patent, trademark and design intensity which form the dependent variables for our analysis. Patents are often viewed as the first-choice innovation protection instrument, and ‘protect new inventions and cover how products work, what they do, how they do it, what they are made of and how they are made’.Footnote1 Patents are also frequently used as an indicator of innovation, particularly in knowledge-intensive industries, although this approach has often been questioned. Trademarks protect brands, be it a business name, product or service, and have also been used as an innovation indicator (Mendonca et al., Citation2004). A design registration protects the visual appearance of a product, part of a product or its ornamentation, providing it is new and has individual character.Footnote2
We contribute to the literature on the spatial distribution of innovation which has focused mainly on the agglomeration and clustering of innovative activities. Carlino and Kerr (Citation2015) review this literature and note that ‘the substantial majority of theoretical and empirical studies consider single dimension outcomes like patents’ (p. 2), so that most studies ignore the nuances of different types of innovation. Here, we consider not only patents but also registered designs and trademarks, enabling us to incorporate various aspects of intellectual property protection that represent different forms of innovation. Second, much of this literature looks at the geographical concentration of innovation in metropolitan and urban areas (for reviews, see Chatterji et al., Citation2014; and Carlino & Kerr, Citation2015). This paper is one of very few studies to include rural areas (e.g., Roche, Citation2020), helping to deepen our understanding of the local variation in innovation intensity. Third, we complement the literature on worker density and innovation (Carlino et al., Citation2007; Moretti, Citation2004) by considering how population density impacts innovation outcomes in around 32,000 LSOAs in England. Here, conceptual considerations related to buzz suggest we might anticipate a negative relationship (Storper & Venables, Citation2004) although, as indicated above, the empirical evidence for the UK is less clear. Fourth, we consider the role of accessibility – measured by journey time to the nearest town centre – in shaping innovation outcomes in each LSOA. Here, theoretical considerations and the limited empirical evidence are more closely aligned, suggesting that inaccessibility is associated with lower innovation outcomes (Agrawal et al., Citation2017; North & Smallbone, Citation2000). Fifth, using spatial autoregression models we explore the impact of spatial spillovers on innovation arising from population density and innovation in surrounding areas. This builds on typological studies that combine population density and accessibility indicators for individual localities (Copus et al., Citation2008) but provides a more flexible and nuanced framework within which the factors shaping the innovation potential of individual small areas can be considered.
The remainder of the paper is structured as follows. Section 2 briefly reviews the existing literature and develops our hypotheses. Section 3 describes our data sources and empirical approach. Section 4 describes our main results. Section 5 summarises the key findings and considers the implications for policy and future research.
2. CONCEPTUAL DEVELOPMENT
2.1 Population density and accessibility
‘Population density is a quintessentially spatial phenomenon, expressing the way that human beings spread out over, and occupy, the earth … it is a highly significant element in population geography’ (Smailes et al., Citation2002, p. 386). As such, population density, or more accurately sparsity, has often been used to characterise and define ‘rural’ and ‘urban’ areas. The Organisation for Economic Co-operation and Development (OECD) (Citation1994), for example, classified areas (local administrative units) as rural if they had a population density below 150 people/km2.Footnote3 As Dijkstra and Poelman (Citation2008) suggest, however, this type of one-dimensional approach to categorising geographies has the advantage of simplicity but does not capture accessibility or the proximity of any area to local cities or population centres (Fertner, Citation2012). This is, however, reflected in the urban–rural classification standardly used in the UK which uses population density in the immediate and surrounding areas to generate a two-dimensional classification reflecting both local population density as well as population density in surround areas.Footnote4
Accessibility, as usually defined, reflects the distribution of destinations around a particular place, the ease with which those destinations can be reached by various modes, and the amount and character of the activity found there (Handy, Citation2020). Typically, ‘studies develop the hypothesis that accessibility is inversely correlated with the rurality of a place’ (Caschili et al., Citation2015, p. 98). Handy (Citation2020) goes on to argue for the importance of accessibility as an analytical and planning tool as it provides ‘an indication of the potential of opportunities for interaction’ (Hansen, Citation1959, p. 73), and the potential for individuals to benefit from the sharing, matching and learning which define the benefits of agglomeration (Scott & Storper, Citation2015). Notions of accessibility have played an important role in the planning literature offering a ‘direct link between the characteristics of flows and the characteristics of places’ (Papa et al., Citation2016, p. 58).
More recent spatial classifications have integrated accessibility indicators with measures of population density to reflect the diversity of urban and rural areas. Dijkstra and Poelman (Citation2008), for example, in a study of remote rural regions (at the NUTS-3 level) extend the 1996 OECD classification to include distance to the nearest city: ‘A region is labelled ‘remote’ if at least half of its population lives at more than 45 min by road from any city of at least 50,000 inhabitants’ (Dijkstra & Poelman, Citation2008, p. 4).Footnote5 Another similar typology combined measures of economic density with a range of accessibility measures based on drive time to cities of different sizes, although these were found to be strongly correlated (van Eupen et al., Citation2012). Other studies have exploited the continuity of accessibility indicators making use of them as part of a statistical approach to regional classification. In one of earliest studies, Cloke (Citation1977) considered nine demographic and accessibility indicators and using principal components analysis (PCA) analysis divided areas of England and Wales into four categories: extreme rural, intermediate rural, intermediate non-rural and extreme non-rural.Footnote6 Harrington and O’Donoghue (Citation1998) estimate an updated version of the Cloke (Citation1977) index for the 1981 and 1991 census years based on a similar set of measures and PCA analysis. They find very stable loadings on the different variables included in the analysis and conclude overall that ‘a comparison of the 1981 and 1991 rurality indices identifies the largely static nature of rurality over the decade’ (Harrington & O’Donoghue, Citation1998, p. 185).Footnote7 More recently, Hedlund (Citation2016) follows Cloke (Citation1977) using cluster analysis to combine information from a number of labour market and demographic indicators to create a typology of areas in rural Sweden.Footnote8
2.2. Hypotheses
Collective learning provides the basis for localities’ ability to generate innovation and local competitive advantage (Keeble & Wilkinson, Citation1999). Central to this is the notion that face-to-face contact remains critical in facilitating knowledge exchange, particularly where ideas are emergent, exploratory or tacit (Arentze et al., Citation2012; Storper & Venables, Citation2004). Scott and Storper (Citation2015), for example, emphasise the role of agglomeration – reflected in higher population densities – as the source of cities’ key economic advantages in knowledge-sharing, -matching and -learning:
Sharing refers to dense local interlinkages within production systems as well as to indivisibilities that make it necessary to supply some kinds of urban services as public goods. Matching refers to the process of pairing people and jobs, a process that is greatly facilitated where large local pools of firms and workers exist. Learning refers to the dense formal and informal information flows (which tend to stimulate innovation) that are made possible by agglomeration and that in turn reinforce agglomeration.
Previous studies have also demonstrated that levels of interaction are positively related to population density, although this link is not uniform among members of a population or between locations (van den Berg et al., Citation2014). On balance, we suggest that higher levels of population density should be associated with stronger innovation outcomes, since high population density and agglomeration may provide greater opportunities for collective learning through face-to-face interactions, knowledge-sharing and skills-matching:
Hypothesis 1: Local interaction – Higher levels of population density will be associated with stronger innovation outcomes.
Hypothesis 2: Opportunities for proximate interaction – Accessibility will be associated with stronger innovation outcomes.
if local buzz and global pipelines have positive performance effects, and we in addition observe a positive interaction effect, we can deduce that the effect of the two concepts is multiplicative. … If local buzz and global pipelines have positive performance effects, but there is no interaction effect, we can deduce that the two concepts do not have a multiplicative effect, but instead have an additive effect. … Finally, if local buzz and global pipelines have positive performance effects, but we also observe a negative interaction effect, we may deduce that the two concepts merely substitute for each other.
Hypothesis 3: Reinforcing effects – Population density and accessibility effects will be interrelated in terms of their influence on innovation outcomes.
Spillovers can occur through different mechanisms related to aspects of the innovation process itself or through innovation outcomes. For example, process externalities may arise due to interfirm collaboration or openness in the innovation process (Roper et al., Citation2013) and may be more significant in sectors or technologies which have the characteristics of a public good and/or sectors which are more densely networked (Kovacs et al., Citation2006). In knowledge intensive services in particular knowledge is often tacit or situational rather than codified emphasising the importance of face-to-face interaction and spatial proximity. Similar considerations may apply to the diffusion of tacit knowledge in emerging sectors or technology domains (Asheim et al., Citation2007). Localised innovation outcome externalities relate largely to emulation or competitiveness mechanisms. Innovation by one firm may, for example, generate a demonstration effect, stimulating innovation in other local firms even where firms are not competitors (Rao & Kishore, Citation2010). Where firms are direct competitors, innovation by one firm may stimulate innovation in competitors as a strategic or defensive response. Both innovation output and process spillovers will operate in the same direction – higher levels of innovative activity in adjacent areas would be expected to generate positive local spillovers. Another reinforcing mechanism which may reflect positive spillovers relates to the potential movement of firms into areas which have specific innovation advantages. Cornish (Citation1997), for example, demonstrates the value of proximity in helping producers access information about consumers, while the agglomeration advantages of urban locations for innovation have been widely discussed (Arentze et al., Citation2012; Storper & Venables, Citation2004). Other recent studies have suggested the potential innovation advantages of rural areas in reducing knowledge leakage and providing lower cost labour and premises (Eder & Trippl, Citation2019). Together these mechanisms suggest our fourth hypothesis:
Hypothesis 4: Spatial spillovers:
Hypothesis 4a: Higher levels of population density and local interaction will generate positive spillovers on innovation outcomes in adjacent areas.
Hypothesis 4b: Higher levels of innovation activity will generate positive spillovers on innovation outcomes in adjacent areas.
3. DATA AND METHODS
Our objective here is to explore variations in innovation intensity at a high level of spatial granularity following other recent studies of the local geography of innovation most notably Rammer et al. (Citation2020). This substantive aspiration had to be balanced by practical considerations related to the availability of relevant independent and control variables. A review of data availability from the Office of National Statistics (ONS), etc. suggested (LSOAs) LSOAs as the most spatially disaggregated level at which population density, accessibility and other control variables were available. This level of granularity is in contrast to much of the literature on the spatial dimension of innovation which tend to focus on regions or states (e.g., Agrawal et al., 2017; Furkova, Citation2019; Anselin et al., Citation1997; Roche, Citation2020). Using LSOAs enables us to uncover the influences of special opportunities for interactions in local environments, such as coincidental contacts and learning through observing the activities of neighbouring innovative actors. This view is consistent with the few studies that have examined knowledge flows at more disaggregated spatial scale (Lin et al., Citation2007; Rammer et al., Citation2020). Using LSOAs however presents a number of challenges. For example, data (on journey times, for example) is not consistently available for areas outside England, limiting the geographical scope of our analysis. Nevertheless, LSOA-level data have been widely used in studies of health (Currie et al., Citation2022), deprivation (Murray et al., Citation2021) and domestic abuse (Weir, Citation2019) but, due to data limitations, not previously in studies of innovation (see below).
3.1. Dependent variables – innovation
We measure innovation activity among businesses in each LSOA using three variables relating to patent intensity, trademark intensity and registered design intensity. These intellectual property measures have the advantage of being population indicators (i.e., available for all members of the business population in each area) and therefore a robust indicator of innovation activity in each locality. More typical survey-based measures of innovation, derived for example from the UK Innovation Survey, do provide a more direct indication of firms’ innovative activity but sample sizes limit the geographical specificity at which meaningful analyses can be constructed. More broadly, the limitations of patents as a measure of innovation have been widely discussed with a focus on their limited sectoral applicability (Turner & Roper, 2020). Here, we mitigate these concerns by also considering trademarks and registered designs both of which are widely used across sectors.
In constructing our dependent variables we follow standard OECD practice, measures are defined as the count of live patents, trademarks and registered designs per 10,000 members of the working-age population (Tinguely, Citation2013). Data on individual patents granted and trademarks was provided by the Intellectual Property Office (IPO). For the analysis here, we derived the number of live patents, trademarks and registered designs associated with each company (CRN) for each year during the period 2011–17.Footnote10
Due to incomplete company address details, postcodes were matched to CRNs using Companies House data for live businesses, with the batch search facility in FAME (Financial Analysis Made Easy) used for those firms which had ceased trading.Footnote11 Of the 82,989 companies originally identified as holding either live patents, trademarks and registered designs during the 2011–17 period, it proved possible to identify postcodes for 81,806 (98.6%). Postcodes were matched to LSOAs using the 2019 Postcode Directory with a 100% match being achieved.Footnote12 The patent, trademark and registered design holdings of firms within each LSOA were aggregated to give the total number of patents, trademarks and registered designs held by firms in each LSOA in each year. These were then divided by the working-age population for each LSOA, derived from the Annual Population Survey and accessed through the National On-line Manpower Information System (NOMIS),Footnote13 to give the final intensity measures for each year.
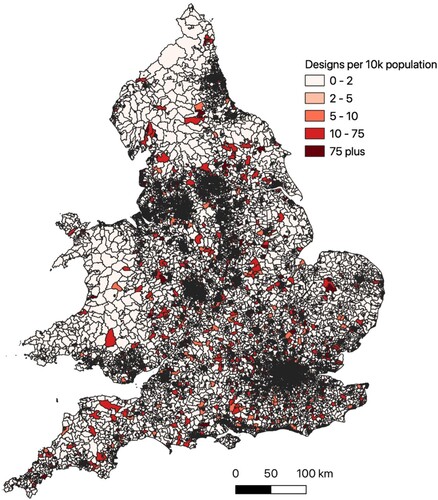
Appendix A in the supplemental data online provides descriptive statistics for all variables used in our analysis (see Table A1 online).Footnote14 In 2017, average patent intensity was 1.65 patents per 10,000 members of the working-age population (see Table A1), although this varied widely between local areas (). Trademark intensity was higher on average in 2017 (37.64 per 10,000 working-age population) and this is also reflected in trademarks’ wider geographical distribution (). The lower number of registered designs (3.83 per 10,000 working-age population) is also reflected in a more uneven geographical distribution ().
Figure 1. Patent intensity by lower super output area (LSOA), 2017.
Notes: Patents per 10,000 working-age population in each LSOA. Readers of the print article can view the figures in colour online at https://doi.org/10.1080/00343404.2023.2252900
Sources: Patents data are from the Intellectual Property Office (IPO) (see the text for derivation); working population data are from the National On-line Manpower Information System (NOMIS).
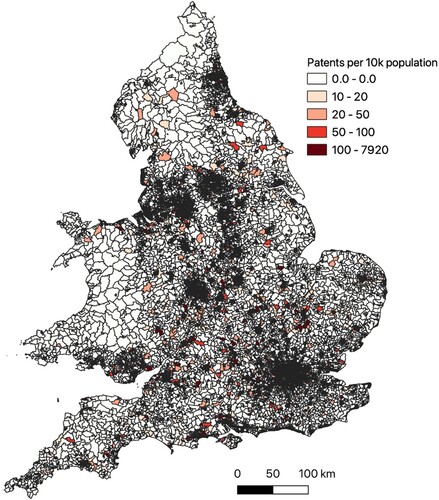
Figure 2. Trademark intensity by lower super output area (LSOA), 2017.
Note: Trademarks are per 10,000 working population in each LSOA.
Sources: Trademark data are from the Intellectual Property Office (IPO) (see the text for derivation); working population data are from the National On-line Manpower Information System (NOMIS).
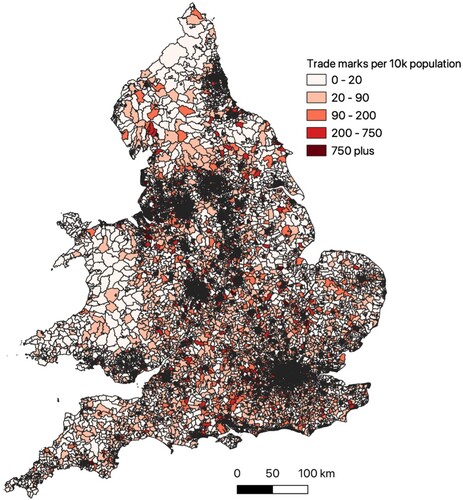
Figure 3. Registered design intensity by lower super output area (LSOA), 2017.
Note: Registered designs are per 10,000 working population in each LSOA.
Sources: Designs data are from the Intellectual Property Office (IPO) (see the text for derivation); working population data are from the National On-line Manpower Information System (NOMIS).
3.2. Independent variables – population density and accessibility
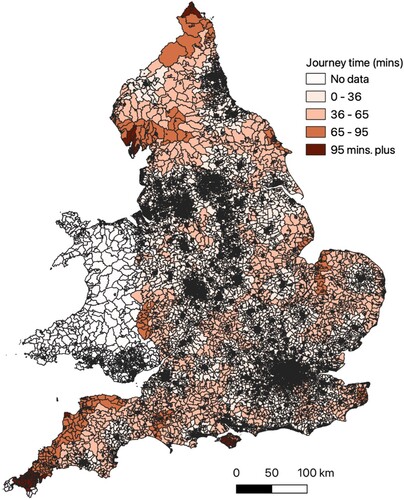
We focus on two key independent variables: population density and accessibility measured by minimum journey time to the nearest town centre. Population density (persons/km2) measured mid-year in 2015 for each LSOA in England is taken from the ONS mid-year population estimates (table SAPE20DT11). Mean population density in 2015 across LSOAs was 3032 persons/km2 (see Table A1 in Appendix A in the supplemental data online). Unsurprisingly population density closely reflects the urban geography of the UK (). To reflect the potential for alternative modes of transport in urban and more rural areas, journey time is measured using the minimum value of two measures, both calculated by the Department of Transport: (1) average travel time (min) by car to the nearest town centre for each LSOA in 2015; and (2) average travel time (min) by public transport to the nearest town centre.Footnote15 Town centres themselves were identified from the ‘English Town Centres 2004’ project undertaken for the Ministry of Housing, Communities and Local Government (Cheshire et al., Citation2017).Footnote16 Average minimum journey time to the nearest town centre by car or public transport in 2015 was 26.2 min (see Table A1 online), although this varied widely between localities ().
Figure 4. Population density (persons/km2) by lower super output area (LSOA), 2015.
Source: Office of National Statistics (ONS).
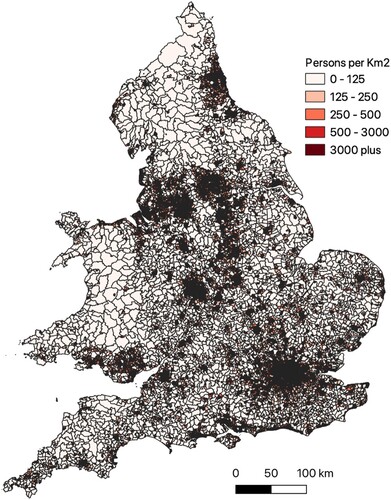
Figure 5. Multi-mode journey time to the nearest town centre, 2015.
Note: Values are the shortest journey time (min) by car or public transport to nearest town centre in 2015. No data are available for Wales or for areas where the journey time is greater than 120 min.
Source: Department of Transport.
3.3. Control variables
Here, we use three sets of control variables available at the LSOA level: (1) variables derived from the English Index of Multiple Deprivation (IMD) for 2015 to reflect specific local disadvantages (Smith et al., Citation2015); (2) variables to reflect local employment composition; and (3) the employment rate to reflect local labour market conditions. The seven domains of the IMD 2015 for each LSOA are themselves based on a basket of indicators, largely measured in 2012–13 (Smith et al., Citation2015).Footnote17 We use five (of the seven) domain scores as control variables relating to: Education, Skills and training; Heath deprivation and disability; Crime; Barriers to housing and services; and the Living environment. Finally, to reflect local labour market conditions and job availability, we include the employment rate (i.e., the percentage of the working-age population which are economically active).
3.4. Empirical approach
We approach our estimation in three logical stages. First, we estimate a baseline aggregate model at the national level but with regional fixed effects (see Table B1 in Appendix B in the supplemental data online). Here, each model relates one of our three innovation indicators in 2017 to population density and accessibility in 2015, and control variables for 2015. The models in Table B1 online emphasise the anticipated density and accessibility effects, but crucially show significant regional differences, suggesting the value of also considering regional models. These regional models thus constitute the second stage of our estimation (see Tables B2–B4 online), again lending support to the anticipated density and accessibility effects.
We then undertake Moran tests for spatial autocorrelation in the errors (Bivand & Wong, Citation2018). Two alternative forms of this test are considered relating first to areas immediately adjacent to the focal area, and second, to immediately adjacent and areas once removed from the focal area. In each case adjacent areas are considered to be those which share either a boundary or boundary corner with the focal area. Results are presented in Table B5 in Appendix B in the supplemental data online. Across regions and the three alternative innovation intensity measures we see strong evidence of spatial autocorrelation, suggesting the potential significance of the spatial spillover effects. Spatial autoregressive (SAR) models are thus estimated allowing for spatial autocorrelation related to both population density and each innovation indicator, i.e.:
(1)
(1) where PDENit is population density, JTit is accessibility, CONTit is the set of control variables and ϵit is the error term. Wj is the spatial weight matrix based on the distance between the focal area, adjacent and once-removed areas. LSOAs are the unit of analysis and we allow for a time difference between measuring dependent and independent variables. Equations are estimated in log–log form meaning that marginal effects can be interpreted as elasticities. Models include squared terms to capture any non-linear effects, an interaction effect to capture the potential for reinforcing density-accessibility effects and the control variables outlined above.
4. EMPIRICAL RESULTS
Coefficients on population density, journey time and their interaction in the SAR models confirm support for Hypothesis 1–3 across each of the innovation outcome measures (). For brevity we do not include control variables; full regression tables are presented in Tables C1–C3 in Appendix C in the supplemental data online.
For patents (), population density effects vary somewhat between regions, but where effects are significant the equation coefficients suggest that population density has an inverted ‘U’-shape association with innovation intensity, that is, as density initially increases so too does innovation intensity although the marginal impact of density on innovation intensity falls as density itself increases. Essentially similar results are evident for the association of population density with local trademark intensity () and design intensity (). Taken together, this evidence provides support for Hypothesis 1, which posits a positive relationship between population density and local innovation outcomes particularly at lower levels of population density. It is interesting to note the heterogeneity of population density effects across regions for different innovation outcomes, with London for example having no significant population density effects across innovation outcomes. However, our aggregate national level model with regional fixed effects (see Table B1 in Appendix B in the supplemental data online) captures the overall effect of population density on innovation outcomes across regions; this model also points to a strong inverted ‘U’-shaped relationship between population density and all three innovation outcomes.
Table 1. Spatial autoregressive (SAR) models for patent intensity and related diagnostics.
Table 2. SAR models for trademark intensity and diagnostic material.
Table 3. SAR models for registered design intensity and diagnostic material.
Minimum journey time effects on innovation outcomes also vary somewhat between regions but, where they are significant, equation coefficients also suggest a ‘U’-shaped association, that is, an increase in minimum journey time is associated with a decrease in innovation intensity although the strength of the association decreases as minimum journey time itself increases. This pattern of journey time effect on innovation intensity is largely consistent across patents (), trademarks () and registered designs (), although again there is heterogeneity across regions. As with population density, the average effect across regions is consistent with an inverted ‘U’-shaped relationship for all three innovation outcomes (see Table B1 in Appendix B in the supplemental data online). Taken together, this provides support for Hypothesis 2, with the negative coefficient of minimum journey time reflecting a positive link between accessibility and local innovation outcomes.
Hypothesis 3 relates to the potential interaction effect of population density and accessibility. Estimated interaction effects are positive and strongly significant across many of the estimated models for patents (), trademarks () and registered designs (). For given journey time, the positive interaction term reinforces the link between population density and innovation intensity. The multiplicative nature of the interaction term means that this population density effect is stronger where journey time is greater, that is, in more remote rural areas. Conversely, for a given population density, the positive interaction effect offsets the negative effect of longer journey times. The multiplicative nature of the interaction term means that this offsetting effect is weaker in localities where population density is lower. This provides strong support for Hypothesis 3 which suggests the reinforcing effects of sparsity and accessibility on innovation outcomes, a relationship which will exacerbate differences in innovation outcomes between urban areas and more remote rural areas. As with the main effects of population density and accessibility, the effects of the interaction term is heterogeneous across regions and innovation outcomes although the overall effects continue to be positive (see Table B1 in Appendix B in the supplemental data online).
For Hypotheses 1–3, we check the robustness of our models to using categorical variables to delineate high and low levels of population density and journey times within the aggregate model (see Table B6 in Appendix B in the supplemental data online). The results remain broadly consistent with an inverted ‘U’-shaped relationship between population density and innovation outcomes, where density is associated with greater innovation only at very low levels of density. The effects of accessibility on innovation are also consistent with an inverted ‘U’-shaped relationship. The coefficients on the interaction terms are consistent with a greater benefit of accessibility in sparsely populated areas.
Hypothesis 4 relates to the potential for spatial spillover effects on innovation outcomes which arise either from high population density in other adjacent areas (Hypothesis 4a) or adjacent innovation outcomes in previous periods (Hypothesis 4b). Evidence for Hypothesis 4 and the significance of spillovers related to density and innovation is provided by the SAR coefficients in . In each of the SAR models we see strong evidence from the Wald tests of the spatial autocorrelation terms. However, across the innovation indicators we see little consistent support for the hypothesised positive spillover effect from population density in adjacent LSOAs (Hypothesis 4a). Conversely, we find strong and consistent support for positive innovation spillovers across almost all regions and across each of the innovation outcome measures (Hypothesis 4b).
In terms of the control variables, elements of the IMD vary in sign and are largely insignificant (see Tables C1–C3 in Appendix C in the supplemental data online). A notable exception is the ‘Environment’ element of the IMD which has a consistently positive and significant relationship to innovation intensity across all models. The implication is that higher levels of deprivation in terms of Environment are associated with higher levels of innovation intensity. The Environment element of the IMD is itself based on measures of housing quality, air pollution and traffic accidents all of which may be associated more strongly with urban environments, and population density.Footnote18 This result reinforces the innovation advantages of more densely populated areas suggested by support for Hypothesis 1 even where housing and environmental quality are poorer. Other control variables have consistent effects, with Manufacturing and Business Services positively associated with innovation intensity across all regions (). Employment rates prove largely insignificant.
5. DISCUSSION
We provide a detailed spatial distribution of innovation across England using new local area (LSAO) statistics for patent, trademark and design intensity. Our analysis extends previous geographical analyses of innovation in urban environments (Rammer et al., Citation2020), and suggests four key results. First, population density is positively associated with innovation intensity until beyond a certain point the innovation benefits of population density start to decrease. This finding is consistent with theoretical perspectives which suggest that the extent of interaction in a locality or ‘buzz’ (Storper & Venables, Citation2004) – itself related non-linearly to population density – is positively related to innovation intensity (Lawson & Lorenz, Citation1999; Scott & Storper, Citation2015). Second, and again supporting theoretical arguments relative to the value of accessibility in enabling interaction beyond the bounds of any locality (Hansen, Citation1959; Scott & Storper, Citation2015; Wachs & Kumagai, Citation1973), we find a consistent negative association between minimum journey time to the nearest town centre and local innovation intensity.
Third, we find strong interaction effects between population density and accessibility. This suggests that the effect of a marginal difference in population density on innovation intensity depends strongly on the accessibility of any locality, and vice versa. Population density or sparsity effects are therefore amplified where journey time is greater, that is, in more remote areas. Conversely, for a given population density, the positive interaction effect offsets the negative effect of longer journey times, an effect which is stronger where population density is high. These effects both emphasise the compounding impact of accessibility and low population density on innovation intensity in more remote rural areas (Keeble & Tyler, Citation1995; North & Smallbone, Citation2000; Phillipson et al., Citation2019). Fourth, we find strong evidence of local innovation spillovers from other adjacent areas. More specifically, levels of innovation intensity in adjacent LSOAs two years previously have positive spillover effects on current innovation intensity. Conceptual arguments suggest that these innovation spillovers may relate either to competitive responses to other firms’ innovation by local firms or demonstration effects which may occur whether or not firms are direct competitors (Rao & Kishore, Citation2010).
Previous analyses have suggested the diversity of local innovation performance across Local Enterprise Partnership (LEP) areas in England (Roper et al., Citation2015). Our results here emphasise the more localised impacts of population density and accessibility as partial explanatory factors for innovation intensity across England, and the compounding effects of these effects in sparsely populated and less accessible localities. Our evidence on innovation spillovers also suggests the potential for more innovative areas to develop a cumulative advantage over time, an effect which may reinforce the differential effects of density and accessibility. From a policy standpoint, measures to change population density in specific localities are only feasible in the medium to long-term. Measures to promote accessibility and the associated knowledge-sharing and innovation through reduced journey times are more feasible in the short to medium term and may yield significant social benefits in terms of innovation (Chatman & Noland, Citation2011). Innovation in compact cities, for example, may benefit from the advantages of agglomeration while minimising the disadvantages associated with inaccessibility (Hamidi et al., Citation2019). For more rural areas, particularly remote rural areas, our results suggest the importance of positive attempts to increase local interactions and knowledge-sharing as well as strengthening access to more distant knowledge-sharing opportunities. For example, while the innovation benefits of improved transport systems have long been emphasised (e.g., Mahroum et al., Citation2007) our evidence suggests that significant accessibility gaps remain even within England, and that these act to reduce innovation intensity, particularly in remote rural areas where population density is lowest. Promoting local knowledge-sharing in such areas through innovation hubs or co-working spaces may benefit innovation outcomes. Gandini and Cossu (Citation2019, p. 14), for example, in their case study of RuralHub, a co-working space near Salerno in Italy, comment that ‘it fosters the learning and sharing of innovative practices … and an environment whereby participants can develop projects that involve local rural communities’.
6. CONCLUSIONS
Innovation intensity, which previous studies have strongly linked to local growth and productivity outcomes, varies widely across England. Our results suggest that population density and accessibility play a significant and interlinked role in shaping local innovation outcomes. Moreover, through localised innovation spillovers these spatial innovation outcomes can become reinforcing, exacerbating differences between localities. This suggests four contributors to rural disadvantages in terms of innovation. First, rural areas are likely to have lower levels of population density and therefore knowledge-sharing and resulting innovation. Second, accessibility issues may reduce the opportunities for those based in rural areas to access knowledge and potential learning opportunities in the nearest urban centres. Third, accessibility and density effects are interrelated, with each exacerbating the effect of the other on levels of innovation. Finally, innovation itself generates positive local spillovers which may further exaggerate differences in innovation outcomes between densely populated, accessible areas and more sparsely populated and less accessible areas. Countering these rural innovation disadvantages presents significant challenges but co-working spaces and rural knowledge hubs may present opportunities for enhanced local learning and innovation.
The analysis we present is subject to a number of limitations, some of which suggest avenues for future research. First, our data is essentially cross-sectional and so at the moment we are observing correlations rather than causation. It may be possible in the future to develop a more longitudinal perspective but the slow evolution of our two key explanatory variables for any locality creates significant challenges in establishing causality. However, differences in innovation trajectories related to local policy differences or interventions could be explored to consider ‘what works’ in addressing rural or other localised innovation disadvantages. Second, our analysis focuses on firms’ holdings of intellectual property as an innovation indictor. These population indicators provide the key to our spatial analysis but provide only a partial view of firms’ innovation activity. It tells us nothing, for example, about the economic value of firms’ innovation activity or their innovation returns. Allocation effects may also be important where intellectual property holdings are concentrated in firms’ headquarters, a geography which may be different to that of the invention itself. Our use of holding of intellectual property also focuses attention on areas’ cumulative stocks of knowledge. A complementary analysis could usefully focus on areas’ current innovation outcomes which are likely to depend on a balance of local, sectoral and cyclical factors. Finally, our focus is on intellectual property held only by firms. Other organisations such as public sector bodies, universities, colleges may also hold intellectual property and for the moment these are excluded from our analysis. Future work could usefully include these other innovation ecosystem actors both as innovators in their own right but also as potential contributors to the innovation outcomes of co-located firms (Rammer et al., Citation2020).
Supplemental Material
Download PDF (588.5 KB)ACKNOWLEDGEMENTS
We are grateful to the Intellectual Property Office (IPO) for providing the patents, trademarks and design data on which this analysis is based. Valuable comments were received from two reviewers and the editor.
DATA AVAILABILITY
The statistical data used here are from the Office of National Statistics (ONS) and are Crown copyright and reproduced with the permission of the controller of HMSO and the Queen’s Printer for Scotland. The use of the ONS statistical data in this work does not imply the endorsement of the ONS in relation to the interpretation or analysis of the statistical data. The analysis upon which this paper is based uses research datasets that may not exactly reproduce National Statistics aggregates.
DISCLOSURE STATEMENT
No potential conflict of interest was reported by the authors.
Additional information
Funding
Notes
2. Confusion sometimes arises between the protection offered by a design registration and that offered by a patent: a design registration protects the visual appearance of a product whereas a patent protects a technical product and how it functions.
3. Regions were then classified as ‘rural’ if more than 50% of the population lives in rural local administrative units; ‘intermediate’ if between 15% and 50% lives in rural local units; and ‘urban’ if fewer than 15% lives in rural local units. See Martinovic and Ratkaj (Citation2015) for a recent application of the OECD approach based on population density to the case of Serbia.
5. The Dijkstra and Poelman (Citation2008) typology creates five groups of NUTS-3 regions: urban regions; intermediate regions close to a city; intermediate remote regions; rural regions close to a city; and rural, remote regions.
6. Cloke (Citation1977) used population change, household amenities, population of women of working age, commuting-out pattern, in-migration, population density, population over 65, distance from 50,000 plus urban node and employment in the primary sector.
7. Perhaps more interesting is that Harrington and O’Donoghue (Citation1998) also consider the potential for a two-dimensional index of rurality differentiating between demographic and structural dimensions long in advance of similar analysis by van Eupen et al. (Citation2012).
8. The five cluster categories are named: Middle-class countryside within the urban shadow; Working class countryside within the urban shadow; Countryside outside the urban shadow; Manufacturing periphery; and Resource periphery (Hedlund, Citation2016, tab 2, p. 466).
9. Here we focus on geographical proximity, but cognitive or cultural proximity may also be important in shaping the intensity and value of interaction (Boschma, Citation2005).
10. An IP protection mechanism is assumed to exist for a particular CRN during a given year if it is available to that CRN for more than six months in that given year.
13. See https://www.nomisweb.co.uk/
14. Appendix A online also provides details of variable definitions (in Table A2) and the correlation matrix (in Table A3).
18. The correlation between the environment element of the IMD and population density (0.439) is notably higher than that between population density and any other element of the IMD (see Table A3 in Appendix A in the supplemental data online).
REFERENCES
- Aarstad, J., Kvitastein, O. A., & Jakobsen, S. E. (2016). Local buzz, global pipelines, or simply too much buzz? A critical study. Geoforum; Journal of Physical, Human, and Regional Geosciences, 75, 129–133. https://doi.org/10.1016/j.geoforum.2016.07.009
- Acs, Z., Audretsch, D. B., & Feldman, M. P. (1992). Real effects of academic research – A comment. American Economic Review, 82(1), 363–367.
- Adams, J. D. (1990). Fundamental stocks of knowledge and productivity growth. Journal of Political Economy, 98(4), 673–702. https://doi.org/10.1086/261702
- Adams, J. D. (1993). Science, R&D and invention potential recharge: US evidence. American Economic Journal, 83(2), 458–462.
- Agrawal, A., Galasso, A., & Oettl, A. (2017). Roads and innovation. Review of Economics and Statistics, 99(3), 417–434. https://doi.org/10.1162/REST_a_00619
- Alcacer, J., & Chung, W. (2007). Location strategies and knowledge spillovers. Management Science, 53(5), 760–776. https://doi.org/10.1287/mnsc.1060.0637
- Alcacer, J., & Chung, W. (2010). Location strategies for agglomeration economies (Working Paper No. 10-071:06-144). Harvard Business School Strategy Unit.
- Andersson, M., & Karlsson, C. (2004). The role of accessibility for regional innovation systems. In Karlsson, C., Flensburg, P., & Hortes, A. (Eds.), Knowledge spillovers and knowledge management (pp. 283–310). Edward Elgar.
- Anselin, L., Varga, A., & Acs, Z. (1997). Local geographic spillovers between university research and high technology innovations. Journal of Urban Economics, 42(3), 422–448. https://doi.org/10.1006/juec.1997.2032
- Anselin, L., Varga, A., & Acs, Z. (2000). Geographic and sectoral characteristics of academic knowledge externalities. Papers in Regional Science, 79(4), 435–443. https://doi.org/10.1007/PL00011486
- Arentze, T., van den Berg, P., & Timmermans, H. (2012). Modeling social networks in geographic space: Approach and empirical application. Environment and Planning A – Economy and Space, 44(5), 1101–1120. https://doi.org/10.1068/a4438
- Arundel, A. M., & Geuna, A. (2004). Proximity and the use of public science by innovative European firms. Economics of Innovation and New Technology, 13(6), 559–580. https://doi.org/10.1080/1043859092000234311
- Asheim, B., Coenen, L., & Vang, J. (2007). Face-to-face, buzz, and knowledge bases: Sociospatial implications for learning, innovation, and innovation policy. Environment and Planning C: Government and Policy, 25(5), 655–670. https://doi.org/10.1068/c0648
- Audretsch, D. B., & Feldman, M. (1996). R&D spillovers and the geography of innovation and production. American Economic Journal, 86(3), 630–640.
- Bathelt, H., Malmberg, A., & Maskell, P. (2004). Clusters and knowledge: Local buzz, global pipelines and the process of knowledge creation. Progress in Human Geography, 28(1), 31–56. https://doi.org/10.1191/0309132504ph469oa
- Bivand, R. S., & Wong, D. W. S. (2018). Comparing implementations of global and local indicators of spatial association. TEST, 27(3), 716–748. https://doi.org/10.1007/s11749-018-0599-x
- Boschma, R. A. (2005). Proximity and innovation: A critical assessment. Regional Studies, 39(1), 61-74.
- Carlino, G. A., Chatterjee, S., & Hunt, R. M. (2007). Urban density and the rate of invention. Journal of Urban Economics, 61(3), 389–419. https://doi.org/10.1016/j.jue.2006.08.003
- Carlino, G., & Kerr, W. R. (2015). Agglomeration and innovation. Handbook of Regional and Urban Economics, 5, 349–404. https://doi.org/10.1016/B978-0-444-59517-1.00006-4
- Caschili, S., De Montis, A., & Trogu, D. (2015). Accessibility and rurality indicators for regional development. Computers, Environment and Urban Systems, 49, 98–114. https://doi.org/10.1016/j.compenvurbsys.2014.05.005
- Chatman, D. G., & Noland, R. B. (2011). Do public transport improvements increase agglomeration economies? A review of literature and an agenda for research. Transport Reviews, 31(6), 725–742. doi:10.1080/01441647.2011.587908
- Chatterji, A., Glaeser, E., & Kerr, W. (2014). Clusters of entrepreneurship and innovation. Innovation Policy and the Economy, 14(1), 129–166. https://doi.org/10.1086/674023
- Cheshire, P., Hilber, C., Montebruno, P., & Sanchis-Guarner, R., (2017). Using micro-geography data to identify town centre space in Great Britain (Spatial Economics Research Centre Discussion Papers No. 0213). Centre for Economic Performance, LSE.
- Cloke, P. J. (1977). Index of rurality for England and Wales. Regional Studies, 11(1), 31-46.
- Copus, A. K., Psaltopuulos, D., Skuras, D., Terluin, I., & Weingarten, P. (2008). Approaches to rural typology in the European Union. Office for Official Publications of the European Communities.
- Cornish, S. L. (1997). Product innovation and the spatial dynamics of market intelligence: Does proximity to markets matter? Economic Geography, 73(2), 143–165. https://doi.org/10.2307/144445
- Cosh, A., & Hughes, A. (1996). The changing state of British enterprise: Growth innovation and competitive advantage in small and medium sized firms 1986–95. University of Cambridge ESRC Centre for Business Research.
- Currie, C., Stone, S., Pearce, M., Landes, D., & Durham, J. (2022). Urgent dental care use in the North East and Cumbria: Predicting repeat attendance. British Dental Journal, 232(3), 164–171. https://doi.org/10.1038/s41415-022-3886-6
- Dijkstra, L., & Poelman, H. (2008). Remote rural regions: How proximity to a city influences the performance of rural regions (DG Regional Policy Paper: Regional Focus). European Commission.
- Eder, J., & Trippl, M. (2019). Innovation in the periphery: Compensation and exploitation strategies. Growth and Change, 50(4), 1511–1531. https://doi.org/10.1111/grow.12328
- Esposito, C. R., & Rigby, D. L. (2019). Buzz and pipelines: The costs and benefits of local and nonlocal interaction. Journal of Economic Geography, 19(3), 753–773. https://doi.org/10.1093/jeg/lby039
- Fertner, C. (2012). Downscaling European urban–rural typologies. Geografisk Tidsskrift – Danish Journal of Geography, 112(1), 77–83. https://doi.org/10.1080/00167223.2012.707805
- Fischer, M. M., & Varga, A. (2003). Spatial knowledge spillovers and university research: Evidence from Austria. The Annals of Regional Science, 37(2), 303–322. https://doi.org/10.1007/s001680200115
- Furkova, A. (2019). Spatial spillovers and European Union regional innovation activities. Central European Journal of Operations Research, 27(3), 815–834. https://doi.org/10.1007/s10100-018-0581-4
- Gandini, A., & Cossu, A. (2019). The third wave of coworking: ‘Neo-corporate’ model versus ‘resilient’ practice. European Journal of Cultural Studies, 24(2), 430–447.
- Hamidi, S., Zandiatashbar, A., & Bonakdar, A. (2019). The relationship between regional compactness and regional innovation capacity (RIC): empirical evidence from a national study. Technological Forecasting and Social Change, 142, 394–402. https://doi.org/10.1016/j.techfore.2018.07.026
- Handy, S. (2020). Is accessibility an idea whose time has finally come? Transportation Research Part D – Transport and Environment, 83, 102319. https://doi.org/10.1016/j.trd.2020.102319
- Hansen, W. G. (1959). How accessibility shapes land Use. Journal of the American Institute of Planners, 25(2), 73–76. https://doi.org/10.1080/01944365908978307
- Harrington, V., & O’Donoghue, D. (1998). Rurality in England and Wales 1991: A replication and extension of the 1981 rurality index. Sociologia Ruralis, 38(2), 178. https://doi.org/10.1111/1467-9523.00071
- Hedlund, M. (2016). Mapping the socioeconomic landscape of rural Sweden: Towards a typology of rural areas. Regional Studies, 50(3), 460–474. https://doi.org/10.1080/00343404.2014.924618
- Hjaltadottir, R. E., Makkonen, T., & Mitze, T. (2020). Inter-regional innovation cooperation and structural heterogeneity: Does being a rural, or border region, or both, make a difference? Journal of Rural Studies, 74, 257–270. https://doi.org/10.1016/j.jrurstud.2019.10.008
- Jaffe, A. (1989). Real effects of academic research. American Economic Journal, 79(5), 957–970.
- Keeble, D., & Tyler, P. (1995). Enterprising behaviour and the urban–rural shift. Urban Studies, 32(6), 975–997. https://doi.org/10.1080/00420989550012753
- Keeble, D., & Wilkinson, F. (1999). Collective learning and knowledge development in the evolution of regional clusters of high technology SMEs in Europe. Regional Studies, 33(4), 295–303. https://doi.org/10.1080/00343409950081167
- Kovacs, G., Kopacsi, S., Haidegger, G., & Michelini, R. (2006). Ambient intelligence in product life-cycle management. Engineering Applications of Artificial Intelligence, 19(8), 953–965. https://doi.org/10.1016/j.engappai.2006.01.017
- Lawson, C., & Lorenz, E. (1999). Collective learning, tacit knowledge and regional innovative capacity. Regional Studies, 33(4), 305–317. https://doi.org/10.1080/713693555
- Lin, J. J., Feng, C. M., & Lee, Y. N. (2007). Influence of accessibility on innovation – Empirical study of electronics industry in northern Taiwan. Transportation Research Record, 1994, 74–79.
- Mahroum, S., Atterton, J., Ward, N., Williams, A. M., Naylor, R., Hindle, R., & Rowe, F. (2007). Rural innovation (Exploration No. 01). National Endowment for Science, Technology and the Arts (NESTA).
- Mansfield, E. (1995). Academic research underlying industrial innovation: Sources, characteristics and financing. Review of Economics and Statistics, 77(1), 55–65. https://doi.org/10.2307/2109992
- Martinovic, M., & Ratkaj, I. (2015). Sustainable rural development in Serbia: Towards a quantitative typology of rural areas. Carpathian Journal of Earth and Environmental Sciences, 10(3), 37-48.
- Massard, N., & Mehier, C. (2009). Proximity and innovation through an ‘accessibility to knowledge’ lens. Regional Studies, 43(1), 77–88. https://doi.org/10.1080/00343400701808881
- Mendonca, S., Pereira, T. S., & Godinho, M. M. (2004). Trademarks as an indicator of innovation and industrial change. Research Policy, 33(9), 1385–1404. https://doi.org/10.1016/j.respol.2004.09.005
- Moretti, E. (2004). Workers’ education, spillovers, and productivity: Evidence from plant-level production functions. American Economic Review, 94(3), 656–690. https://doi.org/10.1257/0002828041464623
- Murray, E. T., Nicholas, O., Norman, P., & Jivraj, S. (2021). Life course neighborhood deprivation effects on body mass index: Quantifying the importance of selective migration. International Journal of Environmental Research and Public Health, 18(16), 8339. https://doi.org/10.3390/ijerph18168339
- North, D., & Smallbone, D. (2000). The innovativeness and growth of rural SMEs during the 1990s. Regional Studies, 34(2), 145–157. https://doi.org/10.1080/00343400050006069
- Organisation for Economic Co-operation and Development (OECD). (1994). Creating rural indicators for shaping territorial policy. OECD.
- Papa, E., Silva, C., te Brommelstroet, M., & Hull, A. (2016). Accessibility instruments for planning practice: A review of European experiences. Journal of Transport and Land Use, 9, 57–75.
- Phillipson, J., Tiwasing, P., Gorton, M., Maioli, S., Newbery, R., & Turner, R. (2019). Shining a spotlight on small rural businesses: How does their performance compare with urban? Journal of Rural Studies, 68, 230–239. https://doi.org/10.1016/j.jrurstud.2018.09.017
- Rammer, C., Kinne, J., & Blind, K. (2020). Knowledge proximity and firm innovation: A microgeographic analysis for Berlin. Urban Studies, 57(5), 996–1014. https://doi.org/10.1177/0042098018820241
- Rao, K. U., & Kishore, V. V. N. (2010). A review of technology diffusion models with special reference to renewable energy technologies. Renewable & Sustainable Energy Reviews, 14(3), 1070–1078. https://doi.org/10.1016/j.rser.2009.11.007
- Roche, M. P. (2020). Taking innovation to the streets: Microgeography, physical structure, and innovation. Review of Economics and Statistics, 102(5), 912–928. https://doi.org/10.1162/rest_a_00866
- Roper, S., & Love, J. H. (2018). Knowledge context, learning and innovation: An integrating framework. Industry and Innovation, 25(4), 339–364. https://doi.org/10.1080/13662716.2017.1414744
- Roper, S., Love, J. H., & Bonner, K. (2015). Benchmarking local innovation – The innovation geography of the UK. Warwick Business School/Aston Business School.
- Roper, S., Vahter, P., & Love, J. H. (2013). Externalities of openness in innovation. Research Policy, 42(9), 1544–1554. https://doi.org/10.1016/j.respol.2013.05.006
- Scott, A. J., & Storper, M. (2015). The nature of cities: The scope and limits of urban theory. International Journal of Urban and Regional Research, 39(1), 1–15. https://doi.org/10.1111/1468-2427.12134
- Smailes, P. J., Argent, N., & Griffin, T. L. C. (2002). Rural population density: Its impact on social and demographic aspects of rural communities. Journal of Rural Studies, 18(4), 385–404. https://doi.org/10.1016/S0743-0167(02)00033-5
- Smith, T., Noble, M., Noble, S. M., Wright, G., McLennan;, D., & Plunkett, E. (2015). The English indices of deprivation 2015 – Research report. Department for Communities and Local Government.
- Storper, M., & Venables, A. J. (2004). Buzz: The economic force of the city. Journal of Economic Geography, 4(4), 351–370. https://doi.org/10.1093/jnlecg/lbh027
- Tinguely, X. (2013) The new geography of innovation: Clusters, competitiveness and theory. Palgrave Macmillan.
- Trippl, M., Todtling, F., & Lengauer, L. (2009). Knowledge sourcing beyond buzz and pipelines: Evidence from the Vienna software sector. Economic Geography, 85(4), 443–462. https://doi.org/10.1111/j.1944-8287.2009.01047.x
- van den Berg, P., Kemperman, A., & Timmermans, H. (2014). Social interaction location choice: A latent class modeling approach. Annals of the Association of American Geographers, 104(5), 959–972. https://doi.org/10.1080/00045608.2014.924726
- van Eupen, M., Metzger, M. J., Perez-Soba, M., Verburg, P. N., van Doorn, A., & Bunce, R. G. H. (2012). A rural typology for strategic European policies. Land Use Policy, 29(3), 473–482. https://doi.org/10.1016/j.landusepol.2011.07.007
- Visser, E. J., & Boschma, R. (2004). Learning in districts: Novelty and lock-in in a regional context. European Planning Studies, 12(6), 793–808. https://doi.org/10.1080/0965431042000251864
- Wachs, M., & Kumagai, T. G. (1973). Physical accessibility As A social indicator. Socio-Economic Planning Sciences, 7(5), 437–456. https://doi.org/10.1016/0038-0121(73)90041-4
- Weir, R. (2019). Using geographically weighted regression to explore neighborhood-level predictors of domestic abuse in the UK. Transactions in GIS, 23(6), 1232–1250. https://doi.org/10.1111/tgis.12570
- Wu, D., Wu, X. B., Zhou, H. J., & Kang, M. G. (2020). Interfirm networks and search-transfer problem: The role of geographic proximity. Industrial Management & Data Systems, 120(5), 923–940. doi:10.1108/IMDS-07-2019-0384
