
 ?Mathematical formulae have been encoded as MathML and are displayed in this HTML version using MathJax in order to improve their display. Uncheck the box to turn MathJax off. This feature requires Javascript. Click on a formula to zoom.
ABSTRACT
The literature has shown that related diversification in more complex industries enhances economic growth in regions but also inter-regional inequality. However, it has drawn little attention to the relationship between industrial dynamics (i.e., the rise and fall of industries) and intra-regional wage inequality. This explorative study examines the relationship between industry dynamics and wage inequality in NUTS-3 regions in the Netherlands in the period 2010–2019. Our study shows that related diversification in less complex industries tends to reduce wage inequality within a region. This implies it remains a policy challenge to combine smart and inclusive growth in regions. Our study also showed that there is no significant relationship between the exit of industries and regional inequality, with one exception: unrelated low-complex exits tend to increase intra-regional wage inequality. Overall, these findings suggest that related diversification in less complex industries tends to bring benefits in terms of inclusive growth, while unrelated exits in less complex industries tend to do the opposite.
1. INTRODUCTION
Many regions have the ambition to combine smart growth and inclusive growth (Lee, Citation2016). The objective of smart growth means that regions aim to develop new activities that build on local capabilities, as promoted by Smart Specialisation policy in the European Union (Foray, Citation2014). However, not every region has the same capacity to diversify into new industries (Balland et al., Citation2019; Neffke et al., Citation2011; Uhlbach et al., Citation2022). McCann and Ortega-Argilés (Citation2015) among others have raised concerns that advanced regions have a strong capacity to do so, while backward and peripheral regions lag behind in this respect. If so, smart growth could lead to increasing regional income disparities and go at the expense of inclusive growth.
This begs the question how the entry of new industries affects regional wage inequality. Studies show how innovation has a tendency to increase income disparities across regions (Lee, Citation2011, Citation2016). Iammarino et al. (Citation2019) suggest that technological change and globalisation contribute to regional divergence of income levels in Europe (Moretti, Citation2012). This is because high-income regions are well-endowed with human capital, advanced knowledge institutes, regional innovation systems, diversity and connectivity to other regions that trigger and enhance innovation (Asheim et al., Citation2019; Feldman & Audretsch, Citation1999).
However, while innovation often contributes to economic growth, it does not necessarily ensure the socio-economic well-being of all residents, particularly in terms of wage equality (Lee et al., Citation2016; Lindley & Machin, Citation2014; Rodríguez-Pose & Tselios, Citation2009). What is well-known is that the success of Silicon Valley as a global innovative hub has led to the crowding out of low-income people due to the lack of affordable housing (Gyourko et al., Citation2013; Lee & Clarke, Citation2019). Florida (Citation2006) claimed that the most innovative cities in the US are also those that are the most unequal. There is indeed increasing evidence of a positive relationship between innovation and wage inequality within regions (Breau et al., Citation2014; Lee, Citation2011; Lee & Rodríguez-Pose, Citation2013). This has partly been attributed to the local presence of high-skilled jobs that raise the demand for local services and create an employment multiplier for low-wage jobs (Florida, Citation2017; Lee & Clarke, Citation2019; Moretti, Citation2010).
Lots of studies have observed job polarisation in many developed countries, meaning a major shift of employment away from middle-skill occupations towards high- and low-skill occupations, leading to a hollowing out of the middle class and increased wage inequality. However, its extent and causes remain widely debated in the literature (Terzidis & Ortega-Argiles, Citation2021). One of the primary debates concerns whether it is driven by technological change or globalisation and trade. However, little attention has been given to the relationship between industrial dynamics and intra-regional wage inequality.
There is little understanding of the extent to which industrial dynamics in regions (in terms of entries but also exits of industries) induce such intra-regional inequality. To our knowledge, systematic evidence is lacking over what impacts the rise and fall of industries have on intra-regional inequality, in particular the impact of the entry and exit of complex industries that rely on a wide range of capabilities and are difficult to imitate by other regions, and therefore bring higher economic growth (Hidalgo & Hausmann, Citation2009). Studies show that the most complex activities tend to concentrate in the richest cities, and there is a positive association with their economic performance (Antonelli et al., Citation2022; Balland et al., Citation2020; Balland & Rigby, Citation2017; Mewes & Broekel, Citation2022; Rigby et al., Citation2022). This implies that inter-regional inequality is likely to increase, as high-income regions would have a greater capacity to diversify into more complex activities that bring higher economic benefits. This is in line with Pinheiro et al. (Citation2022) that showed that regions with a high GDP per capita in Europe have the best opportunity to diversify into high-complex activities, while lagging regions focus mainly on the development of low-complex activities. However, no study yet exists that has examined the relationship between industrial diversification on intra-regional wage inequality, let alone what such a relationship looks like in the case of complex entries.
To examine the relationship between industrial dynamics and intra-regional wage inequality requires detailed data on the entry and exit of industries in regions and then linking them to the wages of individuals within regions. At the European level, these regional data are not available, which makes it near to impossible to investigate this relationship for all European countries (Boschma et al., Citation2022). Therefore, we restrict our analysis to one single country (the Netherlands) where we use linked employer-employee micro-data from the Central Bureau of Statistics in the Netherlands. These provide data on detailed industry categories which can be linked to the wages of individuals and their work location in 40 NUTS-3 regions (labour market areas). This enables us to make a first small step to determine whether smart growth can, or cannot, be combined with inclusive growth at the regional scale.
This relationship between industrial dynamics and intra-regional inequality will be investigated from a relatedness/complexity framework (Balland et al., Citation2019; Boschma, Citation2017; Hidalgo et al., Citation2018). The relatedness principle has proven successful in explaining why entering industries in regions are often related to existing local industries, especially when these industries are highly complex and thus difficult to develop, and why exiting industries are often less related to existing local industries (Balland et al., Citation2019; Boschma, Citation2017; Neffke et al., Citation2011; Whittle & Kogler, Citation2020). Our study shows that entries, especially low-complex related entries, tend to reduce wage inequality within a region. We observe no significant relationship between exits of industries and regional inequality, with one exception: unrelated low-complex exits tend to increase intra-regional wage inequality. These findings suggest that related diversification in low-complex industries bring benefits to regions in terms of inclusive growth, while unrelated exits in low-complex industries do not.
The paper is structured as follows. First, we discuss the relationship between industrial dynamics and regional inequality. Then, we present the data and the indicators used, such as the skill-relatedness measure, the measurement of regional entries and exits, and the regional inequality variables. After that, we present the main findings of the Dutch study. Finally, we conclude and discuss implications for future research as well as for policy.
2. INDUSTRIAL DYNAMICS AND REGIONAL INEQUALITY
Regional inequality is on the rise (Feldman et al., Citation2021; Iammarino et al., Citation2019; Terzidis et al., Citation2017). In the EU, income inequality across NUTS-2 regions has substantially risen since the 2000s (Rosés & Wolf, Citation2018). In the US, inequality in income per capita between metropolitan areas has increased from the 1980s (Ganong & Shoag, Citation2017). Scholars attribute these rising disparities to technological change and globalisation (Iammarino et al., Citation2019; Kemeny et al., Citation2022; Moretti, Citation2012). Advanced economies have witnessed a concentration of knowledge-intensive activities in large cities in combination with the spread of low-value activities to less developed regions (Kemeny & Storper, Citation2020; Puga, Citation1999). Technological change has decreased trade costs which makes knowledge-intensive activities become increasingly concentrated in large cities (Levy & Murnane, Citation2005) where high-paid, high-skilled and non-routine jobs are found (Diamond, Citation2016; Moretti, Citation2004). Other regions, often those with a substantial presence of the manufacturing sector, are stagnating economically, due to trade and automation of routine tasks (Autor, Citation2019).
There is a large body of literature on job polarisation. Terzidis and Ortega-Argiles (Citation2021) conducted a meta-study to analyse the impact of trade and technological progress on labour markets in the Netherlands. The findings suggest that both factors are important, but the relative contribution of each is unclear. Autor et al. (Citation2003) analysed the growth of low-skill service occupations between 1980 and 2005 in the US labour market. They argue that this growth is driven by the polarisation of labour demand, which reflects the complementarity between workers’ skills and tasks performed on the job. They show that routine tasks, which are easily automated or offshored, are concentrated in middle-skill occupations, while non-routine tasks, which require problem-solving or interpersonal skills, are concentrated in high- and low-skill occupations. Goos et al. (Citation2009) and Michaels et al. (Citation2014) found similar patterns of job polarisation in Europe and other developed countries. Other studies have focused on the role of globalisation and trade in driving job polarisation. Feenstra and Hanson (Citation1996) showed that trade with China led to a significant increase in the demand for high-skill workers in the US in the 2000s, while Becker et al. (Citation2013) found that regions with a high share of tradable industries were more susceptible to job polarisation in Germany. Firpo et al. (Citation2011, Citation2018) investigated the impact of international trade on wage inequality in Brazil and found that exposure to foreign competition contributed to rising wage inequality in the 1990s and 2000s.
The concentration of innovative activity in cities often goes hand in hand with intra-regional inequalities (Lee et al., Citation2016; Lindley & Machin, Citation2014; Rodríguez-Pose & Tselios, Citation2009). Florida (Citation2006) claimed that the most innovative cities in the US are also the most unequal. Lee (Citation2011) and Lee and Rodríguez-Pose (Citation2013) found a positive relationship between innovation and wage inequality in European regions. Breau et al. (Citation2014) confirmed this result for Canadian cities. Large cities draw in relatively high amounts of both high- and low-skilled workers (Eeckhout et al., Citation2014) where the high-skilled workers increase the demand for local services, resulting in an employment multiplier for low-wage jobs (Autor & Dorn, Citation2013; Moretti, Citation2010). Lee and Clarke (Citation2019) found significant local employment multiplier effects from high-tech jobs in a study in the UK, where low-skilled workers profited from new employment opportunities in relatively poorly paid service jobs (see also Florida, Citation2017).
The regional diversification literature (Boschma, Citation2017) has focused on the entry of industries in regions and how they build on local capabilities from related industries (Essletzbichler, Citation2015; Neffke et al., Citation2011). This literature tends to suggest that regional diversification is likely to increase inter-regional inequality. This is not because high-income regions necessarily diversify more than low-income regions (Xiao et al., Citation2018), but because high-income regions have a stronger capacity to diversify more into more complex activities (Pinheiro et al., Citation2022) that also bring higher economic benefits to the region (Rigby et al., Citation2022). There is increasing evidence that complex activities concentrate in the richest cities, enhancing their economic performance (Antonelli et al., Citation2022; Balland & Rigby, Citation2017; Balland et al., Citation2020; Mewes & Broekel, Citation2022; Pintar & Scherngell, Citation2021; Rigby et al., Citation2022). Balland et al. (Citation2019) found that many regions have the ambition to diversify into more complex activities but lack the capabilities to do so. Pinheiro et al. (Citation2022) showed that advanced regions have the best opportunity to diversify into high-complex activities, while lagging regions focus mainly on the development of low-complex activities. Their study showed that high-income regions (GDP per capita) in Europe do not only enter complex technologies and industries, they also have the highest potential to continue to do so, given their local capabilities.
The complexity literature (Hausmann et al., Citation2014; Hidalgo & Hausmann, Citation2009) has investigated the relationship between economic complexity and intra-regional inequality. At the country level, studies have shown that the higher the complexity of an economy, the lower the wage inequality (Hartmann et al., Citation2017, Citation2020). This finding at the national scale stands in contrast with studies done at the regional scale that show there is instead a positive relationship between economic complexity and inequality at the sub-national scale (e.g., Davies & Maré, Citation2021; Hartmann & Pinheiro, Citation2022; Heinrich Mora et al., Citation2021; Marco et al., Citation2022; Sbardella et al., Citation2017). New York and San Francisco are prime examples of complex cities that show the highest inequalities. According to Hartmann and Pinheiro (Citation2022), the positive relationship may be attributed to the co-existence of simple and complex activities in large cities where relatively few job opportunities exist for middle-income people in semi-complex activities. However, Gao and Zhou (Citation2018) and Zhu et al. (Citation2020) found a negative relationship for Chinese regions.
So, while the relationship between innovation, complexity and intra-regional inequality is being explored, there is yet little understanding of the extent to which industrial dynamics (in terms of entries as well as exits of industries) induce intra-regional inequality. Some scholars (Aghion, Citation2002; Mendez, Citation2002) have paid attention to the relationship between creative destruction and inequality. However, the literature has not yet investigated how the entry and exit of industries may affect intra-regional inequality (Boschma, Citation2017).
It is not straightforward what relationship to expect between entry and wage inequality at the regional level. As high-complex industries pay higher wages than low-complex industries, entries in more complex industries are likely to pay higher average wages than entries in less complex industries. Following Pinheiro et al. (Citation2022), we expect that entries in high-income regions occur mainly in complex industries, while in low-income regions, entries occur mainly in less complex industries. While it is clear that this is likely to increase wage inequality between regions, it is uncertain what to expect in terms of their effect on intra-regional wage inequality. This is likely to depend on whether entries in high-income regions are mainly in high-complex industries and whether these industries pay higher wages than the average wage in these regions. However, we cannot assume a priori whether this is the case. The same uncertainty is true for entries in low-income regions. In those regions, it depends on whether entries are mainly in low-complex industries and whether these industries pay lower wages than the average wage in such regions. On these bases, it is uncertain what kind of effect the complexity of entries will have on intra-regional wage inequality.
The same uncertainty applies to the effect of relatedness of entries on regional wage inequality. Entries in related industries share similar skill requirements with other related industries in the region (Neffke & Henning, Citation2013). Therefore, related entries need to compete for labour with other related local industries, so they might have to offer higher wages to their employees. This may also lead to an increase of wage levels in the other related industries in the region (Fitjar & Timmermans, Citation2019; Glaeser, Citation1992; Rosenthal & Strange, Citation2004; Rørheim & Boschma, Citation2022). However, it remains unclear whether related entries will increase wage inequality within regions. This depends on whether entries in related industries would pay higher wages than the average industry in the region, but there is no strong reason to assume that related entries would pay higher wages than the regional average. The same uncertainty concerns the effect of related entries in complex industries. As complex entries are expected to pay higher wages on average, especially when they compete with other related industries in the region, this might imply that related complex entries have a higher probability to enhance intra-regional wage inequality. However, we already explained before that it is uncertain what kind of effect the complexity of entries will have on intra-regional wage inequality.
In other words, we have no ex ante expectations what the relationship between industry entry and intra-regional wage inequality will look like. This means our study is explorative. We examine whether a high intensity of complex entries in a region is associated with a higher or lower wage inequality within the region, whether more related entries in a region goes hand in hand with a higher or lower intra-regional wage inequality, and whether more complex related entries that occur in a region is correlated with a higher or lower wage inequality in the region.
How about exits of industries? To our knowledge, no study has yet examined the relationship between exiting industries and intra-regional inequality. It is not entirely clear how exits in general might affect intra-regional inequality from a theoretical perspective. This depends on whether exits will happen mainly in less complex industries and whether these pay lower average wages. But the effect on intra-regional wage inequality will also depend on where the unemployed will go after. What is well-known is that industries are more likely to exit a region when unrelated to local industries (Neffke et al., Citation2011). This might imply that redundant people will end up either unemployed (their skills will not be in high demand), or they find alternative jobs in skill-unrelated industries in the region. Because their skills are of no immediate relevance in unrelated industries where they find new employment, this may contribute to a lowering of their wages. This has been observed in studies that have examined the effects of closures of major companies or losses of industries in regions on skill destruction, reallocation of skills and the employment careers of the displaced workers (Eriksson et al., Citation2016; Hane-Weijman, Citation2021; Hane-Weijman et al., Citation2018; Holm et al., Citation2017; Holm & Østergaard, Citation2015; Kekezi & Boschma, Citation2021; Rørheim & Boschma, Citation2022). This move to skill-unrelated industries in regions may possibly cause an increase in intra-regional wage inequalities, but this depends on what wages are paid in these industries, which is hard to assume beforehand. For (related) exits in general, it is also unclear ex ante what relationship to expect. Therefore, this study will explore whether different types of exits in terms of relatedness and complexity, such as those in low-complex and unrelated industries in a region, go hand in hand with a higher or lower wage inequality in the region.
3. METHODS, DATA AND DESCRIPTIVES
3.1. Data and methodology
This paper explores the interplay between industry dynamics and wage inequality at the regional level. This makes the paper distinct from studies that focused on the correlation between innovation and regional inequality that primarily use patent data, such as those by Lee (Citation2011) and Lee and Rodríguez-Pose (Citation2013). It is a well-established fact that patenting is a practice limited to a relatively small subset of firms, with innovation itself typically concentrated in specific regions. Audretsch and Feldman (Citation1996) notably spotlighted the greater spatial concentration of innovation compared to production activities. More recent research supports this, demonstrating that the relationship between patenting and population, as well as scientific activities and population, is significantly stronger than the connection between employment and population (Balland et al., Citation2020).
Our methodology, which leverages employment data, captures the diverse and intricate landscape of human capital and skills within a region. These are crucial for the creation and assimilation of innovation and knowledge (Hidalgo et al., Citation2018). Conversely, patent data measures the technological innovation output of certain sectors and regions and is often highly concentrated across sectors and space. Furthermore, patents might not capture all innovation types, such as process, organisational or social innovation, which could be pivotal for regional development and diversification. In light of these observations, we posit that the use of employment data across industries can provide a more accurate portrayal of sectoral dynamics.Footnote1
This requires detailed data on the entry and exit of industries in regions that can be linked to the wages of individuals. The downside of using such detailed industry data is that these are not available across regions in Europe (Boschma et al., Citation2022). Therefore, we restrict our analysis to one single country (the Netherlands). We use a newly constructed dataset on linked employer-employee data that contains detailed labour market information on individuals and their work locations in 40 labour market regions (NUTS-3) for the period 2010–2019. The use of labour market regions is important since it reduces concerns for commuters and mobility across regions.Footnote2 These micro-data have been obtained from the National Bureau of Statistics in the Netherlands.
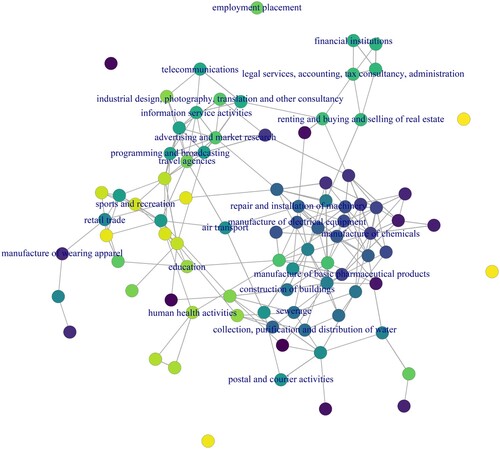
First, we have to compute the relatedness between industries in the Netherlands. To this end, we calculate the degree of skill-relatedness between industries following Neffke and Henning (Citation2013), making use of the richness of the linked employer-employee data. Industries are considered skill-related when they share similar skill requirements. This can be identified by looking at the intensity of labour flows between industries. When many workers change jobs between two industries, we assume the skills of these workers are in high demand in both industries. We used the CBS micro-data to determine the intensity of labour mobility between industries: the more labour flows between two industries compared to what would be expected given the industries’ respective sizes, the more skill-related the two industries are. presents the skill space of 1-digit industries in the Netherlands. As is typical for a skill space, some industries such as information and communication are skill-related with many industries, while some industries like agriculture, fishery and forestry are positioned more in the periphery of this network. In the remaining part, our data and analyses are based on 265 3-digit industry data, allowing us to measure the skill-space at a more fine-grained industry scale.
Figure 1. Skill space of the Netherlands for 1-digit industries, 2019–2020.
Second, we linked employees to their job location (NUTS-3 level). We used this information to calculate what industries each region in each year is specialised in, based on location quotients and applying a bootstrapping technique (see Cortinovis et al., Citation2017; Tian, Citation2013). Using information on sectoral specialisations, defined as binary variables, we observe changes in the specialisation patterns over time to identify industries that have entered and exited a region. Using binary variables to capture entry (and exit) is a common approach in the evolutionary literature on relatedness (Boschma, Citation2017) as it allows one to capture when an industry becomes significantly present (or no longer present) in a region. We do so by comparing the vector of sectoral specialisations for the same region over a period of time. If a specialisation in industry i was not present in region r at time t−3, but it became present at time t, we consider it as an entry. An exit would occur if a specialisation in industry i and region r is ‘lost’ between time t−3 and time t. Our measures of entry and exit are binary, so they take value 1 when entry or exit occurs, 0 when it could occur but did not.Footnote3
To understand the role of relatedness linking industrial dynamics and inequality, we combine the information on entry and exit with the skill relatedness matrix derived from information on job switchers. As the skill-relatedness matrix is not symmetric (labour flows from industry A to industry B is not necessarily the same as that from industry B to industry A), we take the average score between two industries as a measurement of their relatedness. This allows us to create a symmetric matrix. We further split the skill relatedness matrix into two mutually exclusive matrices: M containing information on related sectors (with skill relatedness greater than 0, and setting the remaining cells to 0), and N containing information on unrelated sectors (with the absolute values of cells for which skill relatedness below 0 and setting the remaining cells to 0). We compute the top and bottom deciles in the relatedness scores of each industry and apply those as thresholds to define relatedness (top 10 percentile) and unrelatedness (bottom 10 percentile).Footnote4 For every industry i in region r at time t, we first measure how related (or unrelated) each industry is to existing specialisations in the region as follows:
(1b)
(1b)
(1b)
(1b) where
(
) measures the pairwise skill relatedness (unrelatedness) between sector i and sector j. We then filter the observations in the vector
(
) keeping only industries that have entered (or exited) region r at time t. We do so as shown below:
(2a)
(2a)
(2b)
(2b) with the
being the entry vector binarily identifying which industries have entered region r at time t. The variable
captures the how related each entry is to existing specialisations of the regions, while
measures the unrelatedness of each entry to existing specialisations. However, the same entering industry i in region r at time t can have non-zeros score for both related (
) and unrelated entry (
) since matrices M and N are mutually exclusive.Footnote5 To unambiguously define whether an entry is related or unrelated, we compare the two values of the two variables:
(3a)
(3a)
(3b)
(3b)
Further, we explore the role of complexity in the relation between industrial dynamics and inequality. To this end, we use information on sectoral specialisations in the Netherlands using our LEED database to compute a measure of economic complexity for each industry. To limit the chances of spurious fluctuations in the complexity score across the years, we define the average level of employment for each sector in each municipalityFootnote6 across the years and apply the eigenvector method to estimate complexity (Balland, Citation2017). As shown in Table A7 in Appendix A7 in the online supplemental data, more knowledge-intensive industries report a higher score of economic complexity.Footnote7 We also define binary variables for high and low complexity industries based, respectively, on the top and bottom decile of the complexity index. As a robustness check, we also took as thresholds the top 20 and bottom 20 percentiles. Using the entry and exit vectors, we build
(4a)
(4a)
(4b)
(4b)
(4c)
(4c) which respectively measure the complexity level of each entry (or exit) (4a), and whether each entry (or exit) refers to a high or low complexity industry (4b and 4c).Footnote8
Since our focus is on studying regional-level inequality, we aggregate the variables (e.g., entry, related and unrelated entries, high and low complexity entries, etc.), obtaining different measures of industrial dynamics varying by NUTS-3 and year. We replicate the same approach when computing the variables concerning industrial exits.
Finally, the micro data from CBS provides information on individual wages and work location, which we use to construct our dependent variable. As we are mostly interested in studying inequality across regions, our baseline analysis will use the Gini coefficient as the dependent variable. The Gini coefficient is the most widely used measure of inequality and captures the deviation of the observed income distribution from a theoretically perfectly equal benchmark, allowing one to effectively compare inequality across regions (Buitelaar et al., Citation2018). However, as the Gini coefficient may have a nonnegligible downward bias when comparing inequality among subsamples (Deltas, Citation2003), for robustness checks, we also use the widely used Theil index which is based on the regional wage distribution.Footnote9
3.2. Econometric model
The objective of our analysis is to explore the relationship between intra-regional inequality and industrial dynamics. To this end, we regress the region-wide measure of inequality on the number of entries (and exits) in each region, characterising sectoral dynamics on the basis of their relatedness and complexity. In its most simple form, we estimate the following model:
where the dependent variable
represents the score of the Gini coefficient in region r at time t, while
(and
) are respectively the total count of entries (and exits) in region r and time t. We further specify the role of industrial dynamics by modelling the count of related and unrelated entries (and exits), total complexity of entries (and exits) and the count of high- and low-complexity entries (and exits), also for both related and unrelated entries (and exits). We also include various control variables (C), capturing different socio-demographic and economic characteristics of Dutch regions. In terms of socio-demographic features, we control for total population, unemployment level and foreign-born population. The inclusion of these variables allows us to account for differences across COROP regions in terms of size and lower income groups (unemployed, foreign population), which are often associated with higher levels of inequality (Eeckhout et al., Citation2014; Kemeny & Storper, Citation2020; Lee & Clarke, Citation2019; Moretti, Citation2010). We also control for various characteristics of the regional economy, such as the local levels of human capital (proxied by the number of university graduates) and average income (captured by GDP per capita) (Balland & Rigby, Citation2017; Lee & Rodríguez-Pose, Citation2013). We further control for other potentially relevant factors, such as exposure to company failures (number of companies gone bankrupt) and level of self-employment (share of self-employed full-time equivalent (FTE) over total FTE). Finally, we exploit the panel setup of our data and add region (
) and time (
) fixed effects.
3.3. Data and descriptives
below reports the descriptive statistics for the variables used in our analysis. Interestingly, the numbers of entries and exits have very similar distributions, with the average Dutch region recording about seven entries and exits per 3-year period. Related entries and exits, as expected, occur more frequently than unrelated ones, regardless of whether they belong to the high or low complexity category. In Appendix A1, we present the spatial distribution of the average number of entries and exits during the period 2010–2019 across the 40 COROP regions of the Netherlands. To complete the description of our data, we report the pairwise correlation for the same variables in Table A6 in Appendix A6.
Table 1. Descriptive statistics.
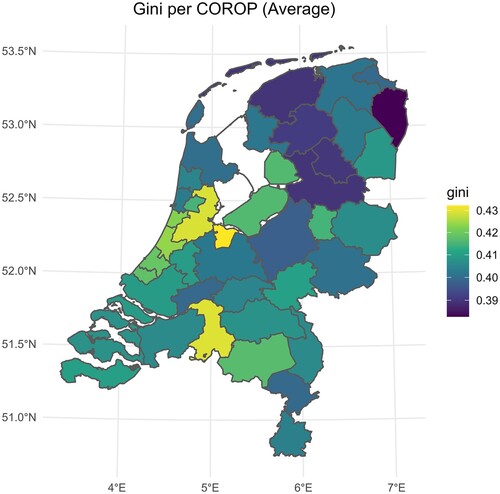
shows a map of the average Gini coefficient in all 40 regions. There are clear differences in wage inequalities across Dutch regions although these are not that marked (see also PBL, Citation2016). Wage inequality levels are most pronounced in the northern part of the Randstad area: Groot-Amsterdam and its neighbouring regions such as Gooi en Vechtstreek show the highest scores, as well as the Midden Noord-Brabant region in the south. Relatively low levels of wage-inequality can be found in the northern part of the Netherlands, such as Oost-Groningen, Noord-Friesland, Zuidoost-Friesland, Zuidwest-Drenthe and Noord-Overijssel. We also calculated the Theil index for all regions which is an alternative inequality measure widely used. As shown in Appendix A2, the map of the Thiel index looks very similar to the one of the Gini coefficient.
Figure 2. Map of wage-inequality 2010–2019 (average Gini coefficient).
4. REGRESSION ANALYSIS
We regress the level of wage inequality (Gini coefficient) on entries/exits that occurred in that region in the same three-year period during 2010–2019 for seven overlapping periods (2010–2013, 2011–2014, 2012–2015, 2013–2016, 2014–2017, 2015–2018 and 2016–2019). This means we have a total of 280 observations (40 regions × 7 periods). It is common to study entry-exit dynamics in industries taking a specific time interval, as entries and exits are rare events per year. In most studies on regional diversification, 5-year intervals are taken (Boschma, Citation2017). The choice of the 3-year period in our study is to secure a substantial number of observations, as we study only a relatively short time period. To ensure the robustness of our findings, we also conducted analysis using 5-year intervals.
presents the findings for entries. We find a negative relationship between entry and levels of inequality: the higher the number of entries in a region, the lower wage inequality. This is true for related but not unrelated entries (Model 2), even though the coefficient for related entries is only weakly significant (at 10% level). There is no relationship between the complexity level of entries and the Gini coefficient: the coefficient in Model 3 is positive but not significant. This is despite the fact that there is a positive correlation of 0.34 between the Economic Complexity Index and the Gini coefficient in a region (as shown in Appendix A3), and a positive correlation of 0.37 between the mean wage level of an industry and its complexity (as shown in Appendix A4). This latter outcome confirms the results of other studies: complex regions have higher wage inequality levels (e.g., Hartmann & Pinheiro, Citation2022).
Table 2. Relationship between Entry and Gini coefficient.
However, we found in Model 4 that less complex entries tend to reduce the level of inequality, especially when it concerns related but also unrelated entries (Model 5). This is an intuitive result, as lower salaries are paid in less complex industries, as compared to more complex industries, and entry in more complex industries does not reduce inequality, while low-complex entries do. We did not find a positive relationship between related complex entries and intra-regional inequality, which might suggest that complex entries do not pay higher wages on average when they have to compete with other related industries in the region.
summarises the results in the case of exits. The main outcome is that we did not find a significant relationship between exits and wage inequality at the regional level. There is one exception to this interesting outcome though. Model 4 shows that exits of low-complex industries tend to increase inequality, especially when it concerns low-complex unrelated exits, as shown in Model 5. This is a plausible result, as the displaced workers may have to accept lower wages, because they are likely to find jobs in other local low-complex industries where their skills are of little value, as these are unrelated to the industry they worked for before (Eriksson et al., Citation2016; Holm et al., Citation2017).
Table 3. Relationship between Exit and Gini coefficient.
The coefficients for our models seem relatively small in size. For example, in , Model 1, for each unit increase in ‘Entry’, the Gini coefficient decreases by 0.0003 on average, holding all other variables constant. While the coefficient may appear small, it is crucial to recall that the Gini coefficient ranges between 0 (perfect equality) and 1 (perfect inequality). Therefore, even small changes can have meaningful effects on the wage distribution.
5. ROBUSTNESS CHECKS
Three robustness checks have been performed to assess the solidity of our findings. We focused on the dependent variable (using the Theil index, rather than the Gini coefficient; using the lag 1 year variable of inequality measures), the length of the time window we used (5-year period in the robustness checks, 3-year window in the baseline), on different specifications of the variables for relatedness and complexity and on possible spatial effects. Findings are reported in Tables A1–A5 in Appendix A5. We included the control variables in all regressions in the robustness checks, but for the sake of brevity, we did not report the coefficients. Broadly speaking, our key findings are confirmed in the robustness analyses, but there are some exceptions that are discussed in Appendix A5.Footnote10
6. CONCLUDING REMARKS
This explorative study on Dutch regions has shown that entry in low-complex industries that are skill-related to existing local industries tends to reduce wage inequality in a region. We observe no significant relationship between the exits of industries and intra-regional inequality, with one exception: unrelated low-complex exits tend to increase wage inequality in regions. Overall, these findings might suggest that diversification (entry), and possibly related diversification (related entries) in less complex industries might bring benefits to regions in terms of inclusive growth (lower wage inequality), while unrelated exits in less complex industries might tend to do the opposite (higher wage inequality). Even though with some differences, the general finding about low-complexity entries and exits is confirmed in our robustness checks.
Having said this, it is good to remember that any study opens up many new questions, and this paper is no exception to that rule. First of all, we have to be cautious not to jump into too powerful conclusions based on this single study, as the relationship between industrial dynamics and inequality at the regional level is a highly complex one. While our findings may be promising, it is just based on one single case study on the Netherlands. This enabled us to use micro-data in which we could link more closely the relationship between industrial dynamics and wage inequality at the regional level under the same set of national institutions. A logical next step is to replicate these findings in other countries, such as the US where the institutional set-up is very different and inequalities are more pronounced.
This paper has also been explorative and descriptive rather than explanatory. Therefore, future research should focus on theory development and derive clear hypotheses and study possible mechanisms behind our findings. This need for further research also concerns some of our findings, such as to why related entry of industries reduces intra-regional wage inequality. That this also applied to related diversification in less complex industries was more intuitive, as lower salaries are paid in less complex industries. We do indeed find that entry in more complex industries does not reduce inequality, while low-complex entries do, but this requires further investigation. Another key finding was that unrelated low-complex exits tend to increase wage inequality in regions. This is in line with literature on displaced workers and the reallocation of their skills (Holm et al., Citation2017). In that context, future research should explore more in detail (using micro-data) for all unrelated low-complex exits and how the displaced workers were actually re-allocated (to which industries), and how that affected their wage levels after the shock, in order to understand more fully how this affected wage inequality in the respective regions. What is still left to do for further research as well is to investigate whether industrial dynamics have different effects on intra-regional wage inequality in high- versus low-income regions. Using a more fine-grained perspective would also allow to model with greater attention the spatial dimension of inequality and industrial dynamics.
We also did not investigate what could be the effect of inter-regional linkages on intra-regional wage inequalities, such as inflows of labour (immigration), goods (imports) and foreign multinationals. Each of those have been investigated extensively in the literature (e.g., Cortinovis et al., Citation2020; Crescenzi et al., Citation2022; Rigby et al., Citation2017) but not so much their effects on intra-regional wage inequality. An exception is Breau and Rigby (Citation2010) who found a negative effect of import competition from low-income countries on wages of less-skilled workers in Canadian regions, increasing wage inequality. We also did not investigate whether multiplier effects might affect inequality levels within regions (Florida, Citation2017; Lee & Clarke, Citation2019; Moretti, Citation2010). For instance, entries of complex high-wage sectors might create demands for jobs in low-complex low-paid industries. Institutional factors such as labour market and welfare policies are also likely to determine inequality levels, not only at the national scale (Hartmann & Pinheiro, Citation2022) but also at the regional scale. Such policies might impact the resilience and adaptability of the labour market in response to the changing industrial dynamics, mediating its impact on inequality. To analyse this requires comparative research across regions in different countries which is not easy given the severe limitations of data comparability across those units at the micro-scale. For instance, at the European level, such detailed regional data in which industry data can be linked to wages of individuals and their locations are not available (Boschma et al., Citation2022).
This necessarily implies that this study makes only a first small step to determine whether smart growth can, or cannot, be combined with inclusive growth (proxied as intra-regional inequality) at the regional scale. The latter is also true for yet another reason. Our study tends to indicate that related diversification in low-complex industries might be good for inclusive growth in regions, while Rigby et al. (Citation2022) showed that related diversification in high-complex industries is best for smart growth in regions. This implies it remains challenging on how to combine the two policy objectives in practice.
Based on the above discussion, we are reluctant to draw strong policy implications from our findings at this stage, given the many questions that remain to be answered. Having said that, our findings are still relevant for regional policy. Our point of departure was to throw more empirical light on the relationship between smart and inclusive growth. While there is a traditional policy focus on regional convergence/divergence (i.e., inter-regional inequality), for instance in Cohesion policy, little attention so far has been directed to intra-regional inequality. For instance, in Smart Specialisation policy in the EU, there is hardly any mentioning of possible effects on intra-regional inequality when promoting smart growth (i.e., new entries). This implies an additional challenge has to be taken up by Smart Specialisation policy, on top of aligning its policy objective of smart growth to the objective of Cohesion policy of inclusive growth in terms of narrowing inter-regional inequality (Balland et al., Citation2019; McCann & Ortega-Argilés, Citation2015). While studies have shown that related diversification in complex industries enhances economic growth in regions (Rigby et al., Citation2022) but also inequality between regions (Pinheiro et al., Citation2022), our study suggests (related) diversification in less complex industries tends to reduce wage inequality within a region. This opens the question how policy should be designed to combine smart growth and these two dimensions of inclusive growth in regions.
This implies that policy actions in Smart Specialisation policy should account for implications for intra-regional inequality. Future research could investigate the feasibility of incorporating an inequality dimension in the design and execution of Smart Specialisation policy. For instance, when setting priorities, one could apply a third criterion (do they reduce wage inequality) besides relatedness (do they build on relevant capabilities in the region) and complexity (do they increase the complexity of the regional economy) to identify diversification opportunities in regions. This implies policy should make an effort to assess the types of jobs (skills, wages) that those priorities are likely to generate in the region. Alternatively, it might also be possible to combine innovation policies with other types of policies to reconcile the potential tension between smart and inclusive growth. For instance, Smart Specialisation policy could be paired with reskilling and upskilling programmes (Bashynska et al., Citation2021; Li, Citation2022) to help workers adjust to the changing demand for skills. This is especially important for European regions that are being trapped (Diemer et al., Citation2022) or left behind (Dijkstra et al., Citation2020; Rodríguez-Pose, Citation2018). Such regions are confronted with huge economic and social problems. This implies it is crucial that this priority-setting targets the specific needs of the low-skilled and unemployed in these regional settings, so to ensure that regional restructuring also provide solutions to those who are most in need.
Another policy implication of this study is that promoting smart growth cannot be seen in isolation from exits of industries in regions and their socio-economic consequences. While the literature shows that unrelated exits in low complex activities favours economic growth in regions (Rigby et al., Citation2022), our study found these types of exits have a tendency to increase wage inequality in regions. This means these exits are not necessarily bad but policy intervention is needed to counterbalance this particular negative outcome. This is a serious policy issue that many old industrial regions have been confronted with in the past (Boschma & Lambooy, Citation1999), but it is still on the policy agenda, especially in coal mining regions that go through major transitions (Alves Dias et al., Citation2018; Breul & Atienza, Citation2022). It is still not entirely clear under what specific circumstances that can be accomplished, and what policy can do and how. The time has come to acquire more understanding on these matters, so as to contribute to more effective policy that accounts for multiple goals and challenges at the same time.
Supplemental Material
Download PDF (651.7 KB)DISCLOSURE STATEMENT
No potential conflict of interest was reported by the authors.
Notes
1. We checked and can confirm that the distribution of patent specialisations in the Netherlands is indeed more concentrated than that of industry specialisations.
2. The Dutch Statistical Office defined COROP regions on commuting flows (CBS, Citation2023). In one of our robustness checks, we further test for possible spatial effects through spatial econometric modelling. Our results are consistent.
3. As a robustness check, we also consider a 5-year time difference (e.g. 2015 and 2010) rather than a 3-year one. The choice of using 3- and 5-year periods is based on providing enough time for observing dynamics of specialisations while ensuring a suitable number of observations in our model.
4. The choice of using deciles rather than other cutoffs is due to the fact the skill-relatedness matrix is rather sparse (about 50% of the cells are 0), making the sectoral distribution of skill relatedness skewed. As a result, the difference between using 0 as a cutoff or quartiles as thresholds is minimal.
5. For instance, the chemical industry may be related to the food industry if many people switch from one industry to the other, and, at the same time, being unrelated to the construction industry (if there are few switches between those two).
6. The choice of using municipalities rather than NUTS-3 regions comes from the importance of having a high number of cross-sectional units for the method to work effectively. Using only the 40 NUTS-3 regions in the Netherlands would not have been sufficient.
7. The table reports the scores for the bottom two and top two deciles. The table with the complexity score for each industry is available upon request.
8. The approach of categorising variable in low- and high-complexity industries allows us to simply allocate entries (and exits) into specific sub-groups, which sum up to the actual number of entries (and exits).
9. We use the Gini coefficient as our dependent variable because of its properties, especially with respect to its comparability across regions with different populations and its upper bound (Buitelaar et al., Citation2018). The properties of alternative variables are different. For instance, the Theil index is sensitive to population size and has no upper bound, while the Coefficient of Variation is sensitive to extreme values and has no upper bound either (for a short and comprehensive discussion of the different measures, see Trapeznikova, Citation2019).
10. The main differences between robustness checks and baseline regressions pertain the level of significance rather than the sign of the coefficients. Specifically, when using 5-year time interval, the variable Related entry turns non-significant while Unrelated entries become significant. Defining relatedness and complexity in a stricter way negatively affects the significance of the coefficients for related entry (Related entry) and low-complexity entry (LECI entry).
REFERENCES
- Aghion, P. (2002). Schumpeterian growth theory and the dynamics of income inequality. Econometrica, 70(3), 855–882. https://doi.org/10.1111/1468-0262.00312
- Alves Dias, P., Kanellopoulos, K., Medarac, H., Kapetaki, Z., Miranda-Barbosa, E., Shortall, R., Czako, V., Telsnig, T., Vazquez-Hernandez, C., Lacal Arántegui, R., Nijs, W., Gonzalez Aparicio, I., Trombetti, M., Mandras, G., Peteves, E., & Tzimas, E. (2018). EU coal regions: Opportunities and challenges ahead, EUR 29292 EN, Publications Office of the European Union, Luxembourg. https://doi.org/10.2760/064809.JRC112593.
- Antonelli, C., Crespi, F., & Quatraro, F. (2022). Knowledge complexity and the mechanisms of knowledge generation and exploitation: The European evidence. Research Policy, 51(8), 104081. forthcoming. https://doi.org/10.1016/j.respol.2020.104081.
- Asheim, B. T., Isaksen, A., & Trippl, M. (2019). Advanced introduction to regional innovation systems. Edward Elgar.
- Audretsch, D. B., & Feldman, M. P. (1996). R&D spillovers and the geography of innovation and production. The American Economic Review, 86(3), 630–640.
- Autor, D. (2019). Work of the past, work of the future. AEA Papers and Proceedings, 109, 1–32. https://doi.org/10.1257/pandp.20191110
- Autor, D. H., & Dorn, G. H. (2013). Inequality and specialization. The growth of low-skill service jobs in the United States. American Economic Review, 103(5), 1553–1597. https://doi.org/10.1257/aer.103.5.1553
- Autor, D. H., Levy, F., & Murnane, R. J. (2003). The skill content of recent technological change: An empirical exploration. The Quarterly Journal of Economics, 118(4), 1279–1333. https://doi.org/10.1162/003355303322552801
- Balland, P. A. (2017). EconGeo: Computing key indicators of the spatial distribution of economic activities, R package version 1.3. https://github.com/PABalland/EconGeo
- Balland, P. A., Boschma, R., Crespo, J., & Rigby, D. (2019). Smart specialization policy in the EU: Relatedness, knowledge complexity and regional diversification. Regional Studies, 53(9), 1252–1268. https://doi.org/10.1080/00343404.2018.1437900
- Balland, P. A., Jara-Figueroa, C., Petralia, S. G., Steijn, M. P., Rigby, D. L., & Hidalgo, C. A. (2020). Complex economic activities concentrate in large cities. Nature Human Behaviour, 1–7. http://dx.doi.org/10.1038/s41562-019-0803-3
- Balland, P. A., & Rigby, D. (2017). The geography of complex knowledge. Economic Geography, 93(1), 1–23. https://doi.org/10.1080/00130095.2016.1205947
- Bashynska, I., Garachkovska, O., Kichuk, Y., Podashevska, T., & Bigus, O. (2021). Smart education 4.0: Balancing dual-distance and reskilling revolution. Studies of Applied Economics, 39(6). https://doi.org/10.25115/eea.v39i6.5262
- Becker, S. O., Ekholm, K., & Muendler, M. A. (2013). Offshoring and the onshore composition of tasks and skills. Journal of International Economics, 90(1), 91–106. https://doi.org/10.1016/j.jinteco.2012.10.005
- Boschma, R. (2017). Relatedness as driver behind regional diversification: A research agenda. Regional Studies, 51(3), 351–364. https://doi.org/10.1080/00343404.2016.1254767
- Boschma, R. A., & Lambooy, J. G. (1999). The prospects of an adjustment policy based on collective learning in old industrial regions. GeoJournal, 49(4), 391–399. https://doi.org/10.1023/A:1007144414006
- Boschma, R., Pardy, M., & Petralia, S. (2022). Innovation, industrial dynamics and regional inequalities. In P. Bianchi, S. Labory, & P. R. Tomlinson (Eds.), Handbook on industrial development. Edward Elgar. forthcoming.
- Breau, S., Kogler, D. F., & Bolton, K. (2014). On the relationship between innovation and wage inequality: New evidence from Canadian cities. Economic Geography, 90(4), 351–373. https://doi.org/10.1111/ecge.12056
- Breau, S., & Rigby, D. L. (2010). International trade and wage inequality in Canada. Journal of Economic Geography, 10(1), 55–86. https://doi.org/10.1093/jeg/lbp016
- Breul, M., & Atienza, M. (2022). Extractive Industries and Regional Diversification: A Multidimensional Framework for Diversification in Mining Regions, Papers in Evolutionary Economic Geography # 22.13, Utrecht University, Utrecht.
- Buitelaar, E., Weterings, A., & Ponds, R. (2018). Cities, inequality and justice. Reflections and alternative perspectives. Routledge.
- CBS. (2023). Landelijk dekkende indelingen [Webpagina]. Centraal Bureau voor de Statistiek. Retrieved May 10, 2023, from https://www.cbs.nl/nl-nl/dossier/nederland-regionaal/informatie-voor-gemeenten/landelijk-dekkende-indelingen
- Cortinovis, N., Crescenzi, R., & Van Oort, F. (2020). Multinational enterprises, industrial relatedness and employment in European regions. Journal of Economic Geography, 20(5), 1165–1205. https://doi.org/10.1093/jeg/lbaa010
- Cortinovis, N., Xiao, J., Boschma, R., & van Oort, F. (2017). Quality of government and social capital as drivers of regional diversification in Europe. Journal of Economic Geography, 17(6), 1179–1208. https://doi.org/10.1093/jeg/lbx001
- Crescenzi, R., Dyevre, A., & Neffke, F. (2022). Innovation catalysts: How multinationals reshape the global geography of innovation. Economic Geography, 98(3), 199–227. https://doi.org/10.1080/00130095.2022.2026766
- Davies, B., & Maré, D. C. (2021). Relatedness, complexity and local growth. Regional Studies, 55(3), 479–494. https://doi.org/10.1080/00343404.2020.1802418
- Deltas, G. (2003). The small-sample bias of the Gini coefficient: Results and implications for empirical research. Review of Economics and Statistics, 85(1), 226–234. https://doi.org/10.1162/rest.2003.85.1.226
- Diamond, R. (2016). The determinants and welfare implications of US workers’ diverging location choices by skill: 1980–2000. American Economic Review, 106(3), 479–524. https://doi.org/10.1257/aer.20131706
- Diemer, A., Iammarino, S., Rodriguez-Pose, A., & Storper, M. (2022). The regional development trap in Europe. Economic Geography, 98(5), 487–509. https://doi.org/10.1080/00130095.2022.2080655
- Dijkstra, L., Poelman, H., & Rodríguez-Pose, A. (2020). The geography of EU discontent. Regional Studies, 54(6), 737–753. https://doi.org/10.1080/00343404.2019.1654603
- Eeckhout, J., Pinheiro, R., & Schmidheiny, K. (2014). Spatial sorting. Journal of Political Economy, 122(3), 554–562. https://doi.org/10.1086/676141
- Eriksson, R. H., Henning, M., & Otto, A. (2016). Industrial and geographical mobility of workers during industry decline: The Swedish and German shipbuilding industries 1970–2000. Geoforum; Journal of Physical, Human, and Regional Geosciences, 75, 87–98. https://doi.org/10.1016/j.geoforum.2016.06.020
- Essletzbichler, J. (2015). Relatedness, industrial branching and technological cohesion in US metropolitan areas. Regional Studies, 49(5), 752–766. https://doi.org/10.1080/00343404.2013.806793
- Feenstra, R. C., & Hanson, G. H. (1996). Globalization, outsourcing, and wage inequality. American Economic Review, 86(2), 240–245.
- Feldman, M. P., & Audretsch, D. B. (1999). Innovation in cities: Science-based diversity, specialization and localized competition. European Economic Review, 43(2), 409–429. https://doi.org/10.1016/S0014-2921(98)00047-6
- Feldman, M., Guy, F., & Iammarino, S. (2021). Regional income disparities, monopoly and finance. Cambridge Journal of Regions, Economy and Society, 14(1), 25–49. https://doi.org/10.1093/cjres/rsaa024
- Firpo, S., Fortin, N. M., & Lemieux, T. (2011). Occupational tasks and changes in the wage structure. IZA Discussion Paper No. 5542.
- Firpo, S., Fortin, N. M., & Lemieux, T. (2018). Decomposing wage distributions using recentered influence function regressions. Econometrics Journal, 21(3), 287–307. http://dx.doi.org/10.3390/econometrics6020028
- Fitjar, R. D., & Timmermans, B. (2019). Relatedness and the resource curse: Is there a liability of relatedness? Economic Geography, 95(3), 231–255. https://doi.org/10.1080/00130095.2018.1544460
- Florida, R. (2006). The flight of the creative class: The new global competition for talent. Liberal Education, 92(3), 22–29.
- Florida, R. (2017). The new urban crisis: Gentrification, housing bubbles, growing inequality, and what we can do about it. Basic Books.
- Foray, D. (2014). Smart specialisation: Opportunities and challenges for regional innovation policy. Routledge.
- Ganong, P., & Shoag, D. (2017). Why has regional income convergence in the U.S. declined? Journal of Urban Economics, 102, 76–90. https://doi.org/10.1016/j.jue.2017.07.002
- Gao, J., & Zhou, T. (2018). Quantifying China’s regional economic complexity. Physica A: Statistical Mechanics and its Applications, 492, 1591–1603. https://doi.org/10.1016/j.physa.2017.11.084
- Glaeser, E. L. (1992). Growth in cities. Journal of Political Economy, 100(6), 1126–1152. https://doi.org/10.1086/261856
- Goos, M., Manning, A., & Salomons, A. (2009). Job polarization in Europe. American Economic Review, 99(2), 58–63. https://doi.org/10.1257/aer.99.2.58
- Gyourko, J., Mayer, C., & Sinai, T. (2013). Superstar cities. American Economic Journal: Economic Policy, 5(4), 167–199. https://doi.org/10.1257/pol.5.4.167
- Hane-Weijman, E. (2021). Skill matching and mismatching: Labour market trajectories of redundant manufacturing workers. Geografiska Annaler: Series B, Human Geography, 103(1), 21–38. https://doi.org/10.1080/04353684.2021.1884497
- Hane-Weijman, E., Eriksson, R. H., & Henning, M. (2018). Returning to work: Regional determinants of re-employment after major redundancies. Regional Studies, 52(6), 768–780. https://doi.org/10.1080/00343404.2017.1395006
- Hartmann, D., Bezerra, M., Lodolo, B., & Pinheiro, F. L. (2020). International trade, development traps, and the core-periphery structure of income inequality. Economia (pontificia Universidad Catolica Del Peru. Departamento De Economia), 21(2), 255–278. https://doi.org/10.1016/j.econ.2019.09.001
- Hartmann, D., Guevara, M. R., Jara-Figueroa, C., Aristarán, M., & Hidalgo, C. A. (2017). Linking economic complexity, institutions, and income inequality. World Development, 93, 75–93. https://doi.org/10.1016/j.worlddev.2016.12.020
- Hartmann, D., & Pinheiro, F. L. (2022). Economic complexity and inequality at the national and regional level, working paper.
- Hausmann, R., Hidalgo, C. A., Bustos, S., Coscia, M., Simoes, A., & Yildirim, M. A. (2014). The atlas of economic complexity: Mapping paths to prosperity. MIT Press.
- Heinrich Mora, E., Heine, C., Jackson, J. J., West, G. B., Yang, V. C., & Kempes, C. P. (2021). Scaling of urban income inequality in the USA. Journal of the Royal Society Interface, 18(181), 20210223. https://doi.org/10.1098/rsif.2021.0223
- Hidalgo, C., Balland, P. A., Boschma, R., Delgado, M., Feldman, M., Frenken, K., Glaeser, E., He, C., Kogler, D., Morrison, A., Neffke, F., Rigby, D., Stern, S., Zheng, S., & Zhu, S. (2018). The principle of relatedness. In A. Morales, C. Gershenson, D. Braha, A. Minai, & Y. Bar-Yam (Eds.) Springer proceedings in complexity (pp. 451–457). Springer.
- Hidalgo, C., & Hausmann, R. (2009). The building blocks of economic complexity. Proceedings of the National Academy of Sciences, 106(26), 10570–10575. https://doi.org/10.1073/pnas.0900943106
- Holm, J. R., & Østergaard, C. R. (2015). Regional employment growth, shocks and regional industrial resilience: A quantitative analysis of the Danish ICT sector. Regional Studies, 49(1), 95–112. https://doi.org/10.1080/00343404.2013.787159
- Holm, J. R., Østergaard, C. R., & Olesen, T. R. (2017). Destruction and reallocation of skills following large company closures. Journal of Regional Science, 57(2), 245–265. https://doi.org/10.1111/jors.12302
- Iammarino, S., Rodríguez-Pose, A., & Storper, M. (2019). Regional inequality in Europe: Evidence, theory and policy implications. Journal of Economic Geography, 19(2), 273–298. https://doi.org/10.1093/jeg/lby021
- Kekezi, O., & Boschma, R. (2021). Returns to migration after job loss—The importance of job match. Environment and Planning A: Economy and Space, 53(6), 1565–1587. https://doi.org/10.1177/0308518X211004577
- Kemeny, T., Petralia, S., & Storper, M. (2022). Disruptive innovation and spatial inequality. Regional Studies, 1–18. https://doi.org/10.1080/00343404.2022.2076824
- Kemeny, T., & Storper, M. (2020). The fall and rise of interregional inequality: Explaining shifts from convergence to divergence. Scienze Regionali, 19(2), 175–198. https://doi.org/10.14650/97084
- Lee, N. (2011). Are innovative regions more unequal? Evidence from Europe. Environment and Planning C: Government and Policy, 29(1), 2–23. https://doi.org/10.1068/c1046r
- Lee, N. (2016). Growth with inequality? The local consequences of innovation and creativity. In R. Shearmur, C. Carrincazeaux, & D. Doloreux (Eds.), Handbook on the geographies of innovation (pp. 419–431). Edward Elgar.
- Lee, N., & Clarke, S. (2019). Do low-skilled workers gain from high-tech employment growth? High-technology multipliers, employment and wages in Britain. Research Policy, 48(9), 103803. https://doi.org/10.1016/j.respol.2019.05.012
- Lee, N., & Rodríguez-Pose, A. (2013). Innovation and spatial inequality in Europe and USA. Journal of Economic Geography, 13(1), 1–22. https://doi.org/10.1093/jeg/lbs022
- Lee, N., Sissons, P., & Jones, K. (2016). The geography of wage inequality in British cities. Regional Studies, 50(10), 1714–1727. https://doi.org/10.1080/00343404.2015.1053859
- Levy, F., & Murnane, R. J. (2005). The new division of labor: How computers Are creating the next Job market. Princeton University Press.
- Li, L. (2022). Reskilling and upskilling the future-ready workforce for industry 4.0 and beyond. Information Systems Frontiers, 1–16. https://doi.org/10.1007/s10796-022-10308-y
- Lindley, J., & Machin, S. (2014). Spatial changes in labour market inequality. Journal of Urban Economics, 79, 121–138. https://doi.org/10.1016/j.jue.2013.07.001
- Marco, R., Llano, C., & Pérez-Balsalobre, S. (2022). Economic complexity, environmental quality and income equality: A new trilemma for regions? Applied Geography, 139, 102646. https://doi.org/10.1016/j.apgeog.2022.102646
- McCann, P., & Ortega-Argilés, R. (2015). Smart specialization, regional growth and applications to European union cohesion policy. Regional Studies, 49(8), 1291–1302. https://doi.org/10.1080/00343404.2013.799769
- Mendez, R. (2002). Creative destruction and the rise of inequality. Journal of Economic Growth, 7(3), 259–281. https://doi.org/10.1023/A:1020158115979
- Mewes, L., & Broekel, T. (2022). Technological complexity and economic growth of regions. Research Policy, 51(8), October 2022, 104156. https://doi.org/10.1016/j.respol.2020.104156
- Michaels, G., Natraj, A., & Van Reenen, J. (2014). Has ICT polarized skill demand? Evidence from eleven countries over twenty-five years. The Review of Economics and Statistics, 96(1), 60–77. https://doi.org/10.1162/REST_a_00366
- Moretti, E. (2004) Human capital externalities in cities. In: J. Vernon Henderson and Jacques Thisse (Eds) Handbook of Regional and Urban Economics (Vol 4, Ch. 51, pp. 2243–2291). Elsevier.
- Moretti, E. (2010). Local multipliers. American Economic Review, 100(2), 373–377. https://doi.org/10.1257/aer.100.2.373
- Moretti, E. (2012). The new geography of jobs. Houghton Miffling Harcourt.
- Neffke, F., & Henning, M. (2013). Skill relatedness and firm diversification. Strategic Management Journal, 34(3), 297–316. https://doi.org/10.1002/smj.2014
- Neffke, F., Henning, M., & Boschma, R. (2011). How do regions diversify over time? Industry relatedness and the development of new growth paths in regions. Economic Geography, 87(3), 237–265. https://doi.org/10.1111/j.1944-8287.2011.01121.x
- PBL. (2016). De verdeelde triomf (The divided triumph). Planbureau voor de Leefomgeving.
- Pinheiro, F. L., Balland, P. A., Boschma, R., & Hartmann, D. (2022). The dark side of the geography of innovation: Relatedness, complexity, and regional inequality in Europe. Regional Studies, 1–16. https://doi.org/10.1080/00343404.2022.2106362
- Pintar, N., & Scherngell, T. (2021). The complex nature of regional knowledge production: Evidence on European regions. Research Policy, 51(8), 104170. https://doi.org/10.1016/j.respol.2020.104170
- Puga, D. (1999). The rise and fall of regional inequalities. European Economic Review, 43(2), 303–334. https://doi.org/10.1016/S0014-2921(98)00061-0
- Rigby, D. L., Kemeny, T., & Cooke, A. (2017). Plant exit and U.S. imports from low-wage countries. International Economics, 149, 27–40. https://doi.org/10.1016/j.inteco.2016.09.001
- Rigby, D. L., Roesler, C., Kogler, D., Boschma, R., & Balland, P. A. (2022). Do EU regions benefit from smart specialisation principles? Regional Studies, 56(12), 2058–2073. https://doi.org/10.1080/00343404.2022.2032628
- Rodríguez-Pose, A. (2018). The revenge of the places that don’t matter (and what to do about it). Cambridge Journal of Regions, Economy and Society, 11(1), 189–209. https://doi.org/10.1093/cjres/rsx024
- Rodríguez-Pose, A., & Tselios, V. (2009). Education and income inequality in the regions of the European Union. Journal of Regional Science, 49(3), 411–437. https://doi.org/10.1111/j.1467-9787.2008.00602.x
- Rørheim, J., & Boschma, R. (2022). Skill-relatedness and employment growth of firms in times of prosperity and crisis in an oil-dependent region. Environment and Planning A: Economy and Space, 54(4), 676–692. https://doi.org/10.1177/0308518X211066102
- Rosenthal, S. S., & Strange, W. C. (2004). Evidence on the nature and sources of agglomeration economies. Handbook of Regional and Urban Economics, 4, 2119–2171. https://doi.org/10.1016/S1574-0080(04)80006-3
- Rosés, J. R., & Wolf, N. (2018). Regional economic development in Europe, 1900–2010: A description of the patterns.
- Sbardella, A., Pugliese, E., & Pietronero, L. (2017). Economic development and wage inequality: A complex system analysis. PLoS ONE, 12(9), e0182774. https://doi.org/10.1371/journal.pone.0182774
- Terzidis, N., & Ortega-Argiles, R. (2021). Employment polarization in regional labor markets: Evidence from the Netherlands. Journal of Regional Science, 61(5), 971–1001. https://doi.org/10.1111/jors.12521
- Terzidis, N., van Maarseveen, R., & Ortega-Argilés, R. (2017). Employment polarization in local labor markets: the Dutch case. CPB Discussion Paper 358. CPB Netherlands Bureau for Economic Policy Analysis.
- Tian, Z. (2013). Measuring agglomeration using the standardized location quotient with a bootstrap method. Journal of Regional Analysis and Policy, 43(2), 186–197.
- Trapeznikova, I. (2019). Measuring income inequality. IZA World of Labor, July. https://doi.org/10.15185/izawol.462.
- Uhlbach, W. H., Balland, P. A., & Scherngell, T. (2022). Public R&D funding and new regional specialisations: The contingent role of technological relatedness. Industry and Innovation, 29(4), 511–532. https://doi.org/10.1080/13662716.2022.2043147
- Whittle, A., & Kogler, D. F. (2020). Related to what? Reviewing the literature on technological relatedness: Where we are now and where can we go? Papers in Regional Science, 99(1), 97–113. https://doi.org/10.1111/pirs.12481
- Xiao, J., Boschma, R., & Andersson, M. (2018). Industrial diversification in Europe. The differentiated role of relatedness. Economic Geography, 94(5), 514–549. https://doi.org/10.1080/00130095.2018.1444989
- Zhu, S., Yu, C., & He, C. (2020). Export structures, income inequality and urban-rural divide in China. Applied Geography, 115, 102150. https://doi.org/10.1016/j.apgeog.2020.102150