
 ?Mathematical formulae have been encoded as MathML and are displayed in this HTML version using MathJax in order to improve their display. Uncheck the box to turn MathJax off. This feature requires Javascript. Click on a formula to zoom.
ABSTRACT
High-growth firms (HGFs) are important for job creation and productivity growth. We investigate the relationship between product and labour market regulations, as well as the quality of regional governments that implement these regulations, and the development of HGFs across European regions. Using data from Eurostat, the Organisation for Economic Co-operation and Development (OECD), World Economic Forum (WEF), and Gothenburg University, we show that both regulatory stringency and the quality of the regional government relate to the regional shares of HGFs. In particular, we find that the effect of labour and product market regulations is moderated by the quality of regional government. Depending on the quality of regional governments, regulations may have a ‘good, bad or ugly’ influence on the development of HGFs. Our findings contribute to the debate on the effects of regulations and offer important building blocks to develop tailored policy measures that may influence the development of HGFs in a region.
1. INTRODUCTION
Regulations and administrative burdens affect the capacity of firms to innovate, grow and create new jobs. The effectiveness of regulations is linked to the quality of regional public administration and governance. In particular, poor quality of governance and institutions appear to be one of the main obstacles to business development in low-growth regions (Committee of the Regions (CoR), Citation2019a). While there is some theoretical and empirical evidence for the effect of institutional quality on economic growth at the country (Acemoglu et al., Citation2014; Djankov et al., Citation2006) and regional (Charron et al., Citation2014; Charron et al., Citation2019; Rodríguez-Pose & Garcilazo, Citation2015) levels, much less is known about the relationship between institutions and high-growth firms (HGFs) at the regional level.Footnote1
HGFs are receiving substantial attention from policymakers because of their potential to contribute to productivity growthFootnote2 and job creation at the regional level (Coad et al., Citation2014; Henrekson & Johansson, Citation2007). In Europe, these firms alone are responsible for 50% of employment growth, even though HGFs represent only a very small share of all firms (Bravo-Biosca et al., Citation2016; Coad et al., Citation2022). These firms, in their crucial stage of development and growth, may be sensitive to how effectively regional public administrations implement regulations. Despite their small share, HGFs are economically relevant as job creators, tend to have positive spillovers on non-HGFs (Du & Vanino, Citation2021), and have been more resilient during crises in terms of avoiding negative employment effects (Teruel et al., Citation2022). Yet, HGFs are unequally distributed. The Organisation for Economic Co-operation and Development (OECD) and European Commission report evidence of stark differences in the shares of HGFs across countries (European Commission, Citation2016; Schreyer, Citation2000).
A growing number of studies investigate factors explaining the distribution of HGFs across countries. Among macroeconomic factors, the role of regulation in the economic performance of countries is central in the political economy literature. One channel through which regulation can impact growth and employment is via its effect on firm dynamics. Accordingly, there is considerable literature regarding the impact of regulations on entry (Ardagna & Lusardi, Citation2010; Ciccone & Papaioannou, Citation2007; Djankov et al., Citation2002). Only a few studies address the influence of regulation on HGFs (Bravo-Biosca et al., Citation2016; Flachenecker et al., Citation2020), and these examine cross-country differences, leaving the heterogeneity in the distribution of HGFs across regions largely unexplored.
Regional heterogeneity should matter when exploring the link between regulations and HGFs in Europe. The CoR states that the majority of European Union (EU) legislation is implemented by regional and local authorities as they ‘have valuable first-hand experience of applying EU legislation, in close contact with local businesses, social partners, civil society and citizens’.Footnote3 In this regard, the quality of the regional governance may play an important role alongside the level of regulation. Acemoglu et al. (Citation2001) are among the first to highlight the role of institutional quality in explaining the differences in growth rates across countries. Further, several papers empirically identify the causal effects of a better administration on higher income per capita, returns to public policy and local development (Acemoglu et al., Citation2001; Crescenzi et al., Citation2016, Citation2022; Hall & Jones, Citation1999; Jalilian et al., Citation2007).
Despite the key role of government quality at the regional level, no previous study investigates how heterogeneity in the quality of regional governments affects the relationship between regulations and HGFs. Therefore, the main aim of this paper is to examine the mechanisms through which the heterogeneity of government quality affects the interplay between regulations and HGFs. In this context, we hypothesise that regulations might be conducive to prosperity, increasing the regional share of HGFs, when implemented by high-quality regional governments.
To investigate our research question, we match several open-source datasets at the NUTS-2 and one-digit Statistical Classification of Economic Activities in the European Community (NACE) levels from various sources including Eurostat, Gothenburg University, the OECD, the World Economic Forum (WEF), and the European Quality of Government index (QoG). The latter indicator summarises citizens’ and businesses’ experiences with public services in their regions while remaining agnostic on whether these services are provided by local or regional self-governments, or by local and regional branches of national governments (Charron et al., Citation2014). To estimate the direct and moderating role of government quality on the relationship between regulations and the share of HGFs, we use a series of linear regression models. In particular, to observe how the empirical relationship between HGFs and regulation varies with the quality of regional government, we use interaction effects between regulations and quality of government alongside separate regressions for regions with different levels of government quality and for regions that improved or worsened their quality of government. This approach allows us to reveal under what conditions a change in regulatory stringency may influence the shares of HGFs at the regional level.
This paper contributes to the literature on the relationship between HGFs and regional institutional quality and regulation. First, it provides empirical evidence on the direct relation between labour and product market regulations, government quality, and the regional shares of HGFs in Europe. Second, and more importantly, it investigates the interaction between national regulations and regional government quality, exploring the heterogeneity in relationship between regulations and HGFs. We find that the empirical relation between labour and product market regulations and the regional share of HGFs is moderated by the quality of regional government; thus, it is the institutional quality that is the decisive factor turning regulations good, bad, or ugly for the regional development of HGFs shares.
The rest of the paper is structured as follows. Section 2 summarises the literature related to institutions and economic growth as well as HGFs. Section 3 describes the datasets. Section 4 reports the estimation strategy and results. Finally, section 5 discusses the results and concludes.
2. REVIEW OF THE LITERATURE: INSTITUTIONS AND HIGH-GROWTH FIRMS
Given its economic relevance, research on HGFs has gained momentum, with three main lines of research developing in parallel. The first strand looks at the micro-level characteristics explaining the emergence and growth of firms. In a literature survey on firm growth, Storey (Citation2016, p. 122) identifies and classifies 35 characteristics into three categories. The starting resources of the entrepreneur(s), for example, motivation and education; the firm, for example, age and size; and strategy, for example, management and personnel training and market positioning. Generally, HGFs tend to be younger, more international, more innovative and heterogeneously distributed across countries and sectors (Audretsch, Citation2012; Konon et al., Citation2018; Teruel & de Wit, Citation2017). Some specific firm characteristics, such as rapid past employment and export growth, as well as recruiting and training qualified personnel, seem to be good predictors for identifying firms that have a higher likelihood of becoming HGFs (Lopez-Garcia & Puente, Citation2012).
The second line of enquiry considers the local enabling environment. Minghao Li et al. (Citation2016) investigate which local factors are important for stimulating HGFs at the county level in the United States. They find that HGFs are more often located in counties where firms are – on average – larger, educational attainment is higher, and where the location itself is attractive. They also find that HGFs are not necessarily restricted to urban areas, but can also be found in more rural counties. Yet, more peripheral regions may have disadvantages when compared with central regions (Mason et al., Citation2015). Friesenbichler and Hölzl (Citation2020) also examine whether structural regional factors explain differences in HGFs shares across Austrian regions. They observe that higher shares of HGFs are found within regions with a higher degree of digitalisation, industrial specialisation and lower mobility barriers.Footnote4
The third strand of research, to which this paper contributes, investigates regulatory and framework conditions for firm dynamics and economic growth. The role of institutions (e.g., regulations, property rights, statutory laws, etc.) for economic development is generating considerable interest among scholars of political sciences and economics since the 1970s. Public interest theory of regulation, fathered by Pigou and Aslanbeigui (Citation1938), holds that regulation seeks the protection and benefit of the public at large. In contrast, public choice theorists see regulation as socially inefficient and as a tool to create rents for bureaucrats or incumbent firms (McChesney, Citation1987; Niskanen, Citation1971; Shleifer & Vishny, 1997). The empirical evidence on the link between regulatory institutions and economic growth is polarising, mirroring these contrasting approaches. While some work finds a positive relationship between legislation and economic development (Ash et al., Citation2022; Fukumoto, 2008), others provide evidence of a negative relationship between regulatory institutions and indicators of economic development, that is, technology diffusion, productivity and employment growth, as well as firm entry and firm growth (Acemoglu et al., Citation2005; Blanchard, Citation2004; Buccirossi et al., Citation2013; Ciccone & Papaioannou, Citation2007; Lynn et al., Citation1996; Nickell, Citation1997; Nicoletti & Scarpetta, 2003).
Conversely, there is unanimous consensus on the positive role of institutional quality. Hall and Jones (Citation1999) and Acemoglu et al. (Citation2001) highlight the role of institutional quality in explaining the differences in economic development across and within countries. Empirical evidence shows that ‘effective regulation’ is needed for businesses and the whole economy to develop (Jalilian et al., Citation2007). The availability of the regional index of quality of government developed by Charron et al. (Citation2014) has spurred several studies on the role of the institutional endowment, with research reporting a strong link between the quality of regional government and the innovation performance of European regions. Ketterer and Rodríguez-Pose (Citation2018) find, with a subnational analysis, that government effectiveness and the fight against corruption are conducive to regional economic development. Cortinovis et al. (Citation2017) show that regional government quality matters for industry diversification. Agostino et al. (Citation2020) also report strong evidence of the positive relationship between regional institutional quality and total factor productivity of European small and medium-sized firms in the manufacturing industries.
Specific to HGFs, several innovation scholars investigate the relationship between institutions and HGFs. For example, Davidsson and Henrekson (Citation2002) examine the relationship between Swedish institutional setups and entrepreneurial activity, such as firm entry and growth. Their findings suggest that high rates of taxation (of labour and entrepreneurial income) weakens the start-up and scale-up incentives. Further, strict labour security legislation and wage-setting institutions disadvantage smaller firms with good growth prospects. These firms need the flexibility to adjust the number of employees in response to the changes in demand. Flexibility and freedom of contracting may further help these firms achieve their high-growth potential. Henrekson and Johansson (Citation2007) corroborate this hypothesis by finding that labour regulations, especially those that restrict contracting flexibility, are harmful to enterprises that would like to grow rapidly. More recently, Bravo-Biosca et al. (Citation2016) show that stringent employment protection legislation is related to lower shares of both growing and shrinking firms in sectors that are more labour intensive and more innovative, in turn, reducing the speed of the resource reallocation.
Moreover, restrictive product market regulation may affect firms’ investment decisions as well as the decisions on whether to enter or leave the market. High transaction and entry costs may discourage small, young and innovative companies, which are usually unable to obtain sufficient capital or to overcome cost- and non-cost-related barriers to entry and growth. Djankov et al. (Citation2002) analyse data on entry regulation in 85 countries and find that heavy entry regulation benefits only politicians and bureaucrats; further, it is associated with lower quality public and private goods. Falkenhall and Junkka (Citation2009) claim that low barriers to entry and contestable markets are key for the development of HGFs in Sweden. Therefore, the predominant opinion on the effect of regulation on HGFs is that a stringent regulatory framework hampers business growth because high taxes, alongside entry and labour market regulations, create obstacles that start-ups and small firms are neither financially nor organisationally equipped to overcome (Audretsch et al., Citation2022; Belitski et al., Citation2016).
To some extent, in contradiction to this picture, and thus important for our further analysis, the review of Kitching (Citation2006) on regulation and business performance, while also reporting evidence of mainly negative effects of regulation and taxes for business growth and performance, finds occasional evidence of the potential benefits of regulation. For example, statutory audits impose financial discipline on firms and protect society from business malpractice. Further, environmental regulations can stimulate firms to find innovative product and process solutions. In a follow-up review, Kitching et al. (Citation2015) argue and show, with selected case studies, that regulation generates contradictory effects, ‘enabling as well as constraining performance’. A study by Lee et al. (Citation2015) of UK firms finds that regulation is actually less likely to be a problem for HGFs, because ‘presumably in order to grow, the businesses must have succeeded in overcoming some regulatory difficulties or have been lucky enough not to face them’ (p. 189). Lucidi (Citation2012) and Amoroso and Martino (Citation2020) also find that too much flexibility in the labour market may reduce a firm’s ability to attract and retain talented employees.
While the role of formal institutions (e.g., rule of law, regulations, etc.) in firm growth is already studied, there is very little research on the link between informal institutions (e.g., culture, religion, corruption, etc.) and HGFs, let alone the nexus between formal institutions and the implementation of these regulations and their joint impact on HGFs. We identify only two studies. Estrin et al. (Citation2013) study the effect of formal and informal institutions on business growth aspiration and find that higher levels of corruption, weaker property rights, and a larger government significantly constrain entrepreneurial employment growth aspirations. Krasniqi and Desai (Citation2016), exploring the effects of a set of informal institutions and tax rates, trade and customs regulations, and business permits in transition economies, find no robust evidence of the effect of any of these factors on the share of HGFs.
After having reviewed the relevant literature, we think that the quality of regional government may be the missing piece of the puzzle in the understanding of the nexus between regulation and economic outcomes such as the share of HGFs. Local governments, such as regional authorities, are real political and legislative actors in the context of European multilevel governance. They are tasked to implement many regulations as independent or as delegated administrations. Hence, the quality of regional government should be particularly important for HGFs, where the efficiency in processing lengthy administrative procedures is key to avoid the loss of opportunities for firm growth. Therefore, in this paper, we investigate how the quality of regional administrations might be a key factor shaping the growth performance of HGFs and hence regional development, when considering an array of regulatory environments that spans from stringent to flexible.
3. DATA AND DESCRIPTIVE RESULTS
For the empirical analysis, data on business dynamics (entry, exit and share of HGFs) at the region- and one-digit aggregate sector-level are extracted from Eurostat’s Structural Business Statistics (SBS).Footnote5 Regional SBS data are available at the NUTS-2 level for 21 of the 27 EU member states (data for regions in Belgium, Cyprus, Germany, Greece, Ireland and Luxembourg are not available) and for the 2008–20 period, although some regions only report a few years (e.g., data for Polish, Slovenian and Swedish regions are only available between 2011 and 2015, after 2010, or before 2018, respectively). HGFs are defined using the OECD’s definition according to which HGFs are firms with a minimum of 10 employees that realise an employment or turnover growth of more than 20% over three consecutive years. To calculate regional shares of HGFs, we divide the number of HGFs measured in employment by the total population of all active firms.Footnote6
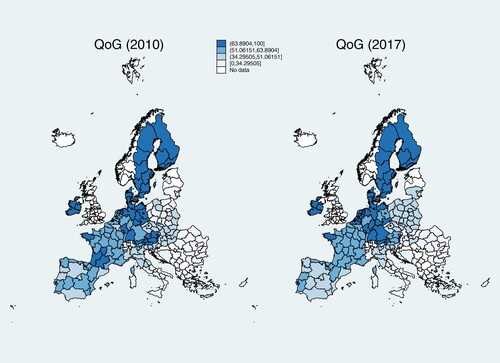
SBS data are matched to the regional European QoG (available for the survey years 2010, 2013, 2017) at the NUTS-2 level, which was developed by the Quality of Government Institute, Gothenburg University (Charron et al., Citation2014, Citation2015, Citation2019), and is the only measure of institutional quality available at the regional level in the EU. This index hinges on experiences with public sector corruption, as well as the extent to which EU citizens believe various public sector services are impartially allocated and of good quality.Footnote7 Maps of Europe shown in display considerable subnational variation, but also show a sizeable change over time and a steady deterioration of performance in old EU member states (Fazekas & Czibik, Citation2021). goes one step further in showing, for each country included in the final sample, the QoG levels in 2010 and 2017. If the observations are above (below) the 45° line, the quality of government has worsened (improved). In the majority of cases, the quality of government institutions has decreased. Notable exceptions are Czechia and Poland.
Figure 1. European Quality of Government index (QoG), (a) 2010 and (b) 2017.
Note: Darker hues indicate higher quality of government. The legend is based on the quartile calculation for 2010.
Source: Authors’ on calculations based on the European Quality of Government index (QoG) from the QoG Institute, Gothenburg University.
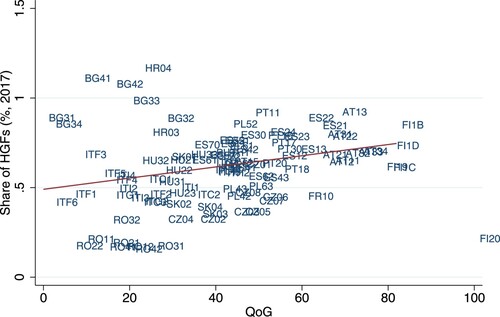
reveals a positive relationship between the QoG index and the average share of HGFs in 2017, where southern Italian regions, such as Abruzzo and Calabria (ITF1 and ITF6, respectively), have low QoG and a lower share of HGFs (less than 0.5%); in contrast, Finnish regions, such as Helsinki-Uusimaa (FI1B) and North & East Finland (FI1D), have some of the highest QoG index scores and higher shares of HGFs (0.73% and 0.85%, respectively). Generally, the average shares of HGFs are very small, ranging from 0% to 3%, with an average of just 0.5%.
Figure 2. Share of high-growth firms and quality of regional government, 2017.
Sources: Authors’ on calculations based on the European Quality of Government index (QoG) from the QoG Institute, Gothenburg University; and Eurostat–SBS data.
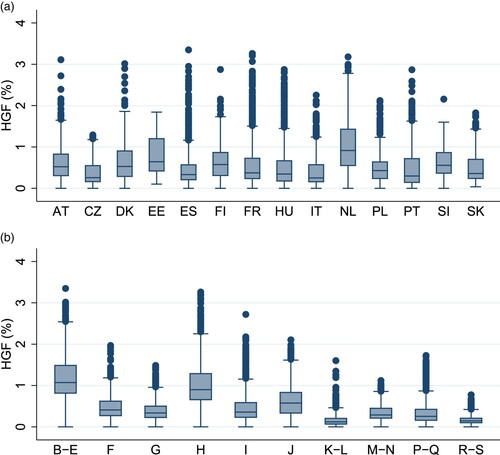
A clear picture of the within-country and sectoral distribution of HGFs is shown in . For the majority of countries, the bulk of HGF shares lies between 0.2% and 0.7%. Exceptions are Estonia and the Netherlands, where, in almost 50% of their regions, more than 1% of firms are HGFs. Variation across sectors is more pronounced. Sectors with the highest concentration of HGFs are Industry (B–E), Transportation and storage (H), and Information and communication (J). Incidentally, these are also the most product market regulated sectors (with the highest averages of product market regulation indicator values of 3.6, 26.0 and 3.2, respectively).Footnote8
Figure 3. Share of high-growth firms by country and sector, average for 2008–18.
Note: The box plots display the first to the third quartiles. The vertical line is the median. Whiskers represent the minimum and maximum.
Countries are: AT = Austria; CZ = Czechia; DK = Denmark; EE = Estonia; ES = Spain; FI = Finland; FR = France; HU = Hungary; IT = Italy; NL = Netherlands; PL = Poland; PT = Portugal; SI = Slovenia; and SK = Slovakia.
Sectors are: B–E: Industry (B = Mining and quarrying; C = Manufacturing; D = Electricity, gas, steam and air-conditioning supply; E = Water supply; sewerage, waste management and remediation activities). F = Construction. G = Wholesale and retail trade; repair of motor vehicles and motorcycles. H = Transport and storage. I = Accommodation and food service activities. J = Information and communication. K–L: K = Financial and insurance activities; L = Real estate activities. M–N: M = Professional, scientific and technical activities; N = Administrative and support service activities. P–Q: P = Education; Q = Human health and social work activities. R–S: R = Arts, entertainment and recreation; and S = Other service activities.
Source: Authors’ calculations based on Eurostat–SBS data.
To measure product market regulation, we use the regulatory impact (REGIMPACT) indicator developed by Égert and Wanner (Citation2016) for the OECD (1975–2018) as a proxy. The indicator follows the same rationale of the product market regulation (PMR) indicator developed by the OECD itself,Footnote9 but has the advantage of being disaggregated by sector (NACE rev.2, two-digit). The indicator measures the indirect impact of regulatory barriers to firm entry, business activities and competition in the Energy, Transport, and Communication sectors on all other sectors in the economy (via intermediate trade networks), covering the 1975–2018 period. The rationale is that sectors using intermediate inputs from regulated sectors are indirectly affected. The indicator has normalised values between 0 (low regulation) and 100 (high regulation). Unfortunately, the indicator is not available for six countries (Bulgaria, Croatia, Latvia, Lithuania, Malta and Romania), leaving our sample with a total of 15 countries. This sample gives us an unbalanced panel of 150 regions and 10 macro-sectors across 11 years.
It is worth noticing that regions with high QoG index scores, for example, Finnish regions, despite their higher-than-EU average level of PMR (stringent product market regulation), have high shares of HGFs. By contrast, Italian regions have a low quality of government, a low PMR level (below the EU average) and a low share of HGFs.
To measure the extent of regulation in the labour market, we use the country-level indicator ‘hiring and firing practices’ from The Global Competitiveness Index Historical Dataset 2007–17 of the WEF (Version 20180712).Footnote10 The original indicator ranges from 1 to 7 (‘In your country, to what extent do regulations allow flexible hiring and firing of workers?’ [1 = not at all; 7 = to a great extent]), but we converted it to a 0–100 scale to have comparable marginal effects. In addition to government quality, and product and labour market regulations, we control for variables that influence the emergence and growth of HGFs (as mentioned in section 2.2), such as access to finance, churn rate, absorptive capacity (measured as regional share of engineers and scientists), share of high-tech employment and growth of GDP per capita.
A description of all variables used in the analysis, alongside their sources and descriptions, is given in . The final sample is a balanced panel dataset of 1450 region–sector pairs (145 regions and 10 macro-sectors) for 11 years (2008–18).
Table 1. Description of the variables.
reports the mean, median, interquartile range (IQR),Footnote11 minimums and maximums for our variables of interest. All variables, except the growth rate of GDP per capita, range from 0 to 100. The average share (across all sectors, regions and years) of HGFs shows that only 5.3 in 1000 firms are HGFs, with some sectors in some regions reporting no HGFs. Given that the median is only 3.7 HGF per 1000 firms, it clarifies that there are some outliers in the upper tail of the distribution. The QoG seems to be normally distributed, with a mean and median of 58 and 57, respectively. Its dispersion (IQR/median) is similar to that of the share of scientists and engineers (HC), albeit much greater than that of the churn and literacy rates.
Table 2. Summary statistics.
reports the correlation coefficients for all the variables used in the analysis. The only two pairs of variables to exhibit a strong correlation () are access to capital and quality of government, and human capital and high-tech employment. gives more insights on the averages of our main variables of interest (HGFs and regulations) by groups of regions. We divide regions into three groups according to their level of government quality (high, medium and low) and into two groups according to whether their level of QoG increased or decreased over the 2010–17 period.
Table 3. Cross-correlation table.
Table 4. Averages of high-growth firms (HGFs) (%), product and labour market regulation, by regions group.
The share of HGFs increases with the level of government quality (column ‘row average’). In terms of regulation, while high QoG regions are, on average, less regulated than the low QoG ones, regions with a medium quality of government are the most regulated, with the highest average product market regulation (4.65) and the lowest labour market flexibility (21.86). There are also noticeable differences between regions where the QoG deteriorated versus those where the QoG did not change or even improved (i.e., as mentioned above, these are mainly regions in the Czechia and Poland). In particular, regions where the QoG improved, or at least did not worsen, are more subject to product market regulation while having a higher degree of labour market flexibility (measured as flexibility of hiring and firing practices). The share of HGFs is larger in regions where QoG worsened by 0.07 percentage points (ppt) compared with those regions where it improved. However, it is important to note that the majority of regions where QoG improved started from a ‘low’ QoG level. The HGFs share is much larger in regions with low but positive long-term QoG growth compared with those with low QoG and negative QoG growth (0.59% versus 0.42%, respectively). All differences between these averages are statistically significant at the 0.01 level.
4. EMPIRICAL ANALYSIS
4.1. Estimation strategy
Using open-source data, we analyse whether government quality and regulations affect the share of HGFs in sector of region
at time
with a linear regression model. More specifically, we estimate both the direct and indirect effects of the quality of institutions. As argued in section 2, the effect of labour and product market regulations on the share of HGFs may depend on the quality of regional institutions. Therefore, our estimating equation is:
(1)
(1) The panel indicator is the region–sector pair
;
is the share of HGFs;
and
are the Quality of Government index as well as product and labour market regulations (PMR and L flex), respectively;
is a set of control variables, including access to capital, availability of human capital, churn rate, share of high-tech employment and past economic development, measured as growth rate of GDP per capita, as well as industry
, region
, country
and year
dummies. The control variables are considered to be predetermined variables and we assume their current and lagged values are uncorrelated with the current error term
. Additionally, all explanatory variables are lagged by one year.Footnote12 Although we are aware that lagging the explanatory variables does not overcome the problem of reverse causality (Bellemare et al., Citation2017), it helps to remove the strong and untestable strict exogeneity assumption
. Indeed, when dealing with institutional variables and economic outcomes, issues of endogeneity may arise (Acemoglu et al., Citation2014; Eicher & Leukert, Citation2009; Tabellini, 2010). The main endogeneity issues are reverse causality – institutions can influence the growth of firms in a region and, in turn, institutions can be shaped by the ability of a region to have a higher share of HGFs – and omitted variables that could influence both the dependent variable and the control variables (Cinelli et al., Citation2022).
To account for endogeneity, we adopt different strategies to select instrumental variables (IV). The first method – generalized method of moments (GMM) estimation of the panel data model with fixed-effects – exploits past values of the endogenous variables. However, the validity of the time lags as instruments may be limited by the high degree of persistence of institutions. Second, among the established instruments for economic institutions, immediate candidates relate to historical variables. Tabellini (Citation2010) argues and shows that historical variables, such as the literacy rate in 1880 and early political constraints on executives, isolate the exogenous variation in culture from the possibly endogenous variation in culture due to the unobserved error term. We adopt the same strategy and use the literacy rate in 1930 as an exogenous determinant of current government quality. Our exclusion restriction assumption implies that the regional literacy rate in the 1930s does not have any direct causal link with the current share of HGFs, but it is positively related to governments and their quality (Porta et al., Citation1999).
While Tabellini’s (Citation2010) dataset is freely available, it only contains 69 regions, many of which belong to countries that are excluded from our sample. Therefore, we use the literacy rate in 1930 from Diebolt and Hippe (Citation2019),Footnote13 which covers 81 regions of six countries available in our sample (Austria, Spain, Finland, France, Italy and Portugal), giving a subsample that represents Southern, Western and Northern Europe.
Finally, to estimate the moderating role of the quality of institutions in the relationship between regulations and the share of HGFs, we use both interaction effects () () and separate regressions for different levels of the index
(three levels chosen according to the 25th and 75th percentiles) () and different levels of the growth of the index
(
and
) ().
Table 5. Instrumental variables (IV) estimation (two-step generalized method of moments – GMM).
4.2. Estimation results
presents results from GMM estimation exploiting past values of the endogenous variables. The direct effect of government quality on the share of HGFs is positive and statistically significant: an increase of 10 points in the QoG score corresponds to an increase of 0.03 ppt in the share of HGFs. Given that the shares of HGFs are very small, with an average across years, sectors and regions of only 0.53%, an increase of 0.03 ppt corresponds to a relative increase of 5.7%. Vice versa, this also means that a decrease in the quality of government corresponds to a reduction of HGFs. In line with previous evidence on the effect of regulation on productivity (Nicoletti & Scarpetta, Citation2003; Scarpetta & Tressel, Citation2002), product market regulation is negatively related to the share of HGFs. The interpretation of all regression coefficients is similar, as all variables are scaled 0–100 (except the growth of GDP per capita): an increase in the stringency of product market regulation score of 10 points corresponds to a decrease in the share of HGFs of 0.07 ppt. A 10-point increase in labour market flexibility corresponds to an increase in the share of HGFs of 0.01 ppt.
The estimated coefficients of the control variables are consistent with prior research. More human capital, easier access to capital, faster resource reallocation via firms’ churn, more employment in high-tech sectors, and past economic growth are all positively related to the regional share of HGFs. Human capital and labour market flexibility have the strongest positive relationship with the share of HGFs. An increase of 10 ppt in the regional share of scientists and engineers (labour market flexibility) corresponds to an increase of 0.17 (0.18) ppt in the share of HGFs, more than a 30% increase over the mean value of 0.53%.
As a robustness check, column 2 of (GMM, not imputed) reports the results using a different method of imputation for the quality of government. Rather than using interpolation, data for the missing years of 2011, 2012, 2014, 2015 and 2016 are replaced with the value of the previous non-missing observation, while data for 2008 and 2009 are replaced with data from the first survey year 2010. Results are almost identical. Columns 3 and 4 of display results from adding an interaction term between the quality of government and either labour market flexibility or product market regulation. The coefficient for the first interaction term is negative and statistically significant, indicating that, as the quality of regional government increases, the positive influence of labour market flexibility on HGFs diminishes. The interaction with product market regulation yields a comparable picture, where the negative influence of such regulation is offset by the higher government quality. The coefficient of the interaction is, however, small and only statistically significant at the 10% level.
As an additional robustness check, we use the literacy rate in 1930 to instrument the quality of government. reports the results of the first stageFootnote14 regression in column 1. To test the robustness of our results in , we run a GMM estimation for the subsample of regions where the literacy rate is available, but without using the literacy rate as an instrument (column 2). Column 3 reports the second stage GMM regression including the fitted value of QoG. The literacy rate is confirmed to be a significant predictor of QoG, along with all other control variables. Columns 2 and 3 look almost identical except for the influence of the quality of government. The coefficient is significant only in the GMM that controls for the endogeneity with a historical variable. As the results for the smaller sample in column 3 are very similar to those in , our use of the ‘GMM-style’ instruments is supported. Finally, reports results from a stepwise panel fixed-effects estimation for comparison.
Table 6. Literacy rate as an instrumental variable (IV).
4.2.1. Heterogeneous quality of government
We further explore the heterogeneity of the influence of regulation on HGFs by estimating three separate regressions according to the average regional level of quality of government: high, medium and low. The values that define the levels are chosen using the 25th and 75th percentiles. Results are reported in . The influence of regulation on the regional share of HGFs greatly varies between the three groups of regions.
Table 7. Instrumental variables (IV) generalized method of moments (GMM) estimation, by level of the European Quality of Government index (QoG).
The share of HGFs in regions with high quality of government is neither affected by the level of product market regulation, nor by more or less flexibility in hiring and firing practices. Among the control variables, access to capital, the churn rate, and human capital have a strong positive association with HGFs, with the latter variable being only significant in regions with a high quality of government. Unlike regions with high-quality administration, in regions with a medium quality of government (which is 50% of our sample), both product and labour market regulation regression coefficients have the signs commonly found in the literature: a negative relationship between the level of product market regulation and the share of HGFs, alongside a positive relationship between labour market flexibility and HGFs. In addition, in regions with medium quality of government, while human capital has no influence in such regions for HGFs, the churn rate and access to capital continue to be important factors, as well as the employment share in technology intensive sectors. Thus, the well-established relationship that less regulation and more flexibility are linked to indicators of economic growth holds for regions where the quality of government is neither high nor low.
Regions with low government quality again differ from regions with a medium quality of government. There, only product market regulation is found to be statistically significant and negative: lower regulation of product markets is associated with a higher share of HGFs. More labour market flexibility is not associated with higher share of HGFs. Moreover, in these regions, past economic development (growth of GDP per capita) is, in contrast to all other regions, a strong factor influencing the increase in HGFs (a 10 ppt increase in the GDP growth rate corresponds to almost a 0.10 ppt increase in the HGFs share, which is a 23% increase over the average for low QoG regions, 0.43%). Again, in contrast to the other two groups of regions, neither the availability of human capital nor the employment share in technology and knowledge intensive sectors correlate with higher shares of HGFs, indicating that the kind of HGFs developed there, may differ with respect to the firm strategy and organisation. Most importantly, however, increases in labour market flexibility do not correspond to higher HGFs shares if the implementation is in the hands of a poorly functioning public administration.
4.2.2. Changes in the quality of government
In the final part of our analysis, we divide the sample into two groups of regions, those experiencing a deterioration in the quality of public institutions between 2010 and 2017, (which as can be seen in corresponds to the vast majority), and those which maintained or even bettered their quality,
. displays the corresponding results. In regions where the quality of institutions decreased, rigidities in both product and labour markets have a negative influence on HGFs. In other words, the expected associations between the different kinds of regulations and the number of HGFs in a region are in place.
Figure 4. European Quality of Government index (QoG), by country, 2010 (vertical axis) and 2017 (horizontal axis).
Source: Authors’ calculations based on the European Quality of Government index (QoG) from the QoG Institute, Gothenburg University.
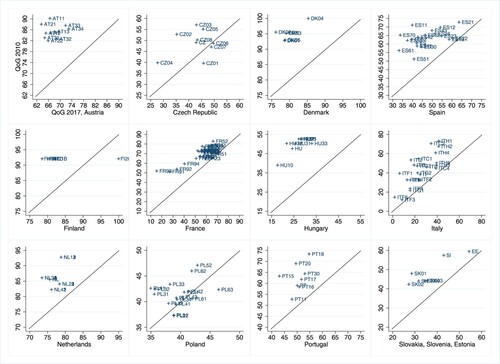
Table 8. Instrumental variables (IV) generalized method of moments (GMM) estimation, by European Quality of Government index (QoG) dynamics.
Table 9. Fixed effects estimation results.
When we focus on regions where institutional quality improved, we observe that the level of regulations does not matter. We interpret this in the sense that, in these regions, where regional governments made efforts to increase the quality of public services, regulation is perceived less as an obstacle by firms, but rather as a necessary part of a well-functioning institutional framework. Compared with the first group, the regional share of HGFs is mainly influenced by human capital, employment in high technology sectors, and past economic growth.
5. DISCUSSION AND CONCLUSIONS
One of the most important steps in the history of the EU was the envisioning and creation of the single market. The free movement of capital, goods, services and people has brought many advantages to its member states, as businesses benefit from easier access to markets across the EU (European Commission, Citation1996). In this context, it is often argued that a common regulatory framework at the European level with harmonised procedures for starting, running, and ending a business would be beneficial for all member states. Yet, leading European business associations lament the uneven integration and enforcement of EU rules across the trading bloc. In a joint statement, BusinessEurope, DIGITALEUROPE, ERT, Eurochambres and EuroCommerceFootnote15 claim that, ‘EU legislation too often allows for differentiated transposition in EU member states and the European Commission’s enforcement policy is lacking teeth against member states which introduce national rules or administrative requirements leading to further market fragmentation’. In this paper, we posit that it is not only the geographical heterogeneity of regulations, but also how efficiently the responsible regional governments implement these regulations that have a direct influence on the regional economic performance and may explain the heterogeneity in the shares of HGFs across European regions. Primarily using open-source data, we analyse how the heterogeneity in the quality of government influences the relationship between regulation and the share of HGFs at the regional level across the EU.
Exploiting the heterogeneity of regulations and of quality of public administration across regions, we show that the relationship between regulations and the share of HGFs depends on the quality of government administrating these regulations. Our results allow for the interpretation that, in regions with a high quality of government, labour and product market regulations are absorbed in a fast, efficient, and impartial way, providing firms with market stability and legal certainty without imposing unnecessary costs on businesses. In these regions, the regional administration creates an environment where high levels of regulation are not harmful to the formation of HGFs, as less flexible hiring and firing regulations are not related to lower shares of HGFs.Footnote16 As mentioned in section 2, one of the essential conditions for firm growth is the ability to recruit and train qualified personnel. HGFs and firms in general are more likely to attract skilled workers when they are able to guarantee a stable job and are willing to invest in upgrading their skills. Similarly, regulation of the product market does not hinder the formation of HGFs when in the hands of a regional administration of high quality, as it is able to efficiently process the number of bureaucratic steps needed to manage HGFs. When in the hands of a high quality of government, regulation can be considered as good for the regional development of HGF.
In regions with medium and, to a lesser extent, in regions with low quality of government, we find that our results converge with the majority of empirical studies analysing regulations and various indicators of economic performance, that is, the less regulation the better. In these regions, more regulated markets are associated with a lower share of HGFs. The less efficient implementation of laws and regulations may increase costs for firms, stunting their growth, thus more regulation is bad for the formation of HGFs. Still, more flexibility in hiring and firing is related to higher shares of HGFs only in regions with medium government quality. This positive relationship disappears in regions with low quality of government, where things could turn ugly. In such regions, regional governments may be implementing regulations in such an unfair or inefficient way that businesses fail to perceive the more flexible labour market regulations as an improvement of the regulatory environment.
Hence, our results confirm the assumptions present in both the public interest theory and the public choice theory regarding the influence of bureaucracies and regulations on firm growth. The findings of our paper suggest that, for firms, unnecessary delays due to time consuming procedures may result in foregone chances to become HGFs, connected to risks of losing to competitors. Delays caused by the need to process many regulations by slow moving public administration, corruption and personal interests, erroneously implemented regulatory requirements, and related procedures can cause substantial costs to growing business. Thus, owners of potential HGFs are likely to respond directly to regulatory barriers caused by low quality public administrations, ultimately not turning their firms into HGFs or maybe moving their firms to other regions. In that sense, it is the quality of regional government that determines whether regulations unfold good, bad or ugly influence on the regional share of HGFs.
Our study has its own limitations. First, we are limited by the quality and availability of data. Without proper IV, it is nearly impossible to identify our regression coefficients and make claims of causality. We used the historical literacy rate as an instrument for the quality of institutions, but this is available only for a subset of regions. Moreover, we are aware that we are not able to capture and solve all endogeneity issues, preventing us from making causal interpretations of our results. One way forward could be the use of synthetic variables generated by the spatial filtering of latent patterns embedded in the spatial structure of regional data (Le Gallo & Páez, Citation2013). Another point of discussion derives from the fact that we use our own definition of HGFs and not the one presented by Eurostat (see section 3). It would be instructive to measure the differences in the regression coefficients using these two different measures of HGFs. This exercise, however, goes beyond the scope of our research question and it is left for future research.
Nonetheless, our results provide new insights into the relationship between regulation, quality of government and HGFs. The quality of regional governments is one important ingredient when evaluating the influence of regulation. A key question for future research is to better understand the enabling factors triggering the creation of a high-quality government. So far, a solid understanding and empirical evidence of the background factors or long-run policies that may lead to a sustainable improvement of government quality is missing. A future avenue for research in this regard could be examining the role of financial independence of municipalities and local budgets. In Nordic countries, income taxes are paid to municipalities, triggering competition between local governments for tax-generating businesses while avoiding costly competition between municipalities for transfers from central government, which can potentially reduce social efficiency, as shown in experimental work on intergroup contests for rents (Abbink et al., Citation2010) between municipalities for grants. As Herrmann (Citation2022) argues, the competition between local governments for tax-generating businesses could induce economic growth by providing better services to local businesses. This suggests that market-preserving federalism (Weingast, Citation1995) could be the mechanism behind the sustainable transition from public choice type of governments, typically characterised by low and medium quality of government, to high-quality public interest governments.
Our results also offer insights for European, national and regional policymakers. To achieve convergence in the shares of HGFs across the EU, firms should operate on a level playing field, with fair and equal conditions for competition, and with high-quality governments. Our results confirm that efforts to increase the quality of government across the EU are needed to further increase economic cohesion across the Union (Rodríguez-Pose & Ketterer, Citation2020). We show that the quality of regional government interacts with how regulations might be perceived by HGFs. At the same time, our finding that, in regions with high-quality government, labour market flexibility is not positively associated with the growth of HGFs indicates that the success of policies aiming to create an ‘economy that works for people’ in the EU (European Commission et al., 2020) also needs high-quality government across the EU. Our paper provides further insights for those policymakers seeking to generate firm growth in regions with low government quality. The deregulation of labour markets might lead to no increase in the share of HGFs unless they start putting effort into improving the quality of regional governments. In that regard, policymakers have to make strategic decisions on whether to invest into efforts that reduce the burdens for firms connected to their regulatory environment or into the quality of their administrative processes, as these investments may also have an impact on what kind of HGFs will be attracted in their regions.
ACKNOWLEDGEMENTS
For their valuable comments, we thank Federico Biagi, Clemens Domnick, Tomaso Duso, Paolo Pasimeni, Francesco Quatraro, Alexander Schiersch and Caroline Stiel, as well as the participants at the DIW Berlin, University of Potsdam seminars, and the University of Economics in Bratislava (EUBA), the 5th Workshop on the Creative Spark in Berlin, the 25th INFER Annual Conference in Valencia, the Concordi 2023 Conference in Seville, and the 2024 Conference of the Verein für Socialpolitik in Berlin. The views expressed are purely those of the authors and may not in any circumstances be regarded as stating an official position of the European Commission or of DIW Berlin.
DISCLOSURE STATEMENT
No potential conflict of interest was reported by the authors.
Notes
1. HGFs are companies with a minimum of 10 employees that are able to sustain a growth of employment or turnover of 20% for three consecutive years.
2. Haltiwanger et al. (Citation2013) provide evidence that HGFs contributed significantly to productivity and job growth in the 1990s and 2000s. Decker et al. (Citation2016) argue that the reported decrease in the rates of HGFs is one of the main contributing factors to the slowdown in US productivity since 2010.
3. See the CoR publication from the 2010 Lisbon Treaty (CoR, Citation2010, p. 3) as well as CoR (Citation2019b).
4. Matthias Duschl et al. (Citation2015) report results in a similar direction for Germany.
5. The data on regional business demography are freely available at https://ec.europa.eu/eurostat/web/regions/data/database/.
6. This calculation of regional shares of HGFs differs from Eurostat’s. Eurostat’s figures on HGFs shares are defined as the number of HGFs divided by the (smaller) number of active enterprises with at least 10 employees (source: https://ec.europa.eu/eurostat/web/products-eurostat-news/-/ddn-20171019-1). Excluding micro-enterprises (firms with nine employees or fewer), however, inflates the shares of HGFs in countries with large proportions of micro-enterprises, that is, , because the denominator
is larger than
. Therefore, to obtain a realistic and unbiased representation of the share of HGFs, we use the total number of active firms as a denominator.
7. The data are freely available at https://www.gu.se/en/quality-government/qog-data/data-downloads/european-quality-of-government-index/.
8. This is not a typo. Transport and warehousing segments are the most affected by entry regulation and public ownership.
9. The sector PMR indicators measure the regulatory barriers to firm entry and competition at the level of individual sectors, with a focus on network industries, professional services and retail distribution (https://stats.oecd.org/index.aspx?DataSetCode=PMR).
10. The dataset is available by searching online for ‘The Global Competitiveness Index Historical Dataset 2007–2017 World Economic Forum’.
11. The IQR measures the middle spread of the data. The ‘Quartile coefficient of variation’ – IQR/median – is a useful alternative to the more standardly used coefficient of variation (standard deviation/mean), because it gives a dimensionless, thus comparable among variables, measure of relative dispersion for non-normally distributed variables.
12. We estimated the same regression model without lagging the explanatory variables and there are no major differences in the sign or the statistical significance of the coefficients. The additional estimates are available from the authors upon request.
13. This dataset is not open access, but available from the authors upon request.
14. The literacy rate is a cross-sectional variable, so we cannot include it in a standard panel fixed effects estimation, as it would drop.
16. These results are in contrast, yet not comparable, with Davidsson and Henrekson’s (2002) findings for Sweden, because they use firm-level data and specifically look at small firms, which unfortunately we cannot do due to the level of aggregation of our data. Further, our sample of regions with a high quality of government includes many Nordic regions of Sweden and Denmark, but also regions of Austria, France, the Netherlands and Spain. Perhaps an analysis of Swedish start-ups and HGFs, accounting for the regional government quality, could yield results comparable with ours.
REFERENCES
- Abbink, K., Brandts, J., Herrmann, B., & Orzen, H. (2010). Intergroup conflict and intra-group punishment in an experimental contest game. American Economic Review, 100(1), 420–447. https://doi.org/10.1257/aer.100.1.420
- Acemoglu, D., Gallego, F. A., & Robinson, J. A. (2014). Institutions, human capital, and development. Annual Review of Economics, 6(1), 875–912. https://doi.org/10.1146/annurev-economics-080213-041119
- Acemoglu, D., Johnson, S., & Robinson, J. A. (2001). The colonial origins of comparative development: An empirical investigation. American Economic Review, 91(5), 1369–1401. https://doi.org/10.1257/aer.91.5.1369
- Acemoglu, D., Johnson, S., & Robinson, J. A. (2005). Institutions as a fundamental cause of long-run growth. Handbook of Economic Growth, 1, 385–472. https://doi.org/10.1016/S1574-0684(05)01006-3
- Agostino, M., Tommaso, M. R. D., Nifo, A., Rubini, L., & Trivieri, F. (2020). Institutional quality and firms’ productivity in European regions. Regional Studies, 54(9), 1275–1288. https://doi.org/10.1080/00343404.2020.1712689
- Amoroso, S., & Martino, R. (2020). Regulations and technology gap in Europe: The role of firm dynamics. European Economic Review, 129(C). https://doi.org/10.1016/j.euroecorev.2020.103551
- Ardagna, S., & Lusardi, A. (2010). Heterogeneity in the effect of regulation on entrepreneurship and entry size. Journal of the European Economic Association, 8(2–3), 594–605. https://doi.org/10.1111/j.1542-4774.2010.tb00529.x
- Ash, E., Morelli, M., & Vannoni, M. (2022). More laws, more growth? Evidence from U.S. states (Technical Report, Discussion Paper No. 15629). Centre for Economic Policy Research (CEPR).
- Audretsch, D. B. (2012). Determinants of high-growth entrepreneurship (Technical Report). OECD/DBA International Workshop, Copenhagen.
- Audretsch, D. B., Belitski, M., Caiazza, R., Günther, C., & Menter, M. (2022). From latent to emergent entrepreneurship: The importance of context. Technological Forecasting and Social Change, 175, 121356. https://doi.org/10.1016/j.techfore.2021.121356
- Belitski, M., Chowdhury, F., & Desai, S. (2016). Taxes, corruption, and entry. Small Business Economics, 47(1), 201–216. https://doi.org/10.1007/s11187-016-9724-y
- Bellemare, M. F., Masaki, T., & Pepinsky, T. B. (2017). Lagged explanatory variables and the estimation of causal effect. The Journal of Politics, 79(3), 949–963. https://doi.org/10.1086/690946
- Blanchard, O. (2004). The economic future of Europe. Journal of Economic Perspectives, 18(4), 3–26. https://doi.org/10.1257/0895330042632735
- Bravo-Biosca, A., Criscuolo, C., & Menon, C. (2016). What drives the dynamics of business growth? Economic Policy, 31(88), 703–742. https://doi.org/10.1093/epolic/eiw013
- Buccirossi, P., Ciari, L., Duso, T., Spagnolo, G., & Vitale, C. (2013). Competition policy and productivity growth: An empirical assessment. The Review of Economics and Statistics, 95(4), 1324–1336. https://doi.org/10.1162/REST_a_00304
- Charron, N., Dijkstra, L., & Lapuente, V. (2014). Regional governance matters: Quality of government within European union member states. Regional Studies, 48(1), 68–90. https://doi.org/10.1080/00343404.2013.770141
- Charron, N., Dijkstra, L., & Lapuente, V. (2015). Mapping the regional divide in Europe: A measure for assessing quality of government in 206 European regions. Social Indicators Research, 122(2), 315–346. https://doi.org/10.1007/s11205-014-0702-y
- Charron, N., Lapuente, V., & Annoni, P. (2019). Measuring quality of government in EU regions across space and time. Papers in Regional Science, 98(5), 1925–1954. https://doi.org/10.1111/pirs.12437
- Ciccone, A., & Papaioannou, E. (2007). Red tape and delayed entry. Journal of the European Economic Association, 5(2–3), 444–458. https://doi.org/10.1162/jeea.2007.5.2-3.444
- Cinelli, C., Forney, A., & Pearl, J. (2022). A crash course in good and bad controls. Sociological Methods & Research 00491241221099552. https://doi.org/10.1177/00491241221099552
- Coad, A., Daunfeldt, S.-O., Hölzl, W., Johansson, D., & Nightingale, P. (2014). High-growth firms: Introduction to the special section. Industrial and Corporate Change, 23(1), 91–112. https://doi.org/10.1093/icc/dtt052
- Coad, A., Harasztosi, P., Pál, R., & Teruel, M. (2022). Policy instruments for high-growth enterprises, pp. 273–298. Springer.
- European Commission. (2016). Science, research and innovation performance of the EU: A contribution to the open innovation, open science, open to the world agenda: 2016. Publications Office.
- European Commission, Director-General for Communication & University of Leyen. (2020). Political guidelines for the next European Commission 2019–2024: Opening statement in the European Parliament plenary session 16 July 2019; speech in the European Parliament plenary session 27 November 2019. Publications Office of the European Union.
- Committee of the Regions (CoR). (2010). A new treaty: A new role for regions and local authorites. Publication Office of the European Union.
- Committee of the Regions (CoR). (2019a). EU policy framework on SMEs: State of play and challenges. Publication Office of the European Union. doi:10.2863/612657
- Committee of the Regions (CoR). (2019b). Working together to bring the EU close to its citizens. Publication Office of the European Union. doi:10.2863/20039
- Cortinovis, N., Xiao, J., Boschma, R., & van Oort, F. G. (2017). Quality of government and social capital as drivers of regional diversification in Europe. Journal of Economic Geography, 17(6), 1179–1208. https://doi.org/10.1093/jeg/lbx001
- Crescenzi, R., De Filippis, F., Giua, M., & Vaquero-Piñeiro, C. (2022). Geographical indications and local development: The strength of territorial embeddedness. Regional Studies, 56(3), 381–393. https://doi.org/10.1080/00343404.2021.1946499
- Crescenzi, R., Di Cataldo, M., & Rodríguez-Pose, A. (2016). Government quality and the economic returns of transport infrastructure investment in European regions. Journal of Regional Science, 56(4), 555–582. https://doi.org/10.1111/jors.12264
- Davidsson, P., & Henrekson, M. (2002). Determinants of the prevalence of start-ups and high-growth firms. Small Business Economics, 19(2), 81–104. https://doi.org/10.1023/A:1016264116508
- Decker, R. A., Haltiwanger, J., Jarmin, R. S., & Miranda, J. (2016). Declining business dynamism: What we know and the way forward. American Economic Review, 106(5), 203–207. https://doi.org/10.1257/aer.p20161050
- Diebolt, C., & Hippe, R. (2019). The long-run impact of human capital on innovation and economic development in the regions of Europe. Applied Economics, 51(5), 542–563. https://doi.org/10.1080/00036846.2018.1495820
- Djankov, S., La Porta, R., Lopez-de Silanes, F., & Shleifer, A. (2002). The regulation of entry. The Quarterly Journal of Economics, 117(1), 1–37. https://doi.org/10.1162/003355302753399436
- Djankov, S., McLiesh, C., & Ramalho, R. M. (2006). Regulation and growth. Economics Letters, 92(3), 395–401. https://doi.org/10.1016/j.econlet.2006.03.021
- Du, J., & Vanino, E. (2021). Agglomeration externalities of fast-growth firms. Regional Studies, 55(2), 167–181. https://doi.org/10.1080/00343404.2020.1760234
- Égert, B., & Wanner, I. (2016). Regulations in services sectors and their impact on downstream industries: The OECD 2013 REGIMPACT indicator (OECD Economic Department Working Papers No. (1303):0_1).
- Eicher, T. S., & Leukert, A. (2009). Institutions and economic performance: Endogeneity and parameter heterogeneity. Journal of Money, Credit and Banking, 41(1), 197–219. https://doi.org/10.1111/j.1538-4616.2008.00193.x
- Estrin, S., Korosteleva, J., & Mickiewicz, T. (2013). Which institutions encourage entrepreneurial growth aspirations? Journal of Business Venturing, 28(4), 564–580. https://doi.org/10.1016/j.jbusvent.2012.05.001
- European Commission. (1996). The impact and effectiveness of the single market (Technical Report). Office for Official Publications of the European Communities.
- Falkenhall, B., & Junkka, F. (2009). High-growth firms in Sweden 1997–2007. Characteristics and development patterns (Technical Report).
- Fazekas, M., & Czibik, Á. (2021). Measuring regional quality of government: The public spending quality index based on government contracting data. Regional Studies, 55(8), 1459–1472. https://doi.org/10.1080/00343404.2021.1902975
- Flachenecker, F., Gavigan, J., Goenaga Beldarrain, X., Pasi, G., Preziosi, N., Stamenov, B., & Testa, G. (2020). High-growth enterprises: Demographics, finance & policy measures (KJ-NA-30077-EN-N).
- Friesenbichler, K., & Hölzl, W. (2020). High-growth firm shares in Austrian regions: The role of economic structures. Regional Studies, 54(11), 1585–1595. https://doi.org/10.1080/00343404.2020.1742316
- Fukumoto, K. (2008). Legislative production in comparative perspective: Cross-sectional study of 42 countries and time-series analysis of the Japan case. Japanese Journal of Political Science, 9(1), 1–19. https://doi.org/10.1017/S1468109907002794
- Hall, R. E., & Jones, C. I. (1999). Why do some countries produce so much more output per worker than others? The Quarterly Journal of Economics, 114(1), 83–116. https://doi.org/10.1162/003355399555954
- Haltiwanger, J., Jarmin, R. S., & Miranda, J. (2013). Who creates jobs? Small versus large versus young. The Review of Economics and Statistics, 95(2), 347–361. https://doi.org/10.1162/REST_a_00288
- Henrekson, M., & Johansson, D. (2007). Competencies and institutions fostering high-growth firms. Foundations and Trends in Entrepreneurship, 5(1), 1–80. https://doi.org/10.1561/0300000026
- Herrmann, B. (2022). Local taxes on economic activity in municipalities in EU member states (JRC129095. JRC Science for Policy Brief). European Commission.
- Jalilian, H., Kirkpatrick, C., & Parker, D. (2007). The impact of regulation on economic growth in developing countries: A cross-country analysis. World Development, 35(1), 87–103. https://doi.org/10.1016/j.worlddev.2006.09.005
- Ketterer, T. D., & Rodríguez-Pose, A. (2018). Institutions vs. ‘first-nature’ geography: What drives economic growth in Europe’s regions? Papers in Regional Science, 97(1), S25–S63. https://doi.org/10.1111/pirs.12237
- Kirk, D. (1969). Europe’s population in the interwar years, volume 3. Taylor & Francis.
- Kitching, J. (2006). A burden on business? Reviewing the evidence base on regulation and small-business performance. Environment and Planning C: Government and Policy, 24(6), 799–814. https://doi.org/10.1068/c0619
- Kitching, J., Hart, M., & Wilson, N. (2015). Burden or benefit? Regulation as a dynamic influence on small business performance. International Small Business Journal, 33(2), 130–147. https://doi.org/10.1177/0266242613493454
- Konon, A., Fritsch, M., & Kritikos, A. S. (2018). Business cycles and start-ups across industries: An empirical analysis of German regions. Journal of Business Venturing, 33(6), 742–761. https://doi.org/10.1016/j.jbusvent.2018.04.006
- Krasniqi, B., & Desai, S. (2016). Institutional drivers of high-growth firms: Country-level evidence from 26 transition economies. Small Business Economics, 47(4), 1075–1094. https://doi.org/10.1007/s11187-016-9736-7
- Le Gallo, J., & Páez, A. (2013). Using synthetic variables in instrumental variable estimation of spatial series models. Environment and Planning A: Economy and Space, 45(9), 2227–2242. https://doi.org/10.1068/a45443
- Lee, N., Sameen, H., & Cowling, M. (2015). Access to finance for innovative SMEs since the financial crisis. Research Policy, 44(2), 370–380. https://doi.org/10.1016/j.respol.2014.09.008
- Lopez-Garcia, P., & Puente, S. (2012). What makes a high-growth firm? A dynamic probit analysis using Spanish firm-level data. Small Business Economics, 39(4), 1029–1041. https://doi.org/10.1007/s11187-011-9321-z
- Lucidi, F. (2012). Is there a trade-off between labour flexibility and productivity growth? Some evidence from Italian firms. In Addabbo, T., & Solinas, G. (Eds.), Non-standard employment and quality of work. Physica-Verlag HD. https://doi.org/10.1007/978-3-7908-2106-2_13
- Lynn, L. H., Reddy, N. M., & Aram, J. D. (1996). Linking technology and institutions: The innovation community framework. Research Policy, 25(1), 91–106. https://doi.org/10.1016/0048-7333(94)00817-5
- Mason, C., Brown, R., Hart, M., & Anyadike-Danes, M. (2015). High growth firms, jobs and peripheral regions: The case of Scotland. Cambridge Journal of Regions, Economy and Society, 8(2), 343–358. https://doi.org/10.1093/cjres/rsu032
- Matthias Duschl, T. B. D. L., Scholl, T., & Raschke, F. (2015). Industry-specific firm growth and agglomeration. Regional Studies, 49(11), 1822–1839. https://doi.org/10.1080/00343404.2013.861059
- McChesney, F. S. (1987). Rent extraction and rent creation in the economic theory of regulation. The Journal of Legal Studies, 16(1), 101–118. https://doi.org/10.1086/467825
- Minghao Li, M. P., Goetz, S. J., & Fleming, D. A. (2016). Location determinants of high-growth firms. Entrepreneurship & Regional Development, 28(1–2), 97–125. https://doi.org/10.1080/08985626.2015.1109003
- Nickell, S. (1997). Unemployment and labor market rigidities: Europe versus North America. Journal of Economic Perspectives, 11(3), 55–74. https://doi.org/10.1257/jep.11.3.55
- Nicoletti, G., & Scarpetta, S. (2003). Regulation, productivity and growth: OECD evidence. Economic Policy, 18(36), 9–72. https://doi.org/10.1111/1468-0327.00102
- Niskanen, W. A. (1971). Bureaucracy & representative government. Routledge.
- Pigou, A. C., & Aslanbeigui, N. (1938). The economics of welfare. Macmillan & Co.
- Porta, R. L., de Silanes, F. L., Shleifer, A., & Vishny, R. (1999). The quality of government. Journal of Law, Economics, and Organization, 15(1), 222–279. https://doi.org/10.1093/jleo/15.1.222
- Rodríguez-Pose, A., & Garcilazo, E. (2015). Quality of government and the returns of investment: Examining the impact of cohesion expenditure in European regions. Regional Studies, 49(8), 1274–1290. https://doi.org/10.1080/00343404.2015.1007933
- Rodríguez-Pose, A., & Ketterer, T. (2020). Institutional change and the development of lagging regions in Europe. Regional Studies, 54(7), 974–986. https://doi.org/10.1080/00343404.2019.1608356
- Scarpetta, S., & Tressel, T. (2002). Productivity and convergence in a panel of OECD industries: Do regulations and institutions matter? (OECD Economics Department Working Papers 342).
- Schreyer, P. (2000). High-growth SMEs and employment (Technical Report 2000/3).
- Shleifer, A., & Vishny, R. W. (1997). A survey of corporate governance. The Journal of Finance, 52(2), 737–783. https://doi.org/10.1111/j.1540-6261.1997.tb04820.x
- Storey, D. J. (2016). Understanding the small business sector. Routledge.
- Tabellini, G. (2010). Culture and institutions: Economic development in the regions of Europe. Journal of the European Economic Association, 8(4), 677–716. https://doi.org/10.1111/j.1542-4774.2010.tb00537.x
- Teruel, M., Amaral-Garcia, S., Bauer, P., Coad, A., Domnick, C., Harasztosi, P., & Pál, R. (2022). COVID-19 and the resilience of European firms: The influence of pre-crisis productivity, digitalisation and growth performance (Technical Report).
- Teruel, M., & de Wit, G. (2017). Determinants of high-growth firms: Why do some countries have more high-growth firms than others? Edward Elgar.
- Weingast, B. R. (1995). The economic role of political institutions: Market-preserving federalism and economic development. The Journal of Law, Economics, and Organization, 11(1), 1–31. https://doi.org/10.1093/oxfordjournals.jleo.a036861