
ABSTRACT
Do quotas raise legislative diversity and reduce inequities between the dominant and minority groups? This paper studies how quota mechanisms affect legislative diversity in 11 countries in Asia Pacific and ethnic equity between groups in three cases. We find that quota mechanisms have improved legislative diversity. However, the socio-economic status of targeted minority groups continues to lag behind the dominant group in each case presented. Our findings highlight the limitations of institutionalist solutions to address deeper structural inequities between ethnic groups.
Introduction
Globally, more than 35 countries have introduced legal and non-legal measures to guarantee the political representation of ethnic minorities in the executive, legislative or regional governments. Currently in Asia, eight countries have reserved seats, candidate or regional quotas to ensure the representation of ethnic minorities at the legislative level. These quota mechanisms, or formal rules that guarantee representation for a particular ethnic group, are often introduced in the hope that the elected minority representatives will not only stand for, but also act for members of the society that identify with a minority group (Kroeber, Citation2018; Krook & O’Brien, Citation2010). Proponents suggest that enhanced descriptive representation could influence and shape the perspective of minority communities towards the political system and improve inter-ethnic relations, even if it is dominated by other groups (Kroeber, Citation2017; Kymlicka, Citation1995; Phillips, Citation1998). But in reality, improved descriptive representation of minorities may not necessarily lead to the substantive representation of minority community interests (Pitkin, Citation1967).
Despite the large scholarship on power-sharing arrangements for post-conflict societies and electoral reforms (Grofman & Lijphart, Citation2003; Horowitz, Citation1985; Kuperman, Citation2016), the intended effects of affirmative action policies such as quotas and how they operate within a particular political context are still understudied and poorly understood. Besides, the extant scholarship on political representation also tends to focus on the descriptive or numerical presence of minorities and are silent on the substantive effects that affirmative action brings to the targeted ethnic communities. Unlike the burgeoning literature on gender quotas (Dahlerup, Citation2007; Franceschet, Krook, Krook, & Dahlerup, Citation2012; Jones, Citation2009; Krook, Citation2009), the types, mechanisms and effects of ethnic quotas are still not well understood.
Our study fills the existing gaps by offering a typology to compare the varied mechanisms designed for ethnic minorities and Indigenous groups to gain formal representation in national legislatures in Asia. Specifically, we compare the provisions of reserved seats, national or party candidate quotas, and reduced minimum thresholds for ethnic candidates to stand in elections and the expected legislative outcomes. Additionally, we attempt to assess the institutional effects on equity between ethnic groups by using demographic statistics and V-Dem's Social Exclusion index in three cases of varied quota mechanisms and regime types in Asia Pacific, namely: (1) Taiwan, with reserved seats for Indigenous groups in special districts; (2) Singapore, with candidate quotas in group constituencies, and (3) Pakistan, with reserved seats for non-Muslims filled through party lists. Drawing from publicly available cross-country datasets, national census and demographic indicators, we examine how the socio-economic status of ethnic minority groups and between-group inequities have changed overtime. This research method that combines cross-country regional analysis and case studies aims to offer more empirical evidence to advance the debate on the types and utility of ethnic quotas in a diverse, ethnically fractionalised post-colonial region.
The first section of this paper highlights the theoretical debates, key terms, a typology of quota mechanisms and their descriptive effects on legislative diversity in Asia Pacific. The second section presents our case analysis of three representative forms of ethnic quota in Singapore, Taiwan and Pakistan in the last three decades. Specifically, we compare the extent to which the economic and educational status of the targeted minority groups have improved vis-à-vis the dominant ethnic group. A summary of key findings and the implications of our work are provided in the conclusion.
Ethnic Quota, Political Representation and Structural Inequity
Ethnicity is a controversial concept. Depending on one's definition of ethnicity,Footnote1 the term ethnic quota can apply to ethnic groups, including those defined along ethno-national, cultural-linguistic or ethno-religious identities (Bird, Citation2014; Reynolds, Citation2005). Ethnic groups might also be categorised based on their political relevance, depending on whether they are active in the national political arena or purposely excluded from political activity (Vogt et al., Citation2015). Our study treats ethnicity as a term that embraces groups differentiated by colour, language and religion, including ‘tribes’, ‘races’, ‘nationalities’ and ‘castes’ (Chandra, Citation2005, p. 236). Our focus is consistent with previous work on ethnicity which identifies ‘costless’ data on ethnic identity and ‘cultural differentiae’ markers that separate insiders from outsiders (Barth, Citation1969; Chandra, Citation2004). These markers might be acquired involuntarily at birth, or adopted voluntarily during a lifetime and often represent costless data sources such as name, features, speech and dress that can be used to categorise ethnic identity (Chandra, Citation2004, p. 37).
Yet, we recognise that ethnic identity is not always categorised systematically or in the same way across cases. States differ in whether ethnic identity is based on self-identification (such as the Indigenous groups in Taiwan) or group-identification (such as the Malays and Indians in Singapore). We also acknowledge the legacy of colonisation and state-centric views in the creation of borders or groups that are considered ‘ethnic’ (Chaudhry, Citation2012, p. 1; Keyes, Citation2002, p. 1171). Some states such as China in the Asia Pacific have historically worked to suppress expressions of ethnicity in favour of ‘national identity’ (Heng, Citation2017; Sathian & Ngeow, Citation2014). Given the politicisation of ethnicity in divided societies, data collection on ethnicity is clearly challenging, especially when ethnic minority groups have been historically discriminated, such as in Vietnam, Myanmar or Indonesia (Csata, Hlatky, & Liu, Citation2021). In our comparative analysis, we draw on national available census data and state-defined criteria to identify the protected minority groups and the declared intention of the quota provisions for the targeted ethnic groups in each case.
Ethnic-based quotas are often created to ‘reassure a linguistic or ethnic or island minority that it has a voice in national affairs’ (Reynolds, Citation2005, p. 308). We use the term ethnic quota broadly here to refer to the formal rules or written agreements outlined in the constitution or law to ensure a minimum number or percentage of representatives or candidates from a particular ethnic group, party or electoral district. Typically, the overt objectives of such quotas are to compensate for past oppression and injustices (Lublin & Wright, Citation2013); protect and share power (Lončar, Citation2015); or prevent conflicts in deeply divided societies (Krook & O’Brien, Citation2010). Quotas are sometimes offered as components of a peace settlement in post-conflict negotiations (Kasapović, Citation2012; Simonsen, Citation2005).
Current literature tends to use ethnic quota and reserved seats interchangeably (see Htun, Citation2004; Reynolds, Citation2005). Similarly, we use the term ethnic quota broadly to include the use of reserved seats, often referring to legislative seats filled either by nomination, or by election to secure the representation of the ethnic minority group more directly, since they guarantee at least as many minority members in the legislature as there are seats foreseen by the reservations.Footnote2 Legislative seats may also be filled through: competitive election in specially created districts (e.g. Scheduled Castes/Scheduled Tribes in India); election by voters registered on separate rolls (e.g. Maoris in New Zealand); the group member receiving the most votes in general elections (e.g. constitutionally recognised ethnic groups in Mauritius); or through designation by parties (non-Muslim minorities in Pakistan).
Our definition of ethnic quota also includes legislated candidate quotas that require a certain number of people from a marginalised ethnic or social group to be candidates in an election. The quota may be imposed on either an open or closed party list of candidates, which a party must fill to be eligible for election. This is seen in Singapore's Group Representative Constituency (GRC) Scheme which mandates every closed, multi-member party list to include either a Malay, Indian or other ethnic minority candidate (Tan & Grofman, Citation2018). Our term also includes the use of regional quota that mandates the distribution of parliamentary seats to representatives of specified regions or groups in a country, such as Samoa's previous system which included two ‘urban electorates’ in larger cities for non-Samoans (Levine & Roberts, Citation2005). There are also other forms of ethnic quota provisions through redrawing electoral districts or gerrymandering (Handley, Citation2020) as seen in India.
Improved descriptive representation is expected to strengthen representational links, create positive attitudes towards government, and encourage political participation (Banducci, Donovan, & Karp, Citation2004). While controversial, guaranteed ethnic representation based on descriptive features is often seen to help protect against discrimination and advance group interests through some degree of real political power (King & Marian, Citation2012). For example, the minority empowerment thesis contends that descriptive representation in legislative bodies is enough to secure some benefit for the minority community, or for the political stability of the country as a whole. Descriptive representation refers to the presence of a particular group based on a representative that resembles the group.
On the other hand, substantive representation emphasises the ability of minority representatives to substantively represent, advocate and defend the interests of their communities (Cianetti & Lončar, Citation2018; Toró, Citation2018). Substantive representation occurs when the representatives act ‘in the interest of the represented, in a manner responsive to them’ (Pitkin, Citation1967, p. 209). This implies that descriptive representation is expected or assumed to enhance substantive representation and lead to improved inter-ethnic relations or better well-being for the targeted minority groups. This view is enforced by literature on diversity dividends, arguing that diversity has a positive impact on development, including on economic growth and social cohesion (De Soysa & Vadlamannati, Citation2017; Kirk, Stein, & Fisher, Citation2018). Increased inclusion of ethnic groups at the political level is found to offset the negative effects related to ethnic fractionalisation and polarisation (Birnir & Waguespack, Citation2011). Hence, improving political representation of ethnic minorities is likely to improve the quality of legislation and the probability of all groups accepting policy implementation (Birnir & Dunford, Citation2014, p. 61). Higher ethnic diversity could lead to positive outcomes such as reduced inequities between ethnic groups and improved socio-economic well-being of minority groups.
In contrast, the scholarship on diversity debits or deficits suggests that diversity deters economic growth and development, and negatively impacts the provision of public goods (Alesina & La Ferrara, Citation2005; Easterly & Levine, Citation1997). This suggests that increased legislative diversity might lead to universal negative impacts for all ethnic groups, including those intended to benefit from improved descriptive representation. Other scholars have found that the quota mechanism and its interaction with the surrounding electoral rules and contextual factors could produce unintended consequences (Htun, Citation2004), or minimal long-term effects (Jensenius, Citation2015). Besides, ethnic quotas could also be easily politicised by parties and quota legislators can end up being perceived as forms of tokenism or symbolic representation, wielding little political influence (Bieber, Citation2008; Tan, Citation2014).
Party politics literature shows that the political influence of elected quota representatives is often limited and channelled through parties instead of representatives (Htun, Citation2004). This means that quota legislators, who are often a minority group, often fail to organise as a collective voice (Kroeber, Citation2017; Templeman, Citation2018). Critics also highlight how the provisions of quotas for only selected groups might negatively impact political competition (Sun, Citation2015); pit minority groups against one another for legal and political status (van Bekhoven, Citation2016); lacks accountability to minority communities or entrenches negative societal views towards the targeted minority group (Franceschet et al., Citation2012). While ethnic quotas could potentially raise the political status of minority groups, they could also end up entrenching the minority status of the protected ethnic groups.
Methodologically, it is challenging to assess the substantive effects of quotas. Currently, studies tend to measure the substantive effects either at the micro-level on the relationship between constituents and single legislators, or the macro-level, focusing on the relations between citizens and whole legislatures (Kroeber, Citation2018). While there are many ways to study substantive representation of ethnic minority legislators (Celis, Childs, Kantola, & Krook, Citation2008; Hänni, Citation2017; Owens, Citation2005; Saalfeld, Citation2011), our study views the reduction of structural inequities between ethnic groups as a substantive goal of quota mechanisms and include this as a key outcome of study. Inequality and inequity are not used interchangeably. Here, inequality refers to an uneven distribution of resources and inequity refers to unfair and often avoidable differences that occur because of poor governance or cultural exclusion (Arcaya, Arcaya, & Subramanian, Citation2015). While ethnic groups sometimes face differing socioeconomic opportunities (structural inequality), we focus on the constraints that make the outcomes inherently unequal, despite equal opportunities or affirmative action such as an ethnic quota.
Forms of Ethnic Quotas in Asia Pacific
Asia is one of the most ethnically fractionalised regions in the world (Fearon, Citation2003; Reilly, Citation2008). It is also one of the regions that has developed specific mechanisms to guarantee the political representation of ethnic minorities even before decolonisation began (Grofman & Handley, Citation2008). Broadly, quota adoption at the legislative level has occurred in waves over three historical periods (1) the 1800s (e.g. New Zealand in 1867); (2) the post-colonisation period after World War II (e.g. India, 1949; Samoa, 1962; Fiji, 1966; Taiwan, 1972; Pakistan, 1973); and (3) the post-third wave of democratisation after the 1980s (e.g. Singapore 1988, Vietnam, 2007) (Tan & Preece, Citation2018).
Here, Asia Pacific refers to a geographical region that includes over 30 countries from East, Southeast, South Asia, Australasia and Oceania. In our regional study, we included quota and non-quota countries of all regime types, including one-party states without competitive, multi-party elections such as China or Vietnam which are typically excluded from comparative studies of ethnic quotas.Footnote3 We also limit our study to specific ethnic minority or Indigenous group representation in the legislature (lower house) and exclude provisions at the executive, senate, judiciary or sub-national level. While we recognise candidate selection, coalition/power-sharing politics and informal practices may affect legislative diversity, we exclude intra-party informal norms or practices for balancing minority/interest groups in party committees/candidate lists. Given the focus on ethnicity, we exclude interest or minority groups such as the military, women or youths that are undifferentiated by colour, language or religion. We also exclude power-sharing arrangements that are not outlined in the constitution or legally enforced. So, it may be the case that ethnic parties or ethnic minority leaders in a country agree to some form of ethnic balancing or consociationalist arrangements as in Burundi, Lebanon, and Northern Ireland (Bogaards, Citation2019; Lemarchand, Citation2007; Lijphart, Citation1969), but these are not considered quota cases in our study.Footnote4
Based on our definition of ethnic quota, we find 11 countries (Bhutan, China, Fiji, India, Nepal, Pakistan, Philippines, Samoa, Singapore, Taiwan and Vietnam) in Asia to have special provisions for ethnic and religious minority groups at the legislative level. Three countries (Myanmar before 2021 coup, Singapore and Pakistan) are known to have legal provisions for ethnic minority representation at the executive (presidential), senate or the state/regional levels. At the time of writing, Bhutan (2008), Fiji (2013), and Samoa (2019) have abolished their legislative quota policies. See .
Table 1. Ethnic quotas in Asia's national legislatures.
shows the varied quota mechanisms for ethnic minority/Indigenous groups for whom seats are reserved; the electoral system, the quota mechanisms; and the percentage of quota threshold or the number of seats reserved at different political levels.
The forms of quota mechanisms adopted in Asia Pacific display interesting patterns. First, the category of ‘groups protected’ or offered legal protection and representation is very broad. The protected groups can refer to Indigenous groups formally recognised by the state (e.g. New Zealand, Fiji and Taiwan) or select ethnicities or castes recognised by the state (e.g. China, Fiji, Myanmar, Nepal, Samoa, Singapore; Vietnam and India). Additionally, it can also refer to religious minorities (e.g. monks in Bhutan and non-Muslims in Pakistan) or to a collection of ethnicities and other vaguely defined interest groups such as labourers, peasants, women, disabled and others (e.g. Philippines and Nepal). Clearly, who decides and how the groups are identified for protection or gain recognition requires further study. Besides, given the vague selection process and lack of specificity on the amalgamation of interest and ethnic groups in the latter two cases, disaggregating and studying the quota effects will be challenging.
Second, reserved seats and candidate quotas are the two most preferred mechanisms for ethnic /Indigenous groups in Asia. While Htun (Citation2004) found ethnic groups tend to get reserved seats while women are offered candidate quotas, in Asia, ethnic/Indigenous groups are guaranteed legislative seats through both mechanisms. There is little evidence of regional ‘learning’ when it comes to ethnic quotas in this region.Footnote5 While we have identified three main broad types, none of them operate in the same way. In majoritarian systems such as Singapore, Nepal and Vietnam, candidate quotas place the responsibility of candidate selection on the party selectorate at different stages of the electoral process. In cases of reserved seats with special districts such as in New Zealand, Taiwan, Samoa (until 2018) and India, districts are established for either geographically concentrated minority groups or country-wide constituencies. In Pakistan, the Philippines, Fiji (until 2013) and China, reserved seats are created based on a specific number or a percentage threshold for the different elected/appointed political bodies. Yet, the party list system of reserved seats in Pakistan and the Philippines provides similar powers to the party selectorate as cases with candidate quotas.
Third, electoral geography matters on how certain quota mechanisms operate in practice. This means that ethnic quotas require other measures to be put in place to work effectively. As Handley (Citation2020) in this Special Issue shows, the effectiveness of reserved seats based on special districts will need to consider the spatial concentration and dispersion of the targeted ethnic minorities/Indigenous groups in ensuring fair ethnic balancing of candidates on the party lists. For example, New Zealand has special Maori districts, India includes regional constituencies and Singapore has special group constituencies allocated for Malay or Indian candidates. Additionally, Singapore has an Ethnic Integrated Housing policy to prevent congregation of any one particular ethnic group to congregate in one electoral constituency, while Samoa previously had special districts for non-Samoan ‘urban electorates’, before its quota system was lifted in 2018.
Legislative Diversity in Asia
Our regional study based on electoral results finds that overall, the varied ethnic quota mechanisms have met or raised the level of ethnic-Indigenous legislative representation in almost all quota countries in their latest legislative/general election. See for the legislative representation of ethnic/Indigenous groups for the most recent election in the region. In fact, the percentage of elected ethnic/Indigenous legislators to total legislators in both Singapore (29%) and New Zealand (21%) have surpassed their legislated quota allocation of 18.3% and 5.8% respectively. In other cases, such as Taiwan, Vietnam and China, the quota allocation provides the targeted minority group with a larger portion of legislative seats than their total share of the population. This means the targeted ethnic minority groups in many Asia-Pacific countries with quotas are over-represented in the legislature, relative to their group's national population average. But as the later discussion shows, the provision of reserved seats in Pakistan (2.9%) and Taiwan (5.3%) have acted as a ‘ceiling’ to deter more minority representatives from being elected outside of the quota system. In Nepal and Vietnam, the descriptive representation of minorities has improved over time but failed to meet the quota threshold in their most recent elections.
Figure 1. Legislative representation of ethnic/Indigenous groups per country (most recent election). Source: Compiled by author from within-country election results data (allcountries.org, Citation2020; Election Commission of India, Citation2018, Citation2019; FAFEN, Citation2018a; IFES, Citation2017; New Zealand Electoral Commission, Citation2020; Singapore Elections Department, Citation2020; Taiwan Central Election Commission, Citation2020; Vietnam Law and Legal Forum, Citation2016).
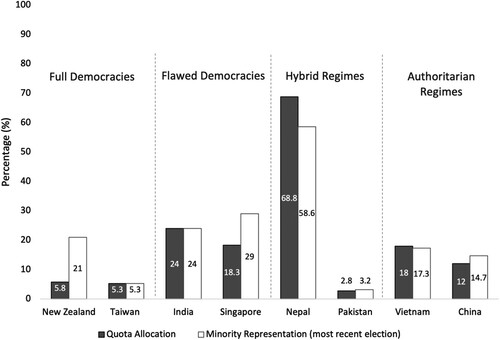
Drawing our regime classification based on the Economist Intelligence Unit (EIU) Democracy Index score, our regional study shows weak correlation between legislative diversity and regime type (EIU, Citation2020). Full democracies such as New Zealand and Taiwan show varied levels of ethnic diversity in their legislatures. New Zealand surpassed its quota allocation, while Taiwan simply met its quota target. Similarly, there is no clear trend for flawed democracies and hybrid regimes. Singapore surpassed its ethnic minority quota requirement, India's ethnic minority level only met the minimum quota designation. Nepal's most recent election resulted in a smaller share of seats for minority representatives than legislated, while Pakistan slightly surpassed its quota.
Similarly, authoritarian one-party states such as Vietnam and China are in no better position in ensuring legislative diversity. While China (14.7%) surpassed its quota allocation of appointed minority representatives in the National People's Congress (NPC) numerically, the detention of Muslim Uighur population in ‘re-education’ camps has received widespread condemnation (BBC, Citation2021). Besides, Vietnam has also failed to meet its quota target for its ethnic minorities (17.3%). These findings provide some grounds for future research on the link between regime type and diversity, and the substantive effects of ethnic quotas across different regime types. In the next section, we go beyond numbers to examine how the quota mechanisms operate within the larger institutional and cultural contexts and their effects on equity between ethnic groups in the three selected cases.
Quota Mechanisms and Effects in Taiwan, Singapore and Pakistan
Case studies are essential for thick description and theory-building (Bennet & Elman, Citation2006; Sartori, Citation1991). Here, we selected three cases based on an exploratory research design (Gerring, Citation2017) to better understand how quota mechanisms operate in different institutional contexts, and other intended descriptive and substantive effects on the targeted ethnic communities. Specifically, the three cases are: (1) Taiwan, a competitive, multi-party electoral democracy that has separate reserved Indigenous districts; (2) Singapore, a semi-competitive, hegemonic party system with candidate quotas and districting policies for Malays, Indians and other minority groups; and (3) Pakistan, a military dominant, multi-party system with reserved seats for non-Muslim minorities elected through party lists. Given their varied quota mechanisms, institutional and historical contexts, we study if changes in descriptive representation have improved the substantive socioeconomic outcomes and status of the targeted minority groups, vis-à-vis the dominant group overtime.
Our earlier regional study found that quota mechanisms have met or raised the numerical presence of the targeted ethnic minority groups in all three selection legislatures. In fact, Singapore's candidate quota has led to the overrepresentation of ethnic minority parliamentarians beyond the legislated quota target. Taiwan, on the other hand, has had very few Indigenous candidates elected through the party-list system outside its reserved seats scheme. Pakistan's quota of ten seats reserved for non-Muslims has capped the rise of non-Muslim politicians in the legislature. These case studies highlight how intra-party politics, placement and sequencing of minority candidates in the party slate, and quota enforcement by state institutions state institutions affect how quotas operate and the substantive outcomes on the targeted protected ethnic communities.
Reserved Seats for Indigenous Groups in Taiwan
Representing 16 officially recognised groups, Taiwan's Indigenous peoples make up approximately 2.37% of the total Taiwanese population. Taiwan introduced reserved seats for Indigenous peoplesFootnote6 at the legislative level during a period of non-competitive elections in 1972. The first reserved seats were introduced as a ‘symbolic acknowledgement of the distinctiveness of the Indigenous population’(Templeman, Citation2018, p. 2). Following several constitutional amendments, two nation-wide districts were established with seats for the Highland and Lowland Indigenous groups.Footnote7 The terms ‘highlanders’ and ‘lowlanders’ are used to distinguish the Indigenous population since the Kuomintang Party (KMT) assumed government in 1949. As Taiwan transitioned to a full democracy in the late 1980s, the Highland and Lowland districts and the seat reservation for Indigenous peoples were maintained.Footnote8
Today, three seats are reserved for both the Highland and Lowland districts. Only Indigenous voters can vote for the reserved seats. Indigenous ‘highlanders’ vote for candidates in the island-wide Highland constituency, and Indigenous ‘lowlanders’ vote for candidates in the island-wide Lowland constituency through a single non-transferable vote (SNTV) system (Templeman, Citation2018).
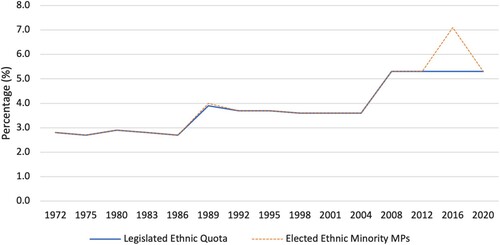
Aside from reserved seats based on highland-lowland classification and from Indigenous voters, Indigenous candidates can also be elected through a separate party-list system, that takes up 30% of the seats in the Legislative Yuan. If parties choose to place Indigenous candidates high on their party lists, the percentage of seats held by Indigenous legislators can surpass the six reserved seats, as seen in the 2016 legislative elections. As shows, two Indigenous candidates won seats through the party-list system in 2016, boosting the total mandated six Indigenous MPs to eight. But in 2020, the only Indigenous candidate included on a party list was ranked 15th on the Democratic Progressive Party's (DPP) list. As the two major parties only each secured 13 party list seats, at the end, no Indigenous candidate was elected outside of the reserved seat system (Taiwan Central Election Commission, Citation2020). The percentage of seats reserved for Indigenous representatives is almost twice as high as the Indigenous share of the population in Taiwan. While this is important, the quota mechanism and electoral system effectively limit the number of Indigenous representatives that can be elected and place significant power in the hands of dominant parties.
Figure 2. Taiwan: Percentage of legislative seats reserved for Indigenous representatives and won by Indigenous representation (1972–2020). Source: Extracted from (Templeman, Citation2018).
Note: The number of non-quota Indigenous MPs is not consistently recorded but has been included as estimates.
The extent to which better legislative representation has improved the socioeconomic status of Indigenous groups is still understudied. While there is no historical violent conflict between the Indigenous population and dominant Han Chinese population, the cultures and languages of Indigenous communities are disappearing. Perceived as an economic ‘underclass’, lazy and with poor work ethic,Footnote9 the Indigenous peoples are typically viewed to be of ‘low social status’ and have ‘very little political and economic influence’ (Vinding & Mikkelsen, Citation2016, p. 246). The long-term historical and contemporary discrimination faced by the Indigenous communities has only recently led to a formal apology by the Taiwanese President Tsai in 2016 (Chan, Citation2016).
Despite Taiwan's economic miracle and boom since the 1970s, the financial benefits have disproportionately benefitted the dominant Han Chinese-Taiwanese people rather than the Indigenous population (Wang, Citation2015, p. 3). The annual income gap between the average Indigenous household and national household has in fact grown from US$3,907.00 in 1985 to US$21,120.00 in 2006 (Huang & Liu, Citation2016, p. 303). Significantly, the total income of Indigenous households still falls well behind the rest of the Taiwanese population. As shows, 25% of Taiwan's Indigenous population receives no income while 40% make between US$700.00 and US$1400.00 per month. While the average salary per month for non-Indigenous Taiwanese citizens is approximately US$1,750 in 2018 (Liao, Citation2018), only 3.5% of total Indigenous citizens receive an average monthly income of US$1,750 to $2,100.
Table 2. Average Monthly Income (US$) for Taiwanese Indigenous Population 2019.
Overall, educational levels have improved for both the Indigenous population and the Taiwanese population. The total percentage of Indigenous students who completed college, university or higher studies has increased from 8.2% in 2000 to more than 25% in 2019. The percentage of the total Taiwanese population who completed higher education was 20.9% in 2000 and 45.1% in 2017. However, as shows, the Indigenous population still lags behind especially in higher tertiary education. Official statistics show the Indigenous population has a lower attainment of higher education by approximately 20% compared to the total Taiwanese population. Further, the Indigenous population also has a higher drop-out rate of 4% in 2010, compared to 2.2% for non-Indigenous students (Hou & Chia-Kai, Citation2012). The differences in educational attainment between the dominant Taiwanese and minority Indigenous students suggest other long term socio-economic impacts and could contribute to the persistence of structural inequities between the minority and majority groups.
Table 3. Highest educational attainment of Taiwanese population over time.
Thus far, findings from the Taiwan case suggest that the formal reserved seat policy has improved the political status of Indigenous peoples. The socioeconomic conditions and educational attainment for Indigenous peoples may have been worse without a legislative quota and the passing of policies, such as the Education Act for Indigenous Peoples (Citation1997). Yet, the direct benefits of these affirmative action policies on the living standards and status of the Indigenous communities needs further study.
Candidate Quotas for Malays in Singapore
Unlike Taiwan, Singapore is a more multiethnic, immigrant society with a population of around 74.3% Chinese; 13.4% Malays, 9% IndiansFootnote10 and 3.2% Others (Singapore Department of Statistics, Citation2018). To prevent ethnic voting and the dominance of Chinese in politics, the ruling People's Action Party (PAP) government introduced a controversial Group Representation Constituency (GRC) scheme in 1988 to guarantee the representation of Malays, Indians and other ethnic minorities in parliament. This scheme effectively changed Singapore's single-member district simple plurality system to a mix of single and multi-member districts based on a first-past-the-post system. The GRC scheme operates as a candidate quota based on plurality party bloc vote – parties competing in multi-member constituencies of four to six candidates must thus include at least one ethnic minority in each slate (Tan, Citation2013; Tey, Citation2008).Footnote11
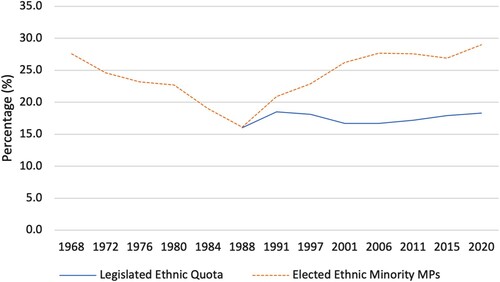
shows that the percentage of elected ethnic minority MPs has surpassed the legislated ethnic quota of 18.3% of total seats since the GRC adoption in 1988. A key reason for the increase in the total elected ethnic MPs is because parties are fielding more than one ethnic minority candidate in each GRC, and more recently in single-member constituencies (SMC) as well.
Figure 3. Singapore: Percentage of legislative seats reserved for ethnic minority representatives and won by ethnic minority representatives (1968–2020). Source: Compiled based on data from (Singapore Elections Department, Citation2020).
As a small country with a history of racial riots, the PAP government is cautious in managing inter-ethnic peace and improving the social welfare of minority groups, especially the Indigenous Malays. Although the GRC scheme includes Indians, Malays and other ethnic minority groups, our study focuses mostly on Malays, who are historically most disadvantaged, compared to other ethnic groups. To date, Malays still struggle with their image as the country's underclass – lazy, underachieving and plagued by social ailments such as drug addiction, divorce and youth delinquency (Alatas, Citation2013; Jiayi, Citation2014; Mutalib, Citation2012). Like Taiwan, Singapore's prosperity has failed to trickle proportionately to the Malays. Statistics from 2016 show that the proportion of Malays (14.6%) in the lower income levels (below SD$1,000) remains greater than its share of the total population. In fact, shows that only 2.1% of Malays belong to the higher income group of SD$20,000 and that the Malay community are overrepresented in the lower strata of Singaporean society.
Table 4. Monthly household income from work by ethnicity (Singapore).
Aside from household income, housing is another indicator of the population's economic well-being in land scarce Singapore. 82% of all residents live in government subsidised Housing Development Board (HDB) dwellings. Only the very rich can afford to own landed properties and private condominiums. Resident household data in shows that more Chinese (6.3%) and Indians (4.4%) own landed properties compared to Malays (0.7%). Likewise, the proportion of Chinese (14.8%) and Indians (14.7%) living in condominiums are significantly higher than Malays (1.8%). Although Malays have bigger family units, they also live in smaller subsidised housing compared to the other ethnic groups. As shows, a large proportion of Malays stay in HDB 1–2 rooms compared to the Chinese and Indians over the last decade.
Table 5. Resident households by type of dwelling and ethnic group of head, 2000–2015.
Aside from the income and housing gaps, available local studies also found differences in education performance between the three ethnic groups (Ismail & Shaw, Citation2006; Mendaki, Citation2014; Senin & Ng, Citation2012). Despite gradual progress,Footnote12 Malay students continue to perform below the national average. For example, the passing rate of Malays for national examinations such as the Primary School Leaving Examination (PSLE), the Singapore-Cambridge General Certificate of Education – Ordinary Levels (‘O’ Levels) as well as the Advanced Levels (‘A’ Levels) is generally lower than that of other ethnic groups (Jiayi, Citation2014, p. 1). The dropout rate after secondary education is also high for Malays (Ministry of Education, Citation2019). While shows that the proportion of Malays attaining university education has increased from 2% in 2000 to 7.7% in 2015, the proportion is still lower than the Chinese (28.4%) and Indians (39.4%).
Table 6. Resident population and highest qualifications attained, 2000–2015.
Despite increased legislative diversity, income, housing and educational attainment gaps demonstrate sustained structural inequities between the dominant Chinese and minority Malay groups. As in Taiwan, it is unclear how the increased number of elected ethnic minority legislators in Singapore have directly brought benefits or helped raise the living standards of the targeted Malay communities. Clearly, further research is needed to investigate the representative role and substantive impact of elected ethnic minority leaders.
Reserved Seats for Non-Muslims in Pakistan
Religion is one of the main societal cleavages in Pakistan. The latest census data shows that there are around 96.2% Muslims, 1.6% Hindus, 1.59% Christians, 0.25% Scheduled Castes, 0.22% Ahmadis and 0.07% ‘other’ minorities (Pakistan Bureau of Statistics, Citation2017). To ensure minority political representation, reserved seats were created for religious minorities (non-Muslims) as part of the 4th Amendment to the 1973 Constitution. After several constitutional amendments, a system of joint electorates was established to allow non-Muslims to vote and contest elections on general seats but also have seats reserved for them in 2002 (Aqeel, Citation2018).Footnote13 While the general seats are elected through a simple plurality system, the seats reserved for non-Muslims are through a PR party-list system based on the total number of general seats won by each party for the National Assembly (minimum threshold of 5%) (The Constitution of Pakistan Citation1973).
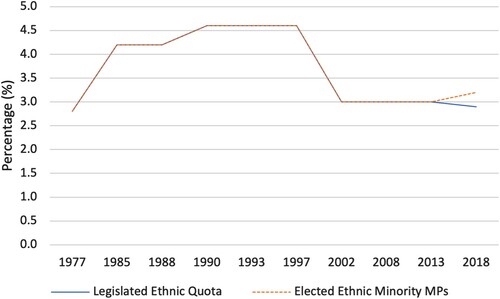
Although Pakistan's total legislative seats increased from 217 to 342, the quota for non-Muslims has remained the same at ten seats since the 1970s. As the reserved seats did not keep up with the enlargement of total legislative seats, the proportion of elected non-Muslims has fallen behind Pakistan's non-Muslim population (around 4%). Further, the lack of ethnic-religious parties means that non-Muslim candidates must be associated with a mainstream party to gain representation through the reserved seat system, leading to a disconnect between communities and quota representatives (Ahmad, Citation2013). As shows, Pakistan's quota policy has acted more as a cap for ethnic minority representation in the Parliament. Thus far, only one non-Muslim candidate has ever been elected outside of the reserved seat system (in 2018) (Khan & Withnall, Citation2018).
Figure 4. Pakistan: Percentage of legislative seats reserved for religious minorities and won by religious minorities (1977–2018). Source: Extracted from (FAFEN, Citation2018b).
Despite religious freedom being one of the country's founding principles and constitutional guarantees, religious minorities still face significant discrimination legally,Footnote14 socially and economically (Freedom House, Citation2020). Non-Muslim minorities are affected by extreme forms of discrimination such as mob attacks, suicide-bomb attacks on their neighbourhoods and forced religious conversions (Fuchs & Fuchs, Citation2020; Ispahani, Citation2018). To alleviate discrimination, an employment quota that reserves 5% of public sector jobs for religious minorities was implemented in 2009. Yet to date, the quota at the Federal level is inconsistently filled. For example, shows no more than 2.9% of all federal government positions were filled by non-Muslims from 2015 to 2019 (PPARC, Citation2016, Citation2017, Citation2018, Citation2019). The lack of compliance with the quota policy is also reported at the provincial level. For example in Punjab, 39% of all positions reserved for minorities in the public sector remained unfilled in 2019 (PPSC, Citation2019). The 10 reserved seats and offers of menial employment in the public sectors mean that religious minorities have little opportunity to improve their socio-economic status (FIDH and HRCP, Citation2015; Khalid & Rashid, Citation2019).
Table 7. Share of non-Muslim federal government employees in Pakistan.
Non-Muslims in Pakistan face socio-economic impediments such as workplace bullying, a lack of respect, exclusion in corporate jobs and lack of job prospects (Alam, Citation2021). Typically, the majority of religious minorities work in the brick, glass, fishing, carpet and agriculture industries, or as sanitation workers.Footnote15 These limited employment opportunities contribute to negative stereotypes of religious minorities as ‘unclean’ (Singh & Syed, Citation2007). For example, Christians were found to face an unemployment rate of 62.9% in Lahore, the country's highest concentration of Christian population (Alter, Younis, & Masih, Citation2012). This is compared to Pakistan's total unemployment rate of 6.2% in 2012 (Pakistan Finance Division, Citation2013).
Pakistan's education system is also discriminatory in its curriculum and fails to provide proper access to religious minorities (FIDH and HRCP, Citation2015). For example, educational policies and school textbooks often stigmatise non-Muslims and distort historical facts, exacerbating religious tensions and discouraging non-Muslim parents from sending their children to school (Rehman, Johns, & Hussain, Citation2019). Non-Muslims also face unfair treatment when accessing higher education. In fact, some universities have implemented a quota to exclude the admission of non-Muslim students.Footnote16 Other disadvantages include university applications requiring students to divulge their religion and take admissions tests with ‘extra credit’ if they had memorised the Quran. Yet, there is no equivalent credit for non-Muslim students (FIDH and HRCP, Citation2015; Rehman et al., Citation2019). Systematic discrimination and poor access to higher education contribute to lower literacy rates among religious minorities. The literacy rate of Christians in Lahore was 69.8%, compared to the overall literacy rate of 74% (Alter et al., Citation2012). The literacy rate among Scheduled Caste Hindus is also significantly lower than other groups, with some studies claiming more than a 20% gap (Minority Rights Group International, Citation2014). The socio-economic and living circumstances of Pakistan's religious minorities are arguably more dire than minority communities in Taiwan and Singapore. Yet, in all three cases structural inequity persists between ethnic groups despite the presence of a legislative ethnic quota.
V-Dem Exclusion by Social Group Index in Taiwan, Singapore and Pakistan
Besides comparing the well-being of the dominant and minority ethnic groups in Taiwan, Singapore and Pakistan based on local census and statistics, we have also attempted to assess changes in ethnic inequities overtime using V-Dem's Exclusion by Social Group Index.Footnote17 V-Dem's Exclusion by Social Group Index is a useful cross-country indicator that offers another measure on the relations between ethnic groups and implications for ethnic inequities based on how ethnic/social groups are treated or denied access to services or participation in governed spaces (Coppedge et al., Citation2021). Countries can score from 0 to 1 on the index, with lower scores indicating a normatively better situation (more inclusive) and higher scores a normatively worse situation (more exclusive) relations between ethnic/social groups.Footnote18
shows that Taiwan, Singapore and Pakistan have all experienced a decrease in social exclusion or rise in ethnic equality since 1960–2020. This means the barriers and discriminatory policies towards ethnic minority groups have been addressed or removed to varying degrees since 1960 in all three cases. Comparatively, Taiwan had the most significant and consistent decrease in social exclusion, moving from a score of 0.64 in 1960 (before quota adoption) to 0.03 in 2020. Singapore had a score of 0.48 in 1960 but has been consistently low since 1980 (just prior to quota adoption), with a score of 0.09 in 2020. Pakistan has experienced the highest fluctuation of social exclusion levels, including a score of 0.35 in 1960 (before quota adoption) to 0.40 in 1980 (following quota amendments) to 0.29 in 2020.
Figure 5. V-Dem Exclusion by Social Group Index: Taiwan, Singapore and Pakistan (1960–2020). Source: Created by author from V-Dem Exclusion by Social Group Index (Coppedge et al., Citation2021).
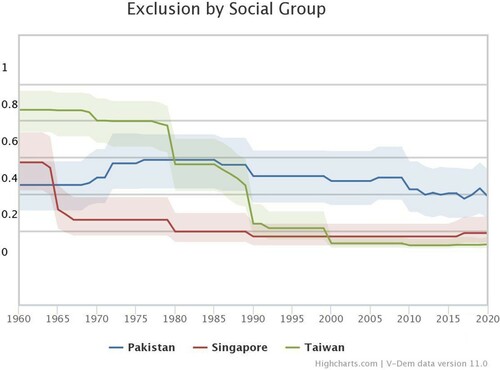
Although all three countries have improved in the level of inclusion faced by ethnic groups over time and since quota adoption, the socioeconomic status of minority groups has not matched that of the dominant group. For example, Indigenous peoples in Taiwan and Malays in Singapore still lag behind the dominant Chinese groups in terms of education, employment and income. While in Pakistan, significant inequities remain between non-Muslims and the rest of the population, despite progress through lower levels of social exclusion.
Implications and Conclusion
Our study aims to add to the library of resources on the types and effects of quota mechanisms on protected ethnic minority/Indigenous groups in Asia Pacific. Drawing from both local and cross-country data and socio-economic indicators, we have also attempted to go beyond numbers to conduct more in-depth studies to compare if formal institutional provisions have improved the socioeconomic status of specific minority groups and relations between dominant and minority groups in Taiwan, Singapore and Pakistan.
Our regional study shows that ethnic quotas have improved descriptive representation and legislative diversity. Most of the quota countries of varied regime types in Asia Pacific have met or raised the number of elected ethnic minorities in their legislatures. Singapore and New Zealand have an overrepresentation of minority legislators and others such as Nepal and Vietnam have failed to meet their targets. On the other hand, the way reserved seats operate in Taiwan and Pakistan have ended up capping the total number of elected minority representatives.
Our study finds no direct link between regime type and ethnic diversity. Who gets recognised, and how an ethnic group/candidate gains recognition or nomination are clear gaps that require more systematic study. Comparing the roles and attitudes towards elected and appointed ethnic legislators across different regime types and electoral systems may reveal if ethnic quotas help advance the interests of the protected ethnic communities. As this special issue also shows, most quota policies require supplementary measures to work effectively. For example, electoral geography affects how quota mechanisms operate in Singapore. Taiwan and Pakistan reveal that institutional mechanisms such as intra-party politics, placement and sequencing of minority candidates in the party slate, and quota enforcement are critical for achieving the intended outcome of quotas. This suggests that in addition to comparative work on the descriptive outcome of ethnic quotas, we should also welcome more in-depth analysis of how quota policies interact and operate within their institutional or electoral context to advance the interests of the respective ethnic communities.
Our study based on V-Dem's Exclusion by Social Group Index of ethnic groups shows that the barriers and discriminatory policies towards ethnic minorities since quota adoption have been reduced to varying degrees from 1960–2020. Overall, Indigenous peoples in Taiwan, Malays in Singapore, and religious minorities in Pakistan have improved in their levels of income, education and employment. All three cases have experienced a decrease in social exclusion and structural inequities over time. However, compared to the dominant group, the Indigenous peoples still earn less income and attain less education in Taiwan. In Singapore, Malays remain disproportionately part of lower income households, live in smaller houses and experience higher rates of failure and drop-outs in education compared to the Chinese. In Pakistan, religious minorities still face lower levels of employment and experience discrimination to accessing higher education vis-à-vis the dominant Muslim population. Comparatively, the socioeconomic and living conditions of Pakistan's religious minorities are more dire than in Taiwan and Singapore.
Quota policies are not a silver bullet solution for all structural inequities between ethnic groups. This study has taken stock of the varied quota policies and their effects on legislative diversity. Despite improvements in descriptive representation and key social indicators for the targeted ethnic groups, inequities remain between the ethnic minority/Indigenous groups and the dominant ethnic group in our selected cases. Our case studies show where more work is needed to understand how quota policies operate in practice and their oversights. In Taiwan, the state's lack of recognition of certain Indigenous groups remains a barrier to legislative diversity. The low ranking of Indigenous candidates on the party-list also deters more descriptive representation. In Singapore, the socioeconomic, housing and educational gaps between Malay and Chinese populations shows that more targeted policies are needed beyond symbolic legislative diversity. Pakistan's quota policy is limited and has failed to evolve with its growing Parliament. More comparative and in-depth studies are required to go beyond numbers and better understand the substantive impact of quota mechanisms on the targeted ethnic communities. Future research should aim to show how institutional designs operate among the larger structural and cultural constraints to improve the inclusion of ethnic groups and reduce structural inequities between ethnic groups.
Acknowledgements
We acknowledge the support of SSHRC for the research of this paper. We are especially grateful to Elaina Nguyen and William Li for their able research assistantship. We also thank our colleagues who provided feedback and support, including those from the WPSA Conference 2019 and the Beyond Numbers Conference 2018.
Disclosure Statement
No potential conflict of interest was reported by the author(s).
Additional information
Funding
Notes on contributors
Netina Tan
Netina Tan is an Associate Professor of Political Science at McMaster University. Her work focuses on authoritarian resilience and the political representation of women and ethnic minorities. She is currently working on research projects related to hegemonic party survival in Singapore and Taiwan, the effects of electoral manipulations and social media on authoritarian regimes, and the substantive representation of elected women and minority leaders. Her work has appeared in Electoral Studies, Commonwealth and Comparative Politics, International Political Science Review, the European Journal of Development Research and is supported by SSHRC, International Development Research Centre, the American Council of Learned Societies and Chiang Ching-Kuo Foundation.
Cassandra Preece
Cassandra Preece is a PhD student in Political Science (Comparative Public Policy) at McMaster University. She is a doctoral research fellow for McMaster's Ethnic Quota and Political Representation research project and is a 2020 Joseph-Armand Bombardier CGS Doctoral Fellow. She has had work experience in government relations and digital advocacy campaigns in Ontario and completed her master's thesis on foreign policy priorities in Canadian federal elections. Her current research interests include elections, ethnic minority representation, ethnic conflict, and political parties in the Asia Pacific. Her work has appeared in the European Journal of Development Research. Email: [email protected]
Notes
1 See (Lublin, Citation2015, p. 2; Reilly, Citation2008, p. 48) for definitions of ethnicity.
2 Also see (Bird, Citation2014, p. 13) for a typology of ethnic quotas which we build on.
3 Including closed authoritarian regimes helps offer insights into why legislative bodies that are not subject to mass democratic pressure would use mechanisms that guarantee representation for ethnic minorities.
4 Reilly's (Citation2020) piece in this Issue discusses other forms of ethnic inclusion.
5 This finding stands in contrast to existing evidence on electoral system reform, which highlights a demonstration or learning effect. In Northeast Asia for example, Taiwan and Japan have shifted from an SNTV system to an MMP system (Batto, Huang, Tan, & Cox, Citation2016).
6 There are 16 officially recognised Indigenous tribes in Taiwan, including the Pangcah/Amis, Atayal, Bunun, Paiwan, Pinuyumayan/Puyuma, Rukai/Drekav, Saisiyat, Tao, Thao, Kebalan/Kavalan, Truku, Cou/Tsou, Sakizaya, Seediq, Kanakanayu, and Hla’alua (Teyra, Citation2015). This excludes other tribes seeking recognition, including many Pingpu tribes who formerly lived in the plains regions of Taiwan. Recent proposals to extend recognition were rejected (van Bekhoven, Citation2016, p. 228).
7 The Japanese identified Indigenous communities along tribal lines during the Japanese colonial era (1895–1945) and tied their status to their place of residency – either in mountain highland or adjoining lowland plains regions.
8 See Templeman (Citation2018) for a further discussion on Indigenous politics before and after democratisation in Taiwan.
9 Alcoholism is cited as a serious challenge to the employment and well-being of Indigenous peoples (Chu, Citation2000).
10 This category includes Tamils, Punjabis, Malyalis, Sindhis, and Guijaratis, among others (Minority Rights Group International, Citation2019).
11 The total number of seats in the GRCs has fluctuated between three and six since 1988. In 2020 GE, there were 14 single member constituencies (SMCs) and 17 GRCs with four to five MPs in each (Types of Electoral Divisions, Citation2020). See Article 39A of Singapore Constitution for details.
12 Since 1991, a Tertiary Tuition Fee subsidy (TTFS) scheme was introduced to help Malay students from low-income families (Aqil, Citation2018).
13 There are also seats reserved for non-Muslims in the provincial assemblies and the Senate (The Constitution of Pakistan Citation1973).
14 Religious minorities are negatively impacted by blasphemy laws (adopted in 1982 and 1986), which provide penalties for blasphemy and other offences against religion. These have been used as tools for religious persecution and disproportionately affect non-Muslims (Ispahani, Citation2018; SADF, Citation2018).
15 Most employed Christians work in sanitation (23.86% in the private sector; 38.26% in the public sector), and only 1.15% of Christians in Lahore were found to own their own business (Alter et al., Citation2012).
16 The Quaid-e-Azam University in Islamabad stipulates that each department may only enrol a total of two non-Muslim students each year (FIDH and HRCP, Citation2015). See also (Jivan & Jacob, Citation2012).
17 V-Dem's defines social group as groups within a country that are differentiated by caste, ethnicity, language, race, region, religion, migration status or some combination (Coppedge et al., Citation2021).
18 The Exclusion by Social Group indicator is determined by aggregating scores measuring social group equality in respect for civil liberties; access to public services by social group; access to state jobs by social group; and access to state business opportunities by social group.
References
- Education Act for Indigenous Peoples. 1997.
- The Constitution of Pakistan. 1973. (Pakistan National Assembly). Retrieved November 23, 2018, from http://www.pakistani.org/pakistan/constitution/
- Ahmad, M. (2013). Minorities: ‘We want elections, not selections’. DAWN.COM. Retrieved October 9, 2018, from http://www.dawn.com/news/802886
- Alam, J. (2021). Religious minorities as victims of poverty: Exploring the socio economic impediments behind their poor economic status in Kohat, Khyber Pakhtunkhwa-Pakistan. Journal of Religious & Theological Information, 20(2), 1–14.
- Alatas, S. H. (2013). The myth of the lazy native: A study of the image of the Malays, Filipinos and Javanese from the 16th to the 20th century and its function in the ideology of colonial capitalism. Oxfordshire: Routledge.
- Alesina, A., & La Ferrara, E. (2005). Ethnic diversity and economic performance. Journal of Economic Literature, 43(3), 762–800.
- allcountries.org. Number of deputies to all the previous National People’s Congresses – China statistics census. Retrieved May 29, 2020, from https://www.allcountries.org/china_statistics/23_1_number_of_deputies_to_all.html
- Alter, N., Younis, K., & Masih, N. (2012). Socio-economic conditions of Christians in Lahore, Pakistan. Lahore, Pakistan: Forman Christian College University.
- Aqeel, A. (2018). Problems with the electoral representation of non-Muslims. Herald Magazine. Retrieved November 9, 2018, from https://herald.dawn.com/news/1154039
- Aqil, H. M. (2018). More Malay students from low-income families to benefit from revision of tertiary tuition fee subsidy scheme. CNA. Retrieved July 12, 2019, from https://www.channelnewsasia.com/news/singapore/more-malay-students-from-low-income-families-to-benefit-from-10024818
- Arcaya, M. C., Arcaya, A. L., & Subramanian, S. V. (2015, June 24). Inequalities in health: Definitions, concepts, and theories. Global Health Action, 8, doi:10.3402/gha.v8.27106
- Banducci, S. A., Donovan, T., & Karp, J. A. (2004). Minority Representation, empowerment, and participation. Journal of Politics, 66(2), 534–556.
- Barth, F. (1969). Ethnic groups and boundaries. Long Grove, IL: Waveland Press, Inc.
- Batto, N., Huang, C., Tan, A. C., & Cox, G. W. (2016). Mixed-member electoral systems in constitutional context: Taiwan, Japan, and beyond. Ann Arbor: University of Michigan Press.
- BBC. (2021). Who are the Uighurs and why is China being accused of genocide? BBC News. Retrieved April 23, 2021, from https://www.bbc.com/news/world-asia-china-22278037
- Bennet, A., & Elman, C. (2006). Qualitative research: Recent developments in case study methods. Annual Review of Political Science, 9(1), 455–476.
- Bieber, F. (2008). Introduction: Minority participation and political parties. In F. Bieber (Ed.), Political parties and minority participation (pp. 5–30). Skopje, Macedonia: Friedrich Ebert Stiftung.
- Bird, K. (2014). Ethnic quotas and ethnic representation worldwide. International Political Science Review, 35(1), 12–26.
- Birnir, J. K., & Dunford, E. (2014). A voice in the process: A cross-national look at ethnic inclusion and economic growth in the world. Development, 57(1), 55–63.
- Birnir, J. K., & Waguespack, D. M. (2011). Ethnic inclusion and economic growth. Party Politics, 17(2), 243–260.
- Bogaards, M. (2019). Consociationalism and centripetalism: Friends or foes? Swiss Political Science Review, 25(4), 519–537.
- Celis, K., Childs, S., Kantola, J., & Krook, M. L. (2008). Rethinking women’s substantive representation. Representation, 44(2), 99–110.
- Chan, R. (2016). Taiwan’s president apologizes to indigenous people for centuries of abuse. Time. Retrieved July 19, 2019, from https://time.com/4433719/taiwan-president-tsai-ing-wen-apologizes-to-indigenous-people/
- Chandra, K. (2004). Why ethnic parties succeed. Cambridge: Cambridge University Press.
- Chandra, K. (2005). Ethnic parties and democratic stability. Perspectives on Politics, 3(02), 235–252.
- Chaudhry, P. (2012). Ethnic minority development in China and ASEAN countries. Policy Paper. UNDP.
- Chu, J.-j. (2000). From incorporation to exclusion: The employment experience of Taiwanese urban aborigines. The China Quarterly, 164, 1025–1043.
- Cianetti, L., & Lončar, J. (2018). Representation of minorities: Perspectives and challenges. Nationalities Papers, 46(2), 197–201.
- Coppedge, M., Gerring, J., Knutsen, C. H., Lindberg, S. I., Teorell, J., Alizada, N., ... Ziblatt, D. (2021). V-Dem [country–year/country–date] Dataset V11.1. Gothenburg: Varieties of Democracy Project. doi:10.23696/vdemds21.
- Csata, Z., Hlatky, R., & Liu, A. H. (2021). How to head count ethnic minorities: Validity of census surveys versus other identification strategies. East European Politics, 37(3), 572–592.
- Dahlerup, D. (2007). Electoral gender quotas: Between equality of opportunity and equality of result. Representation, 43(2), 73–92.
- De Soysa, I., & Vadlamannati, K. C. (2017). Does social diversity impede sound economic management? An empirical analysis, 1980–2012. Rochester, NY: Social Science Research Network. SSRN Scholarly Paper.
- Easterly, W., & Levine, R. (1997). Africa’s growth tragedy: Policies and ethnic divisions. Quarterly Journal of Economics, 112, 1203–1250.
- EIU. (2020). Democracy index 2019: A year of democratic setbacks and popular protest. New York, NY: The Economist Intelligence Unit.
- Election Commission of India. (2018). Seats reserved for SC/ST for Lok Sabha over the years. Election Commission of India. Retrieved August 22, 2019, from https://eci.gov.in/files/file/5521-seats-reserved-for-scst-for-lok-sabha-over-the-years/
- Election Commission of India. (2019). Election results. Election Commission of India. Retrieved April 5, 2021, from https://eci.gov.in/statistical-report/statistical-reports/
- FAFEN. (2018a). Election reports – election Pakistan. Election Pakistan. Retrieved November 25, 2018, from https://electionpakistan.com/election-reports/
- FAFEN. (2018b). FAFEN releases digitized asset details of former lawmakers. Open Parliament Pakistan | An initiative of FAFEN. Retrieved October 16, 2018, from http://openparliament.pk/fafen-releases-digitized-asset-details-of-former-lawmakers/
- Fearon, J. D. (2003). Ethnic and cultural diversity by country. Journal of Economic Growth, 8(2), 195–222.
- FIDH. (2015). Minorities under attack: Faith-based discrimination and violence in Pakistan. Paris, France: International Federation for Human Rights (FIDH). Retrieved from https://www.fidh.org/en/region/asia/pakistan/minorities-under-attack-faith-based-discrimination-and-violence-in
- Franceschet, S., Krook, M. L., Krook, J. M., & Dahlerup, D. (Eds.). (2012). The impact of gender quotas. Oxford: Oxford University Press.
- Freedom House. (2020). Freedom in the world 2020: Pakistan. Washington, DC: Freedom House. Retrieved from https://freedomhouse.org/country/pakistan/freedom-world/2020.
- Fuchs, M.-M., & Fuchs, S. W. (2020). Religious minorities in Pakistan: Identities, citizenship and social belonging. South Asia: Journal of South Asian Studies, 43(1), 52–67.
- Gerring, J. (2017). Qualitative methods. Annual Review of Political Science, 20(1), 15–36. doi:10.1146/annurev-polisci-092415-024158
- Grofman, B., & Handley, L. (Eds.). (2008). Redistricting in comparative perspective. Oxford: Oxford University Press.
- Grofman, B., & Lijphart, A. (Eds.). (2003). Electoral laws and their political consequences. New York, NY: Agathon Press.
- Handley, L. (2020). Drawing electoral districts to promote minority representation. Representation, 0(0), 1–17.
- Hänni, M. (2017). Presence, representation, and impact: How minority MPs affect policy outcomes. Legislative Studies Quarterly, 42(1), 97–130.
- Heng, M. S. H. (2017). A study of nation Building in Malaysia. East Asia: An International Quarterly; Dordrecht, 34(3), 217–247.
- Horowitz, D. L. (1985). Ethnic groups in conflict. Berkeley: University of California Press.
- Hou, H.-I., & Chia-Kai, H. (2012). An analysis of Taiwanese aboriginal students’ educational aspirations. Higher Education Studies, 2(2), 79–99.
- Htun, M. (2004). Is gender like ethnicity? The political representation of identity groups. Perspectives on Politics, 2(3), 439–458.
- Huang, S.-M., & Liu, S.-H. (2016). Discrimination and incorporation of Taiwanese indigenous Austronesian peoples. Asian Ethnicity, 17(2), 294–312.
- IFES. Elections in Nepal: 2017 House of Representatives and State Assembly Elections. Retrieved August 17, 2019, from https://www.ifes.org/sites/default/files/2017_ifes_nepal_house_of_representatives_and_state_assembly_elections_faqs_final_1.pdf.
- Ismail, R., & Shaw, B. J. (2006). Singapore’s Malay-Muslim minority: Social identification in a post-‘9/11’ world. Asian Ethnicity, 7(1), 37–51.
- Ispahani, F. (2018). Constitutional issues and the treatment of Pakistan’s religious minorities. Asian Affairs, 49(2), 222–237.
- Jensenius, F. R. (2015). Development from representation? A study of quotas for the scheduled castes in India. American Economic Journal: Applied Economics, 7(3), 196–220.
- Jiayi, Z. (2014). Debunking the myth of the lazy Malays. Mendaki, 1, 30.
- Jivan, J. J., & Jacob, P. (2012). Life on the margins: A study on the minority women in Pakistan. Lahore, Pakistan: National Commission for Justice and Peace.
- Jones, M. P. (2009). Gender quotas, electoral laws, and the election of women. Comparative Political Studies, 42(1), 56–81.
- Kasapović, M. (2012). Voting rights, electoral systems, and political representation of diaspora in Croatia. East European Politics & Societies and Cultures, 26(4), 777–791.
- Keyes, C. (2002). Presidential address: ‘The peoples of Asia’—Science and politics in the classification of ethnic groups in Thailand, China, and Vietnam. The Journal of Asian Studies, 61(4), 1163–1203.
- Khalid, I., & Rashid, M. (2019). A socio political status of minorities in Pakistan. Journal of Political Studies, 26(1), 59–70.
- Khan, M. Z., & Withnall, A. (2018). Pakistan elects first non-Muslim MP in modern history to general national assembly seat. The Independent. Retrieved October 9, 2018, from https://www.independent.co.uk/news/world/asia/mahesh-kumar-malani-hindu-pakistan-peoples-party-mp-muslim-imran-khan-a8466396.html
- King, R. F., & Marian, C. G. (2012). Minority representation and reserved legislative seats in Romania. East European Politics & Societies, 26(3), 561–588.
- Kirk, T., Stein, D., & Fisher, A. (2018). The relationship between ethnic diversity & development: A diversity dividend? London: Konung International.
- Kroeber, C. (2017). Exploring the impact of reserved seat design on the quality of minority representation. Ethnopolitics, 16(2), 196–216.
- Kroeber, C. (2018). How to measure the substantive representation of traditionally excluded groups in comparative research: A literature review and new data. Representation, 54(3), 241–259.
- Krook, M. L. (2009). Quotas for women in politics: Gender and candidate selection reform worldwide. Oxford: Oxford University Press.
- Krook, M. L., & O’Brien, D. Z. (2010). The politics of group representation: Quotas for women and minorities worldwide. Comparative Politics, 42(3), 253–272.
- Kuperman, A. J. (2016). Constitutional reform to manage ethnic conflict. Ethnopolitics, 15(5), 520–522.
- Kymlicka, W. (1995). Multicultural citizenship: A liberal theory of minority rights. Oxford, UK; New York: Oxford University Press.
- Lemarchand, R. (2007). Consociationalism and power sharing in Africa: Rwanda, Burundi, and the democratic Republic of the Congo. African Affairs, 106(422), 1–20.
- Levine, S., & Roberts, N. S. (2005). The constitutional structures and electoral systems of Pacific Island States. Commonwealth & Comparative Politics, 43(3), 276–295.
- Liao, G. (2018). ‘Taiwan’s average salary is NT$50,000’ doesn’t reflect reality: Minister of labour. Taiwan News. Retrieved August 1, 2019, from https://www.taiwannews.com.tw/en/news/3424171
- Lijphart, A. (1969). Consociational democracy. World Politics, 21(02), 207–225.
- Lončar, J. (2015). Power-Sharing in Kosovo: Effects of ethnic quotas and minority veto. In J. Teokarević, B. Baliqi, & S. Surlić (Eds.), Perspectives of a multiethnic society in Kosovo (pp. 359–373). Belgrade, Prishtina: Youth Initiative for Human Rights.
- Lublin, D. (2015). Minority rules: Electoral systems, decentralization, and ethnoregional party success. Oxford: Oxford University Press.
- Lublin, D., & Wright, M. (2013). Engineering inclusion: Assessing the effects of pro-minority representation policies. Electoral Studies, 32, 746–755.
- Mendaki. (2014). Singapore Malay Muslim community in figures. Singapore: Mendaki.
- Ministry of Education. (2019). 2019 education statistical indicators. Taipei, Taiwan: Ministry of Education. Retrieved August 1, 2019, from https://english.moe.gov.tw/cp-27-18943-e698b-1.html.
- Minority Rights Group International. (2014). Searching for security: The rising marginalization of religious communities in Pakistan. Retrieved March 25, 2019, from https://primarysources.brillonline.com/browse/human-rights-documents-online/searching-for-security-the-rising-marginalization-of-religious-communities-in-pakistan;hrdhrd02092014002.
- Minority Rights Group International. (2019). Singapore Indians. Minority Rights Group. Retrieved July 12, 2019, from https://minorityrights.org/minorities/indians-3/.
- Mutalib, H. (2012). The quest for leadership legitimacy among Singapore Malays. Asian Journal of Political Science, 20(1), 70–85.
- New Zealand Electoral Commission. (2020). 2020 general election official results. Retrieved April 5, 2021, from https://elections.nz/media-and-news/2020/2020-general-election-official-results/.
- Owens, C. T. (2005). Black substantive representation in State Legislatures from 1971–1994. Social Science Quarterly, 86(4), 779–791.
- Pakistan Bureau of Statistics. (2017). Population by religion. Islamabad: Government of Pakistan.
- Pakistan Finance Division. (2013). Population, labour force and employment. Islamabad, Pakistan: Pakistan Finance Division. Retrieved from http://finance.gov.pk/survey/chapters_14/12_population.pdf.
- Paswan, B. (2018). Dalits and women the most under-represented in parliament. The Record Nepal. Retrieved November 26, 2018, from https://www.recordnepal.com/data/dalits-and-women-the-most-under-represented-in-parliament/
- Phillips, A. (1998). Political equality and fair representation. In The politics of presence (pp. 27–56). London: Oxford University Press.
- Pitkin, H. F. (1967). The concept of representation. Berkeley, CA: University of California Press.
- PPARC. (2016). Annual statistical bulleting of Federal Government employees 2015–16. Islamabad, Pakistan: Pakistan Public Administration Research Centre Establishment Division. Retrieved from https://establishment.gov.pk/userfiles1/file/Annual%20Bulletin%20of%20FG%20Employees%20(2017-18).pdf
- PPARC. (2017). Annual statistical bulleting of Federal Government employees 2016–17. Islamabad, Pakistan: Pakistan Public Administration Research Centre Establishment Division. Retrieved from https://establishment.gov.pk/userfiles1/file/Annual%20Bulletin%20of%20FG%20Employees%20(2017-18).pdf
- PPARC. (2018). Annual statistical bulleting of Federal Government employees 2017–18. Islamabad, Pakistan: Pakistan Public Administration Research Centre Establishment Division. Retrieved from https://establishment.gov.pk/userfiles1/file/Annual%20Bulletin%20of%20FG%20Employees%20(2017-18).pdf
- PPARC. (2019). Annual statistical bulleting of Federal Government employees 2018–19. Islamabad, Pakistan: Pakistan Public Administration Research Centre Establishment Division. Retrieved from https://establishment.gov.pk/userfiles1/file/Annual%20Bulletin%20of%20FG%20Employees%20(2017-18).pdf.
- PPSC. (2019). Annual report 2019. Lahore, Pakistan: Punjab Public Service Commission. Retrieved from http://www.ppsc.gop.pk/(S(lqu1neuel2lzh3ngtzlf2p4p))/ppsc_publications/PPSC%20Annual%20Report%202019/index.html.
- Rehman, J., Johns, M., & Hussain, A. (2019). Religious minorities of Pakistan: Report of a parliamentary visit. London, UK: All-Party Parliamentary Group for Pakistani Minorities.
- Reilly, B. (2008). Democracy and diversity: Political engineering in the Asia-Pacific (1st ed.). Oxford: Oxford University Press.
- Reilly, B. (2020). Shifting to Centripetalism in Pacific Asia. Representation.
- Reynolds, A. (2005). Reserved seats in national legislatures: A research note. Legislative Studies Quarterly, 30(2), 301–310.
- Saalfeld, T. (2011). Parliamentary questions as instruments of substantive representation: Visible minorities in the UK House of Commons, 2005–10. The Journal of Legislative Studies, 17(3), 271–289.
- SADF. (2018). POLICY BRIEF 7 – persecution of Christian minorities in Pakistan: Roots, development and present-day realities. Brussels, Belgium: South Asia Democratic Forum.
- Sartori, G. (1991). Comparing and miscomparing. Journal of Theoretical Politics, 3(3), 243–257.
- Sathian, M. R., & Ngeow, Y. M. (2014). Essentialising ethnic and state identities: Strategic adaptations of ethnic Chinese in Kelantan, Malaysia. Asian Studies Review, 38(3), 385–402.
- Senin, N., & Ng, I. Y. H. (2012). Educational aspirations of Malay youths from low-income families in Singapore. Asia Pacific Journal of Social Work and Development, 22(4), 253–265.
- Simonsen, S. G. (2005). Addressing ethnic divisions in post-conflict institution-building: Lessons from recent cases. Security Dialogue, 36(3), 297–318.
- Singapore Department of Statistics. (2018). Singapore in figures. Singapore: Author. Retrieved July 10, 2019, from http://www.singstat.gov.sg/publications/reference
- Singapore Elections Department. (2020). Parliamentary general elections results. Singapore: Singapore Elections Department.
- Singh, S. K., & Syed, M. H. (2007). Human rights in Pakistan (1st ed.). New Delhi, India: Pentagon Press.
- Sun, T.-W. (2015). Governing Singapore: The group representation constituency (GRC) system and its effect on inclusiveness and electoral participation. Asian Education and Development Studies, 4(3), 282–298.
- Taiwan Central Election Commission. (2020). 2020 legislator election. Taipei, Taiwan: Central Election Commission. Retrieved from https://www.cec.gov.tw/english/cms/le/32472
- Tan, N. (2013). Manipulating electoral laws in Singapore. Electoral Studies, 32(4), 632–643.
- Tan, N. (2014). Ethnic quotas and unintended effects on women’s political representation in Singapore. International Political Science Review, 35(1), 27–40.
- Tan, N., & Grofman, B. (2018). Electoral rules and manufacturing legislative supermajority: Evidence from Singapore. Commonwealth & Comparative Politics, 56(3), 273–297.
- Tan, N., & Preece, C. (2018). Quotas, reserved seats and forms of ethnic representation in Asia. For Beyond Numbers: Comparing Mechanisms for Substantive Representation of Ethnic Minorities and Indigenous Peoples Conference, McMaster University, December 5, 2018. Hamilton, Canada.
- Templeman, K. (2018). When do electoral quotas advance indigenous representation?: Evidence from the Taiwanese legislature. Ethnopolitics, 0(0), 461–484.
- Tey, T. H. (2008). Singapore’s electoral system: Government by the people? Legal Studies, 28(4), 610–628.
- Teyra, C. (2015). Who are the Taiwanese indigenous peoples? Ketagalan Media. Retrieved October 7, 2017, from http://www.ketagalanmedia.com/2015/07/07/taiwanese-indigenous-peoples/.
- Toró, T. (2018). Ethnicization or de-ethnicization? Hungarian political representation in the Romanian parliament. Nationalities Papers, 46(2), 219–236.
- “Types of Electoral Divisions”. (2020). Elections department Singapore. Retrieved March 18, 2021, from https://www.eld.gov.sg/elections_type_electoral.html
- van Bekhoven, J. (2016). Identity crisis: Taiwan’s laws and regulations on the status of indigenous peoples. Asia Pacific Law Review, 24(2), 202–232.
- Vietnam Law and Legal Forum. (2016). National election council announces election results for 14th legislature. Retrieved February 14, 2019, from http://vietnamlawmagazine.vn/national-election-council-announces-election-results-for-14th-legislature-5433.html
- Vinding, D., & Mikkelsen, C. (2016). The indigenous world 2016. Copenhagen, Denmark: International Work Group for Indigenous Affairs.
- Vogt, M., Bormann, N.-C., Rüegger, S., Cederman, L.-E., Hunziker, P., & Girardin, L. (2015). Integrating data on ethnicity, geography, and conflict: The ethnic power relations data set family. Journal of Conflict Resolution, 7, 1327–1342.
- Wang, J.-H. (2015). Happiness and social exclusion of indigenous peoples in Taiwan – A social sustainability perspective. PLOS ONE, 10(2), e01183.
- Wei, C. (2018). Exclusive: Demographics of the 13th NPC. NPC Observer. Retrieved February 2, 2019, from https://npcobserver.com/2018/03/10/exclusive-demographics-of-the-13th-npc/