
 ?Mathematical formulae have been encoded as MathML and are displayed in this HTML version using MathJax in order to improve their display. Uncheck the box to turn MathJax off. This feature requires Javascript. Click on a formula to zoom.
Abstract
The aim of this study was to investigate if thrombocytopenic haematology patients show signs of endothelial damage when transfused with platelets and if that damage correlates with platelet increment measured with corrected count increment (CCI). Endothelial damage secondary to radiation or chemotherapy may lead to consumption of transfused platelets but research in this field is scarce. Patients were divided into four groups: Group 1: Acute leukaemia; Group 2: Autologous stem cell transplantation (SCT); Group 3: Allogenic SCT; and Group 4: patients receiving platelets prior to interventions. Blood was sampled before (baseline) and immediately after (0 h) transfusion and then at 1, 4, 8, 16 and 24 h after transfusion. The biomarkers syndecan-1, soluble thrombomodulin (sTM) and vascular endothelial growth factor (VEGF) were analysed. The plasma concentration differences between baseline and later sampling times were referred to as delta (Δ). Fifty-four platelet transfusion events were studied. All biomarkers were within the normal ranges both before and after the transfusions. The Δsyndecan-1 increased at 0 h (p = .02), but there was no significant correlation between Δsyndecan-1 and CCI. There was no change in any of the other biomarkers after transfusion compared to before. There were no differences between the groups and no correlations were found between CCI and C-reactive protein, Δsyndecan-1, ΔsTM or ΔVEGF. There were no signs of endothelial damage before or after platelet transfusions. A transient significant change in syndecan-1 immediately after platelet transfusion did not influence platelet count or platelet CCI.
Trial registration: ClinicalTrials.gov identifier: NCT02601131.
Introduction
Platelet transfusions were introduced as a therapy for irradiation-induced bone marrow damage after the atomic bombings in Japan at the end of World War II [Citation1]. Modern chemotherapy, stem cell transplantation (STC) and oncologic irradiation therapies have increased the demand for platelet transfusions. Alternative therapies with platelet-poor plasma, artificial platelet substitutes, fibrinogen concentrate, desmopressin, recombinant activated factor VII or thrombopoietin have not been able to replace platelet transfusion as the first line of choice to treat or prevent bleeding in oncology/haematology patients with severe thrombocytopenia [Citation2].
Platelet refractoriness, usually defined as an insufficient rise in platelet count (PLC), has several aetiologies including both recipient and storage specific properties () [Citation3,Citation4]. Damage to the endothelium by disease, chemotherapy and radiation has been proposed as an additional mechanism for platelet transfusion refractoriness [Citation4,Citation5], but no studies on this subject have been performed.
Table 1. Factors affecting platelet increment.
There are other reasons to suspect that platelet transfusions might impact endothelial function. Firstly, the pooled platelet concentrates in the studied department have a median volume of 303 ml [Citation6] and that volume is rapidly transfused. Bolus infusions of fluids can disrupt the glycocalyx [Citation7]. In patients with acute myeloid leukaemia (AML), glycocalyx shedding after platelet transfusion could be connected to an increase in the platelet activation biomarker sCD40L [Citation8]. Other concerns are the risks for bacteraemia (secondary to contamination from the venepuncture cannula during donation) and transfusion related lung injury (TRALI) after platelet transfusions. These aspects have not previously been highlighted in glycocalyx research.
The undamaged endothelium is protected by its inner multi-layered glycocalyx, which is composed of glycoproteins and proteoglycans connected to the endothelial cells, creating a semi-permeable membrane separating the circulating blood from the endothelium and holding about 30% of the plasma volume [Citation9]. The undamaged glycocalyx does not seem to promote platelet adherence even if the platelets are activated [Citation10] but research in this area is scarce. The protective glycocalyx and its destruction are increasingly the focus in different clinical situations [Citation9], but there are no studies on the potentially damaging effects of platelet transfusions. Damage to the glycocalyx can be studied by analysing the plasma concentrations of different shedded proteins [Citation11]. Some of the most analysed are syndecan-1, heparan sulphate, hyaluronic acid and chondroitin sulphate. For example, when damaged by sepsis, the glycocalyx loses its ability to control the movement of fluid and larger molecules, leading to a loss of fluid from the microcirculation into the interstitium – this is also called capillary leakage and leads to tissue oedema and organ dysfunction [Citation12].
Shedding of intermediate- and outer-layer glycoproteins not only leads to hypocoagulability through the release of the endogenous heparin (heparan) but also offers a hypercoagulable unprotected cell surface with thrombotic manifestations even if blood laboratory analyses indicate severe hypocoagulability [Citation9,Citation11]. Shedding also affects the binding sites for antithrombin III, thrombomodulin and tissue factor pathway inhibitor – which all have anticoagulant effects in an undamaged glycocalyx. This hypercoagulability of the endothelial surface may lead to consumption of platelets.
Corrected count increment (CCI) is a better parameter than PLC to evaluate platelet increment and refractoriness – but requires calculation of body surface area and measurement of the number of platelets in the platelet concentrate bag to be transfused. CCI after platelet transfusion has been extensively studied [Citation13] and we recently published a prospective study were CCI 24 h after transfusion for the first time was described as linear in different types of haematology patients [Citation6].
Based on the above, this substudy of our original study on CCI [Citation6] aimed to investigate changes in endothelial cell markers after platelet transfusion and its relation to platelet increment in haematological patients.
We hypothesised that increased levels of endothelial biomarkers after a platelet transfusion, as a sign of endothelial damage, are associated with platelet increment.
Methods
The present study is a predefined substudy of a previously published study from our group reporting linear decline of CCI after platelet transfusion in haematological patients [Citation6]. The study obtained ethical approval from the Regional Review Board in Lund (registration number 2015/628) and an approved Biobank (DNR 136, VO IPV, Skane University Hospital [SUS], Lund). The study was conducted in compliance with the Declaration of Helsinki and was a-priori registered as a clinical trial with ClinicalTrials.gov (Identifier: NCT02601131).
All patients 18 years and older who were treated in the Haematology Department at Skåne University Hospital in Lund, Sweden, between 12th of February and 28th of September 2016 and needing platelet transfusions during office hours, were eligible for inclusion (). Bleeding patients were excluded. The known presence of human leukocyte antigen antibodies or human platelet antigen antibodies requiring matched platelet transfusion was also exclusion criterion, however not tested for in all patients. Other exclusion criteria included conditions and treatments with a very high demand for platelet transfusions, further described in the main study [Citation6]. All included patients gave informed and written consent to participate.
Table 2. Patient characteristics.
Platelet transfusions were given at the discretion of the treating physician. According to a standardised protocol for the department, platelet transfusions were considered if the morning PLC was below 10 × 109/L or before interventions such as insertion of a central venous catheter if PLC was below 50 × 109/L.
Blood sampling
Venous blood was sampled using a vacutainer system (Becton, Dickinson and Company [BD], Plymouth, UK) and collected into 3 ml Vacutainer® spray-coated K2EDTA tubes (BD) before and directly after the platelet transfusion, and then at 1, 4, 8, 16 and 24 h after transfusion. The samples were centrifuged at the accredited central laboratory of the hospital and the plasma frozen down to –80 °C within 2 h from sample time. Blood was sampled from the central venous line, if present, after discarding the first 10 ml. Otherwise, blood was retrieved from a peripheral vein. For each patient, no more than two platelet transfusion events were studied.
Patient groups
Patients were divided into four groups based on their condition.
Group 1: Patients undergoing treatment for AML, acute lymphocytic leukaemia (ALL), mixed phenotype acute leukaemia (MPAL) or myelodysplastic syndromes (MDS). All had received intensive chemotherapy.
Group 2: Patients receiving an autologous SCT.
Group 3: Patients receiving an allogeneic SCT following either myeloablative conditioning or reduced-intensity conditioning.
Patients in these groups (1–3) were in a state of bone marrow aplasia, and all of them had central venous access.
Group 4: Patients scheduled for prophylactic platelet transfusion prior to insertion of a central venous catheter. All patients had a morning PLC < 50 × 109/L.
Control group: Patients who were not scheduled for platelet transfusion. Patients in this group had a morning PLC of 10–20 × 109/L and were not given platelet transfusion but blood samples were taken according to the same protocol. The control group was necessary to exclude variations in PLC independent of platelet transfusion.
Platelet concentrates
The platelet concentrates were produced either by direct apheresis or from donated whole blood using the buffy-coat method, in which case the pooled platelet concentrates came from a total of four donors. Both platelet concentrates were suspended in 200 mL platelet additive solution of type PAS-E (T-PAS+, Terumo BCT). Approximately 1/3 of the volume in both types of platelet concentrates was plasma. The PLC in each transfusion bag was measured about 1 h before the transfusion. For surveillance of bacterial contamination, a sample of each platelet concentrate was collected aseptically the day after donation, transferred to a culture bottle and incubated in an automatic blood culture cabinet (BACTEC, Becton Dickinson, Franklin Lakes, NJ, USA). The platelet concentrates were issued for clinical use based on the negative-to-date principle. All transfused platelet units were ABO-matched, leucocyte reduced (<1×10⁶ leucocytes per unit) and ≤7 days old.
Corrected count increment
In the present study, platelet increment was measured with CCI calculated with the formula below [Citation14].
Endothelial cell markers
The endothelial cell markers syndecan-1, sTM and H-VEGF were analysed at the Section for Transfusion Medicine, Capital Region Blood Bank, Copenhagen University Hospital. Plasma vials from the blood samples (see above) were processed through the Department of Laboratory Medicine, SUS, Lund. Ethylenediaminetetraacetic acid (EDTA) blood was centrifuged twice at 1800 g and 5 °C for 10 min each and stored at –86 °C until analysis. The endothelial cell markers were measured by commercially available immunoassays in accordance with the manufacturer’s recommendations.
Syndecan-1
Syndecan-1 is a heparan sulphate proteoglycan and one of the glycocalyx components. Syndecans govern cell adhesion, cell signalling and organisation of the cytoskeleton. The syndecan-1 protein participates in cell proliferation, cell migration and cell-matrix interactions through its receptor for extracellular matrix proteins.
Syndecan-1 was analysed with an enzyme-linked immunosorbent assay (ELISA; Nordic Biosite, Copenhagen, Denmark); the lower limit of detection (LLD) was 4.94 ng/ml. The normal reference range was 15–47 ng/ml. The inter-/intra-assay variability for syndecan-1 was 10.2%/6.2%.
sTM
Thrombomodulin (sTM) is a membrane protein expressed on the surface of endothelial cells that works as a cofactor for thrombin. The thrombomodulin-thrombin complex (TT-complex) raises the speed of protein C activation by a 1000-fold and thereby works as an anticoagulant. Inflammatory cytokines downregulate thrombomodulin, and activated leukocytes can cleave thrombomodulin, releasing it into the circulation as soluble thrombomodulin (sTM), a less active form. Elevated levels of sTM in the blood can be seen as a sign of endothelial cell damage.
sTM was analysed with ELISA (Nordic Biosite, Copenhagen, Denmark); the LLD was 0.31 ng/ml. The normal reference range was 2.39–7.9 ng/ml. The inter-/intra-assay variability for the sTM assay was 9.8%/3.9%.
H-VEGF
Vascular endothelial growth factor (VEGF) is a signal protein and a member of the platelet-derived growth factor family. VEGF exerts its biological effects by binding and activating its different tyrosine-kinase receptors to endothelial cells, eventually leading to their proliferation, migration and increased permeability. VEGF induces embryonic vessel development as well as physiological and pathological angiogenesis. Most of the circulating VEGF resides in platelets. When platelets become activated at a site of injury, they release their stored VEGF, which binds to and activates endothelial cells so the wound can heal completely. VEGF is also bound to the glycocalyx and is released during glycocalyx shedding.
Human VEGF was analysed with ELISA (Quantikine®, R&D Systems Europe, Ltd., Abingdon, UK); the LLD was 31.3 pg/ml. The normal reference range was P-VEGF-A < 80 pg/ml. The inter-/intra-assay variability for the P-VEGF-A assay was 7%/<5%.
C-reactive protein
C-reactive protein (CRP) was analysed with a lithium-heparin tube (LH PST, BD Vacutainer® systems, Plymouth, UK). The normal reference range for CRP was <3.0 mg/L, imprecision 4.4%.
Statistics
Statistical analyses of the collected data were performed using GraphPad Prism 7.00 (GraphPad Software, La Jolla, CA, USA). Non-parametric methods were used since the endothelial cell markers were not normally distributed.
Concentrations of endothelial cell markers measured directly before the platelet transfusions were set as baseline. The differences in the plasma concentrations at baseline and directly after the platelet transfusion (0 h) were referred to as delta (Δ).
Analyses of differences in concentrations over time were performed with Friedman test. Concentrations from all times were compared with the concentration before transfusion using Dunn’s multiple comparisons test.
The Kruskal-Wallis test was used to compare the Δ concentrations of the endothelial cell markers between the patient groups as well as for comparisons of the endothelial cell markers between the groups at the baseline.
Correlation analyses were calculated using Spearman’s correlation tests.
p Values <.05 were considered significant.
Results
The study entailed 54 platelet transfusion events in 43 patients; group 1, n = 19; group 2, n = 7; group 3, n = 16; group 4, n = 12 and control group, n = 10. Patient characteristics are presented in .
The median volume (interquartile range [IQR]) for the given platelet concentrates was 303 ml (295–313) and the median platelet count per platelet concentrate (IQR) was 246 × 109 (203–268) with a minimum of 153 × 109 and a maximum of 304 × 109. Both volumes and counts per platelet concentrate were without differences between the buffy-coat and the apheresis concentrates. Buffy coat concentrates were given to 48 patients (89%) and apheresis concentrates were given to 6 patients (11%). The median storage time (IQR) for the platelet concentrates were 4 days (4–7).
The median CCI (IQR) 1-h post-transfusion was 9624 (7663–13367). Platelet refractoriness defined as CCI < 5000 1 h after transfusion, was found in three cases.
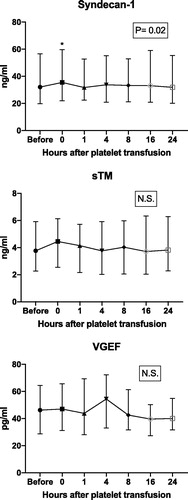
The changes in concentrations of the endothelial cell markers up to 24 h after transfusions were compared to baseline (). The level of syndecan-1 was elevated immediately after the platelet transfusion compared to the baseline (p = .02), but no significant differences were found at any other investigated time compared to baseline. There was no significant increase in sTM or VEGF compared to the baseline at any investigated time.
Figure 1. Plasma concentrations of the different endothelial cell markers varying over time. Groups 1–4 aggregated. Friedman test revealed a p value of .02 for differences between all time points for syndecan-1. Concentrations of the endothelial cell markers at the baseline (before platelet transfusion) were compared with concentrations from all other times (0, 1, 4, 8, 16 and 24 h post-transfusion) using Dunn’s multiple comparisons test, which showed a p value of .02 for syndecan-1 directly after transfusion (0 h). The numbers in the squares represent significance for Friedman tests. N.S.: non-significant; sTM: soluble thrombomodulin; VGEF: vascular endothelial growth factor.
Two different analyses were performed to investigate if the pre-defined groups differed regarding endothelial cell markers. First, concentrations at baseline were compared between groups (control, 1–4; ). There were no significant differences in concentrations of syndecan-1 and sTM. VEGF-concentrations however differed between the groups at baseline (p = .02). All three analysed endothelial cell markers were within normal reference values at baseline. Second, Δ concentrations of endothelial cell markers from before to directly after the platelet transfusion () between groups 1–4 were compared (). No significant differences were found between the groups.
Figure 2. Comparison of plasma concentrations of the endothelial cell markers at baseline between groups Kruskal–Wallis test. Group 1: Patients with AML, ALL, MPAL or MDS. Group 2: Patients receiving autologous SCT. Group 3: Patients receiving allogeneic SCT. Group 4: Patients scheduled for prophylactic platelet transfusion prior to insertion of a central venous catheter. Control group: Patients not scheduled for platelet transfusion. N.S.: non-significant.
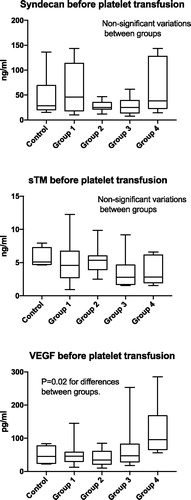
Figure 3. Comparison of Δ concentrations of the endothelial cell markers (i.e. the difference in concentration before versus directly after the completion of the platelet transfusion [before 0 h]) stratified by groups. Kruskal–Wallis test was used for the comparisons. Group 1: Patients with AML, ALL, MPAL or MDS. Group 2: Patients receiving autologous SCT. Group 3: Patients receiving allogeneic SCT. Group 4: Patients scheduled for prophylactic platelet transfusion prior to insertion of a central venous catheter N.S.: non-significant. Zero hours after transfusion: directly after transfusion. s-TM: soluble thrombomodulin; VGEF: vascular endothelial growth factor.
![Figure 3. Comparison of Δ concentrations of the endothelial cell markers (i.e. the difference in concentration before versus directly after the completion of the platelet transfusion [before 0 h]) stratified by groups. Kruskal–Wallis test was used for the comparisons. Group 1: Patients with AML, ALL, MPAL or MDS. Group 2: Patients receiving autologous SCT. Group 3: Patients receiving allogeneic SCT. Group 4: Patients scheduled for prophylactic platelet transfusion prior to insertion of a central venous catheter N.S.: non-significant. Zero hours after transfusion: directly after transfusion. s-TM: soluble thrombomodulin; VGEF: vascular endothelial growth factor.](/cms/asset/40025e7b-9c1a-4b78-ada1-9dc38e1920be/iclb_a_1636403_f0003_b.jpg)
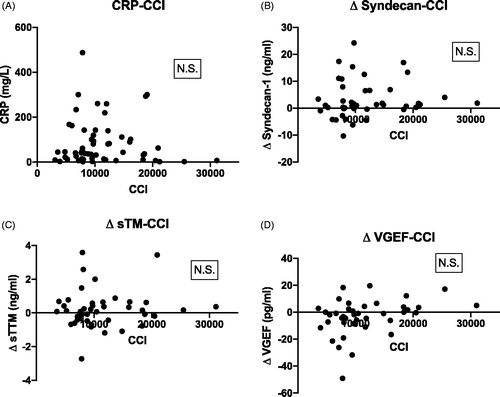
There were no correlations between CCI and CRP, Δ syndecan-1, Δ sTM or Δ VEGF ().
Figure 4. Scatterplot showing Spearman correlations between CCI and (A) C-reactive protein (CRP) mg/L; (B) Δ syndecan-1; (C) Δ soluble thrombomodulin (sTM) and (D) Δ vascular endothelial growth factor (VEGF). All Δ concentrations refer to differences between baseline and directly after the platelet transfusions (0 h). N.S.: non-significant.
Discussion
Changes in endothelial cell markers are not associated with platelet increment in haematology patients: our hypothesis was disproven.
Pre-transfusion plasma concentrations of the endothelial cell markers syndecan-1, sTM and VGEF were within the normal range. There was only a transient rise in syndecan-1 immediately after the platelet transfusion compared to baseline values; levels were still within normal values. This result could be a passive transfer of increased endothelial cell markers in stored platelet concentrates; the longer the storage period, the higher the concentration of endothelial cell markers, as has been described for VEGF [Citation15]. This is however not likely for syndecan-1 as this biomarker is not shed from platelets and plasma is diluted by platelet additive solution and previous studies have demonstrated lower-than-normal plasma levels in platelet concentrates [Citation8].
Consequently, transfusing a bag of 250 ml platelet concentrate to a human with a blood volume of 4–5 L would probably not affect the syndecan-1 plasma concentration. This is in accordance with Larsson et al. who did not find any significant changes in syndecan-1 and sTM up to 24 h after platelet transfusion in patients with AML, corresponding to Group 1 in this study. However, they did find a positive correlation between the platelet activation biomarker sCD40L’s plasma level 1 h after transfusion and increased syndecan-1 and sTM Δ values [Citation8].
Normally, the intact glycocalyx protects the endothelium from activated platelets; therefore, signs of both a damaged glycocalyx and activated platelets probably need to be present to have an additive effect. Although platelet concentrates may have slightly increased concentrations of different shedded glycocalyx glycoproteins (passive transfer from the donor plasma), their role is unknown.
Syndecans are important regulators of human carcinogenesis and work as cell surface receptors. In humans, syndecans 1–4 interact in leukocyte rolling on endothelial cells, wound repair, angiogenesis, carcinogenesis, vascular permeability and modulation of chemokine activity [Citation16]. It is not yet clear whether shedded syndecans are directly involved in causing cancer or whether they have positive or negative roles in carcinogenesis. Our study did not find increased plasma concentrations beyond normal ranges for the respective endothelial cell markers.
Numerous conditions include increased glycocalyx shedding: hypervolemia, inflammation, sepsis, diabetes, renal failure, atherosclerosis, cardiac arrest, acute decompensated heart failure, ischaemia/reperfusion, trauma, haemorrhagic shock and surgery [Citation10,Citation11,Citation17,Citation18]. None of our patients had such conditions except Group 2, which had some patients with increased CRP [Citation6]. We found no correlation between CRP and CCI in the present study.
It has been suggested that endothelial damage secondary to radiation or chemotherapy may consume transfused platelets and therefore cause platelet refractoriness [Citation4]. We found neither increased plasma concentrations above upper normal reference values in the endothelial cell markers we used, nor significant correlations with CCI. We found no signs of platelet-induced endothelial damage. There were no differences in the present study between the four groups receiving platelet transfusions and the control group which did not receive platelet transfusions.
One study reported an association between high syndecan-1 levels and bleeding and endothelial damage in 22 of 49 patients with acute leukaemia [Citation19]. Median syndecan-1 plasma concentrations (IQR) were 46 ng/ml (30–102) in the group with bleeding and 27 ng/ml (21–57) in patients with no bleeding. Patients with more bleeding also had lower PLCs and lower levels of the platelet activation marker sCD40L as discussed above. Other markers of platelet activation and platelet function were also lower. Even if there were higher plasma concentrations of several procoagulative endothelial biomarkers, patients still bled. These patients were also older and had higher leukocyte counts. This outcome reflects the complex picture of in vivo haemostasis: complexity increases further when glycocalyx and endothelial cell dysfunctions are involved.
Patients with pulmonary embolism (PE) often show a hypercoagulative plasma coagulation marker profile, but glycocalyx shedding and a damaged endothelial barrier could also be risk factors. One group demonstrated using receiver operating characteristics (ROC), that syndecan-1 predicted high-risk PE with a significant area under the curve (AUC) of 0.93 [Citation20]. Risk stratification was made using the European Society of Cardiology’s guidelines for categorising high, intermediate and low risk. This classification is based on how the PE effects the patient’s physiologic response, not the severity of its pathophysiology. In the high-risk PE category, the median syndecan-1 was 118.6 ng/ml (range 76.2–133.3).
The same group reported sTM plasma levels corresponding to 3.6 ng/ml (range 2.0–8.2), close to the levels reported in our study [Citation20]. sTM is not as frequently analysed as syndecan-1 [Citation21]. Inflammatory cytokines downregulate thrombomodulin, and activated leukocytes can cleave thrombomodulin, releasing it into the circulation as sTM, a less active form.
Very high levels of syndecan-1 have been reported in trauma patients compared to healthy controls [Citation22]. Patients with low colloid osmotic pressure (COP) had the highest levels of several shedded glycocalyx markers, as did those with the highest severity injury scores. The median concentration of syndecan-1 (IQR) for the healthy controls was 31.6 ng/ml (16.3–46.9), while those for patients with normal and low COP were 34.6 ng/ml (19.3–43.1) and 221.7 ng/ml (88.3–477.4), respectively. One group reported worse outcomes for trauma patients with syndecan-1 plasma levels >40 ng/ml and a ROC AUC of 0.71 [Citation21]. sTM in these patients had a median concentration (IQR) of 6.7 ng/ml (5.4–9.4).
Albumin is the primary protein in blood that maintains the COP. An albumin-protective effect by mechanisms other than COP has been proposed, such as an optimally resuscitated plasma volume [Citation23]. Another possible mechanism is the glycocalyx-restoring effect of sphingosine 1-phosphate, an erythrocyte-derived biomarker that binds to albumin, possibly explaining the glycocalyx-shedding protective effect of plasma or albumin infusion therapies and their role in decreasing mortality in trauma and massive transfusions [Citation24]. However, in these situations, overtransfusion resulting in hypervolemia increases the release of atrial natriuretic peptide, which can increase glycocalyx shedding [Citation25]. It cannot be ruled out that the (small) volume load induced by platelet transfusion may contribute to the discrete increase in syndecan-1 immediately after the transfusion. Alternatively, the small transient syndecan-1 increase immediately after platelet transfusion could be related to the platelet storage solution (PAS) and/or activated platelets, if so – indicating a hit on the glycocalyx.
The baseline levels of VEGF varied significantly among the groups. Group 4 had the highest levels. It is well known that solid tumours can express VEGF and thus promote angiogenesis, which is necessary for tumour growth and spread. Increasing evidence has emerged that the same is true for some haematological malignancies. Studies have shown increased vascularisation in the bone marrow in patients with AML and, further, that tumour cells in AML and other haematologic malignancies and malignant plasma cells in multiple myeloma express and secrete VEGF [Citation26–28]. Different levels of VEGF expression could therefore influence VEGF plasma levels.
However, there is another possible explanation for these differences. Patients in Group 4 had a higher PLC at the baseline prior to platelet transfusion. Platelets contain VEGF and release it when activated, and several studies have shown a correlation between PLC and plasma/serum levels of VEGF in non-haematology cancer patients [Citation29–31]. Blood samples in Group 4 were retrieved via peripheral venous cannulation, which may activate platelets more than when blood is collected from a large-bore central venous catheter through p-selectin release [Citation32]. Increased levels of p-selectin correlate to higher VEGF [Citation33].
One of the limitations in the present study is that it is a single centre study. Second, it has to be mentioned that the lack of significant differences both when comparing before and after concentration and the in-between groups comparisons should be interpreted with caution. The sample size calculations in the main study were performed for the change in PLC after transfusion and therefore the number of observations in the present study may not be adequate [Citation6].
In conclusion, a transient significant increase in syndecan-1 was seen immediately after platelet transfusion, but with no correlation to CCI. Patients with a higher PLC that were scheduled for central venous catheterisation had a higher VEGF before platelet transfusion compared to other subgroups, which could relate to both the higher PLC and the increased peripheral vein sampling that occurs before receiving a central venous catheter. We found no evidence of endothelial cell barrier defects in our stable thrombocytopenic haematology patients either before or after platelet transfusions.
Data availability
The data which was gathered and analysed for this study are under restriction from the Regional Review Board in Lund. Data are available with permission of the Swedish Ethical Review Authority.
Disclosure statement
No potential conflict of interest was reported by the authors.
Related Research Data
References
- Cronkite C. The diagnosis, prognosis, and treatment of radiation injuries produced by atomic bombs. Radiology. 1951;56:661–669.
- Desborough M, Estcourt LJ, Doree C, et al. Alternatives, and adjuncts, to prophylactic platelet transfusion for people with haematological malignancies undergoing intensive chemotherapy or stem cell transplantation. Cochrane Database Syst Rev. 2016;(8):CD010982.
- Sahler J, Grimshaw K, Spinelli SL, et al. Platelet storage and transfusions: new concerns associated with an old therapy. Drug Discov Today Dis Mech. 2011;8:e9–e14.
- Slichter SJ, Davis K, Enright H, et al. Factors affecting posttransfusion platelet increments, platelet refractoriness, and platelet transfusion intervals in thrombocytopenic patients. Blood. 2005;105:4106–4114.
- Kerkhoffs J-L, Eikenboom JCJ, van de Watering LMG, et al. The clinical impact of platelet refractoriness: correlation with bleeding and survival. Transfusion (Paris). 2008;48:1959–1965.
- Benediktsson S, Lazarevic V, Nilsson L, et al. Linear decline of corrected platelet count increment within 24 hours after platelet transfusion in haematological patients: a prospective observational study. Eur J Haematol. 2017;99:559–568.
- Guidet B, Ait-Oufella H. Fluid resuscitation should respect the endothelial glycocalyx layer. Crit Care. 2014;18:707–707.
- Larsen AM, Leinøe EB, Johansson PI, et al. Haemostatic function and biomarkers of endothelial damage before and after platelet transfusion in patients with acute myeloid leukaemia. Transfus Med. 2015;25:174–183.
- Schött U, Solomon C, Fries D, et al. The endothelial glycocalyx and its disruption, protection and regeneration: a narrative review. Scand J Trauma Resusc Emerg Med. 2016;24:48.
- Chappell D, Brettner F, Doerfler N, et al. Protection of glycocalyx decreases platelet adhesion after ischaemia/reperfusion. An animal study. Eur J Anaesthesiol. 2014;31:474–481.
- Becker BF, Leipert S, Jacob M, et al. Degradation of the endothelial glycocalyx in clinical settings: searching for the sheddases. Br J Clin Pharmacol. 2015;80:389–402.
- Chelazzi C, Villa G, Mancinelli P, et al. Glycocalyx and sepsis-induced alterations in vascular permeability. Crit Care. 2015;19:26.
- Hod E, Schwartz J. Platelet transfusion refractoriness. Br J Haematol. 2008;142:348–360.
- Rebulla P. Formulae for the definition of refractoriness to platelet transfusion. Transfus Med. 1993;3:91–92.
- Wen Y-H, Lin C-J, Sun Y-C, et al. Sustained or higher levels of growth factors in platelet-rich plasma during 7-day storage. Clin Chim Acta. 2018;483:89–93.
- Choi S, Lee H, Choi JR, et al. Shedding; towards a new paradigm of syndecan function in cancer. BMB Rep. 2010;43:305–310.
- Reitsma S, Oude Egbrink MGA, Heijnen VVT, et al. Endothelial glycocalyx thickness and platelet-vessel wall interactions during atherogenesis. Thromb Haemost. 2011;106:939–946.
- Ushiyama A, Kataoka H, Iijima T. Glycocalyx and its involvement in clinical pathophysiologies. J Intensive Care. 2016;4:59.
- Larsen AM, Leinøe EB, Johansson PI, et al. High syndecan-1 levels in acute myeloid leukemia are associated with bleeding, thrombocytopathy, endothelial cell damage, and leukocytosis. Leuk Res. 2013;37:777–783.
- Lehnert P, Johansson PI, Ostrowski SR, et al. Coagulopathy in patients with acute pulmonary embolism: a pilot study of whole blood coagulation and markers of endothelial damage. Scand J Clin Lab Invest. 2017;77:19–26.
- Gonzalez Rodriguez E, Ostrowski SR, Cardenas JC, et al. Syndecan-1: a quantitative marker for the endotheliopathy of trauma. J Am Coll Surg. 2017;225:419–427.
- Rahbar E, Cardenas JC, Baimukanova G, et al. Endothelial glycocalyx shedding and vascular permeability in severely injured trauma patients. J Transl Med. 2015;13:117–117.
- Nelson A, Statkevicius S, Schött U, et al. Effects of fresh frozen plasma, Ringer's acetate and albumin on plasma volume and on circulating glycocalyx components following haemorrhagic shock in rats. Intensive Care Med Exp. 2016;4:6.
- Mensah SA, Ebong EE, Cheng MJ, et al. Regeneration of glycocalyx by heparan sulfate and sphingosine 1-phosphate restores inter-endothelial communication. PLoS One. 2017;12:e0186116.
- Chappell D, Bruegger D, Potzel J, et al. Hypervolemia increases release of atrial natriuretic peptide and shedding of the endothelial glycocalyx. Crit Care. 2014;18:538.
- Hussong JW, Rodgers GM, Shami PJ. Evidence of increased angiogenesis in patients with acute myeloid leukemia. Blood. 2000;95:309–313.
- Kumar S, Witzig TE, Timm M, et al. Expression of VEGF and its receptors by myeloma cells. Leukemia. 2003;17:2025–2031.
- Chand R, Chandra H, Chandra S, et al. Role of microvessel density and vascular endothelial growth factor in angiogenesis of hematological malignancies. Bone Marrow Res. 2016;2016:5043483.
- Verheul HM, Hoekman K, Luykx-de Bakker S, et al. Platelet: transporter of vascular endothelial growth factor. Clin Cancer Res. 1997;3:2187–2190.
- George ML, Eccles SA, Tutton MG, et al. Correlation of plasma and serum vascular endothelial growth factor levels with platelet count in colorectal cancer: clinical evidence of platelet scavenging? Clin Cancer Res. 2000;6:3147–3152.
- Salgado R, Vermeulen PB, Benoy I, et al. Platelet number and interleukin-6 correlate with VEGF but not with bFGF serum levels of advanced cancer patients. Br J Cancer. 1999;80:892–897.
- Milburn JA, Ford I, Cassar K, et al. Platelet activation, coagulation activation and C-reactive protein in simultaneous samples from the vascular access and peripheral veins of haemodialysis patients. Int J Lab Hematol. 2012;34:52–58.
- Qi C-L, Wei B, Ye J, et al. P-selectin-mediated platelet adhesion promotes the metastasis of murine melanoma cells. PLoS One. 2014;9:e91320.