
 ?Mathematical formulae have been encoded as MathML and are displayed in this HTML version using MathJax in order to improve their display. Uncheck the box to turn MathJax off. This feature requires Javascript. Click on a formula to zoom.
Abstract
Clinical utility of a diagnostic test depends on its diagnostic accuracy, the pretest probability of disease and the clinical consequences of the test results. Tools for evaluating clinical utility are scarce. We propose a new clinical utility index (CUI), which is the expected gain in utility (EGU) of the test divided by the EGU of an ideal test, both adjusted for EGU of the optimal clinical action without testing. The index expresses the relative benefit of using the test compared to using an optimal test when making a clinical decision. To illustrate how the index may be used, we estimated CUI for fasting glucose, both as a continuous and as a dichotomous test, at several values of pretest probability of diabetes mellitus and at two levels of cost/benefit-ratio. In the same clinical situations we also estimated CUI for the 2 h glucose tolerance test. Hemoglobin A1c ≥ 48 mmol/mol was used as a reference standard for diabetes mellitus. In this model, fasting glucose was clinically more useful as a continuous test than as a dichotomous one, based on CUIs. At pretest probability above the treatment threshold, fasting glucose as a continuous test was even more useful than the complete glucose tolerance test. These results are not necessarily generalizable; however, they show how the CUI can be used to select the most useful test in certain clinical situations.
Introduction
The clinical utility of a diagnostic test depends on the consequences of the various test results in patients with and without disease, i.e. whether applying the test and using test results to guide actions, e.g. treatment, leads to a better health outcome than not applying the test [Citation1]. Of course, the clinical utility of the test also depends on its diagnostic accuracy, i.e. how accurately the test discriminates between the presence and absence of the disease in question [Citation2], and on the pretest probability of disease. While we are well equipped with tools for studying diagnostic accuracy, such as receiver operating characteristic (ROC) curve analysis [Citation3], tools for studying clinical utility are scarce. Some techniques have been published [Citation4–6], but none has gained wide acceptance. In this work we propose a new index of clinical utility, which measures the relative expected gain in utility of applying the diagnostic test compared to an ideal diagnostic test, both adjusted for the expected gain in utility of optimal clinical action without testing. To illustrate the principles, we use data on fasting glucose and the complete glucose tolerance test as diagnostic tests of diabetes mellitus.
Materials and methods
Model
Expected gain in utility (EGU) of a clinical option, at a certain probability of disease (p), is the difference between its expected utility and the expected utility of another option, for instance doing nothing [Citation4]. The EGU of the option W at probability p is EGUp(W) = p×BW – (1 − p)×CW [Citation4]. The option W could, for instance, be “treat the patient of diabetes mellitus”, BW the net benefit of being treated for diabetes mellitus if one really has diabetes, and CW the cost (harm) of being treated for diabetes if one does not have the disease. If no tests were available, the physician should just offer treatment if benefit is greater than the cost. The benefit is equal to the cost when p×BW = (1−p)×CW, i.e. when p = CW/(BW + CW). This is the treatment threshold of Pauker and Kassirer [Citation7]. Optimal clinical action without a diagnostic test is doing nothing when probability of disease is below the treatment threshold and treating when probability is above that threshold. If a dichotomous diagnostic test is available, two additional thresholds can be defined, a testing threshold and a test-treatment threshold [Citation8]. The thresholds are illustrated in .
Figure 1. Expected gain in utility (EGU) as a function of probability of disease for four different clinical actions when the cost of erroneously treating individuals without the disease is 1/3 of the net benefit of correctly treating individuals with the disease. The maximum value of net benefit is conveniently defined as 1. The tests are considered to be risk-free. “Ideal test” and “Dichotomous test” refer to the action of first testing and then treating only individuals with a positive test result. The dichotomous test has a sensitivity of 0.586 and a specificity of 0.959, corresponding to fasting glucose as a dichotomous test (). Three probability thresholds are shown: The treatment threshold (0.25), and the testing (0.02) and test-treatment threshold (0.44) of the dichotomous test. The letter “a” indicates the difference between EGU of the dichotomous test and EGU of treating all, while “b” indicates the difference between EGU of an ideal test and EGU of treating all. The clinical utility index (CUI) is a/b.
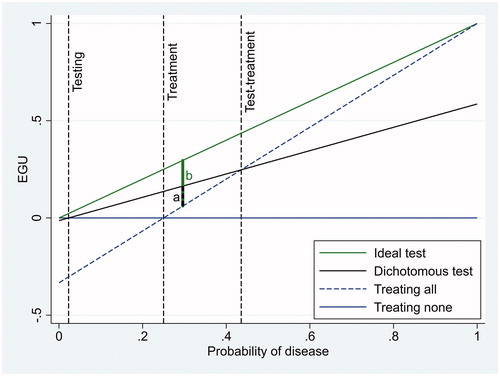
The testing threshold indicates the minimum probability when testing should be done to guide decisions, e.g. whether to treat or not. The test-treatment threshold indicates the maximum probability at which testing should be done to decide treatment. At higher probabilities, treatment should be given without testing. Assuming that the test itself has no cost, the EGU of a dichotomous diagnostic test is se×p×BW – (1−sp)×(1−p)×CW [Citation4], where se is sensitivity and sp is specificity. This corresponds to the benefit of testing patients with the disease, estimated as net benefit of testing per patient multiplied by the fraction of patients that are true positives, minus the cost of testing patients without the disease, estimated as net cost per patient multiplied by the fraction of false positive patients. If the pretest probability is between the testing and the test-treatment thresholds the test should be applied, and otherwise it should not. The reason is that at probabilities lower than the testing threshold EGU of a dichotomous test is always negative (). Correspondingly, at probabilities higher than the test-treatment threshold, EGU of treating all is always higher than EGU of the dichotomous test. For a cost-less continuous diagnostic test the testing and test-treatment thresholds do not exist if the minimum likelihood ratio is 0 and the maximum likelihood ratio is ∞, so an optimally interpreted continuous test may always be indicated [Citation4]. Likewise, a cost-less ideal test with a sensitivity of 1.0 and a specificity of 1.0 would always be indicated (), as the EGU of an ideal test is p×BW.
Referring to we propose a clinical utility index (CUI) equal to the distance from the EGU of optimal clinical action without a diagnostic test to the EGU of the diagnostic test divided by the same distance of an ideal test.
When the probability of disease is equal to or less than the treatment threshold, EGU of the optimal clinical action without a diagnostic test, i.e. treating none, is 0 and:
When the probability of disease is above the treatment threshold, EGU of the optimal clinical action without a diagnostic test, i.e. treating all, is (p×BW – (1−p)×CW) and:
As [(1−p)/p]×(CW/BW) is equal to the likelihood ratio at the optimal cut-off value (LRopt) [Citation3], the equations can be simplified.
When the probability of disease is equal to or less than the treatment threshold:
(1)
(1)
When the probability of disease is above the treatment threshold:
(2)
(2)
An ideal diagnostic test would, of course, have a CUI equal to 1 at any pretest probability. CUI of a real dichotomous diagnostic test would take on a value between 0 and 1 when pretest probability is between the testing and the test-treatment threshold, would be 0 at those thresholds, and otherwise it would be negative. Theoretically, as an optimally interpreted cost-less continuous diagnostic test would not have an EGU less than the optimal clinical action at any pretest probability if the minimum likelihood ratio is 0 and the maximum likelihood ratio is ∞ [4], such a test has a CUI between 0 and 1 at any pretest probability. For all diagnostic tests, when pretest probability is equal to the treatment threshold, LRopt = 1 and CUI = se – (1−sp) = se + sp − 1, which numerically is equal to Youden’s J index [Citation9].
When exploring the characteristics of the proposed CUI, we defined BW equal to 1, meaning the net benefit of correctly treating 1 patient. CW was defined on the same scale, as a fraction of 1. We underline that in the model given here, no health-related cost was attributed to the diagnostic testing itself, i.e. all diagnostic tests were considered risk-free. Neither did we include monetary cost.
Data
We used anonymous data on hemoglobin A1c (HbA1c), fasting glucose and glucose 2 h after a 75 g glucose load, collected from 573 outpatients 18 years or older, from January 1, 2006 to October 13, 2014. Patients were included if the HbA1c and glucose measurements were ordered at the same request. If more than one complete data set were available, the patient was included with the oldest set only. One patient was excluded due to outlying results. These data have previously been used to demonstrate a way of evaluating allowable total error [Citation10]. They are used here only to demonstrate the principles of CUI. To that end we defined patients with HbA1c ≥48 mmol/mol as having diabetes mellitus, and studied the diagnostic accuracy and CUI of fasting glucose as a dichotomous and as a continuous test, and the complete glucose tolerance test as a dichotomous one.
Procedures
Stata version 14.2 (StataCorp, College Station, Texas, USA) was used for calculations, statistical analyses and graphical work. Diagnostic accuracy of dichotomous tests was estimated as sensitivity and specificity. We used the ordinary cut-off limit of ≥7.0 mmol/L for fasting glucose, and fasting glucose ≥7.0 mmol/L or 2-h glucose ≥11.1 mmol/L for the complete glucose tolerance test [Citation11]. To estimate 95% confidence intervals of sensitivity, specificity and CUI, we used the Stata command “proportion” followed by the command “lincom”. The “lincom” command can compute confidence intervals for linear combinations of estimated figures. For the dichotomous tests CUI was calculated according to the EquationEquations (1)(1)
(1) and Equation(2)
(2)
(2) with their fixed values of sensitivity and specificity and LRopt calculated as [(1−p)/p]×(CW/BW) at each of 1000 levels of pretest probability for the CW/BW-ratios 1/3 and 1/9. The diagnostic accuracy of fasting glucose as a continuous test was estimated as the area under its ROC curve. CUI was estimated as follows: We first used logistic regression to establish a mathematical relation between LR and fasting glucose [Citation12]. This relation has the form LR = exp[α0 + ln(nnD/nD) + α1 × fasting glucose], where α0 and α1 are coefficients estimated with logistic regression, while nD and nnD are the number of patients with and without diabetes. At each of 1000 levels of pretest probability and for the CW/BW-ratios 1/3 and 1/9 we then calculated LRopt as [(1−p)/p]×(CW/BW) and solved the equation LRopt = exp[α0 + ln(nnD/nD) + α1 × fasting glucose] to find the optimal cut-off limit of fasting glucose. Lastly we estimated sensitivity and specificity at the optimal cut-off limits, and calculated the CUI according to EquationEquations (1)
(1)
(1) or (Equation2
(2)
(2) ).
Results
Of 572 included patients, 58 had HbA1c ≥48 mmol/mol and were diagnosed as diabetic. Given this reference standard, the sensitivity and specificity of fasting glucose at the cut-off limit of ≥7.0 mmol/L were 0.586 (95% confidence interval 0.458–0.714) and 0.959 (95% confidence interval 0.942–0.976), respectively. The corresponding figures for the glucose tolerance test were 0.759 (95% confidence interval 0.647–0.870) and 0.932 (95% confidence interval 0.910–0.954), respectively. The area under the ROC curve of fasting glucose as a continuous test was 0.915 (95% confidence interval 0.876–0.953). These results on diagnostic accuracy are visualised in as two points and one curve in the ROC space. LR as a function of fasting glucose was LR = exp(−13.00 + log(514/58) + 1.766 × fasting glucose). The CUI of the three diagnostic tests are shown in and for CW/BW-ratio of 1/3 and 1/9, corresponding to treatment thresholds of 0.25 and 0.1, respectively. At the treatment threshold the CUI of fasting glucose as a dichotomous test was 0.545 (95% confidence interval 0.416–0.675) and the CUI of the complete glucose tolerance test was 0.691 (95% confidence interval 0.577–0.804). The difference was 0.145 with a standard error of 0.0876, so the difference was marginally statistically significant (p = 0.05, one-sided z-test).
Figure 2. Diagnostic accuracy of fasting glucose and the complete glucose tolerance test when HbA1c ≥48 mmol/mol was used as the reference standard of diabetes mellitus.
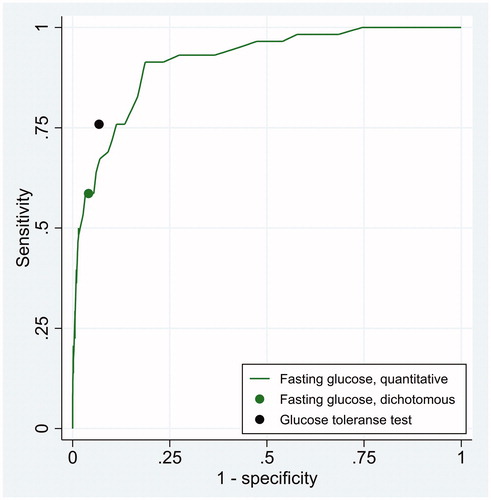
Figure 3. Clinical utility index (CUI) as a function of pretest probability of disease for three diagnostic tests whose diagnostic accuracy is displayed in . The figure refers to a situation where the cost of erroneously treating individuals without the disease is 1/3 of the net benefit of correctly treating individuals with the disease, so that the treatment threshold (black vertical line) is 0.25.
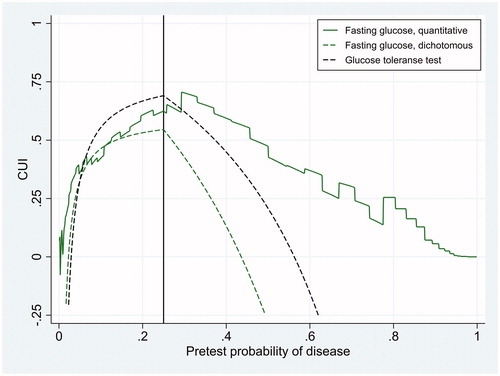
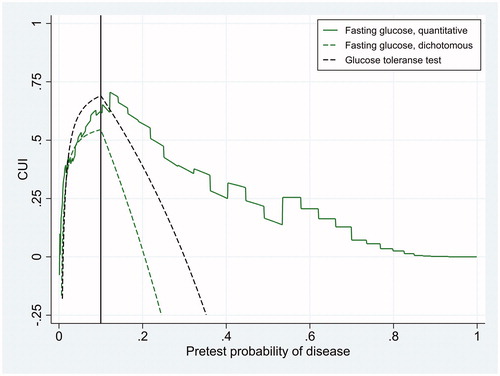
Figure 4. Clinical utility index (CUI) as a function of pretest probability of disease for three diagnostic tests whose diagnostic accuracy is displayed in . The figure refers to a situation where the cost of erroneously treating individuals without the disease is 1/9 of the net benefit of correctly treating individuals with the disease, so that the treatment threshold (black vertical line) is 0.10.
Discussion
The clinical utility of a diagnostic test is best studied in randomized clinical trials, where patients are randomized to physicians equipped with the test or not [Citation1]. Studies of that kind are almost never done, probably due both economical and ethical reasons. Modelling is another, more easily done but less desirable option, because it is almost impossible to take all relevant factors into consideration. Nevertheless, modelling is better than just guessing. In this work we propose a clinical utility index that is applicable to both dichotomous and quantitative tests. Its interpretation is relatively straightforward, as the CUI is EGU of the test divided by the EGU of an ideal test, when both are compared against an ideal clinical action without testing. Thus the CUI depends on the clinical situation, here modelled as the pretest probability of disease and the ratio of the cost of erroneously treating individuals without the disease to the net benefit of correctly treating individuals with the disease. A challenge with this approach might be to determine the cost and benefit. However, we do not need to know the cost and benefit on a health-related scale; estimating the ratio between them is sufficient. In this study we have conveniently defined benefit as 1, and cost as a fraction of 1 (). Two scenarios were modelled, one with a cost/benefit-ratio of 1/3 and one with a ratio of 1/9. We think that the cost/benefit-ratio of treating individuals with diabetes mellitus is rather low, perhaps even lower than 1/9, at least when dealing with diabetes mellitus II. If so, with a treatment threshold of 0.10 is more relevant than where the treatment threshold is 0.25.
and show that generally the CUI of fasting glucose as a continuous test was higher than CUI of fasting glucose as a dichotomous test. This is to be expected, due to the information loss from dichotomizing fasting glucose, assigning a LR of 0.586/(1 − 0.959) = 14.3 to all values of 7.0 mmol/L or higher, and LR of (1 − 0.586)/0.959 = 0.432 to all values of 6.9 mmol/L or lower, independent of the clinical situation. If we use fasting glucose as a continuous test and adjust the cut-off limit according to LRopt, the cut-off limit is always optimal. The CUI of such a test is never less than 0 at any pretest probability if the minimum likelihood ratio is 0 and the maximum likelihood ratio is ∞ (Methods). Very low levels of fasting glucose excludes diabetes and very high levels confirm it, so we expect the CUI of fasting glucose as a continuous test to never become negative. Looking at and , it was negative only at extremely low levels of pretest probability, perhaps due to imperfect modelling of LR. The complete glucose tolerance test had a higher CUI than fasting glucose as a dichotomous test over a wide range of pretest probability ( and ). Only at very low levels of pretest probability was CUI of fasting glucose as a dichotomous test higher than that of the complete glucose tolerance test. In contrast, fasting glucose as a continuous test had a higher CUI than the complete glucose tolerance test at pretest probability above the treatment threshold ( and ). These findings are not easily foreseen when just looking at diagnostic accuracy ().
The CUI proposed here bears some resemblance to a weighted kappa coefficient in the work of Kraemer [Citation5] and to the weighted “Number Needed to Misdiagnose” in the work of Habibzadeh et al. [Citation13]. However, those measures are not adjusted for EGU of optimal clinical action without testing, so they do not indicate whether the pretest probability is outside the interval between the testing and test-treatment thresholds. This can be confusing because outside that interval a dichotomous test should not be applied at all. The confusion is avoided using the CUI proposed here, which is positive only if pretest probability is between the testing and test-treatment thresholds, 0 at the thresholds and negative outside the interval ( and ). Another characteristic is that CUI reaches a maximum when pretest probability is at the treatment threshold ( and ), where CUI numerically is equal to Youden’s J index [Citation9], although it conceptually is different. This phenomenon shows that a diagnostic test is most useful when it is most needed, because the physician is (or should be) most in doubt about treating the patient when pretest probability is at the treatment threshold.
One weakness of this approach is, of course, that determining pretest probability of disease is not an easy task. However, as shown in and where CUI is displayed as a function of pretest probability, one needs not to know this probability exactly, merely an opinion of a range of reasonable probabilities is sufficient. Another weakness is that health-related cost of testing itself is not incorporated, and monetary costs are not accounted for. EGU of diagnostic tests are easily adjusted for health-related cost of testing itself [Citation4], but for the case of simplicity we did not make that adjustment. Our examples are CUI of clinical chemistry tests, and for such tests the risk of testing is negligible. Accounting for monetary costs would imply cost-effectiveness analysis, which is a different matter and clearly beyond the scope of this work. Yet another weakness of our study might be the lack of confidence intervals of CUI for continuous tests. However, to establish a method for estimating those confidence intervals was beyond the scope of this work. We presume that they can be estimated with a bootstrap technique [Citation14]. The confidence interval of CUI for the dichotomous tests was relatively wide, and will be wider still for a continuous test where logistic regression is used to estimate optimal cut-off limits before sensitivity and specificity are estimated.
In conclusion, we have proposed a CUI that may be used to select the clinically most useful diagnostic test if the clinical situation can be described by pretest probability of disease and the ratio of the cost of erroneously treating individuals without the disease to the net benefit of correctly treating individuals with the disease.
Disclosure statement
No potential conflict of interest was reported by the authors.
References
- Bossuyt PM, Reitsma JB, Linnet K, et al. Beyond diagnostic accuracy: the clinical utility of diagnostic tests. Clin Chem. 2012;58(12):1636–1643.
- Linnet K, Bossuyt PM, Moons KG, et al. Quantifying the accuracy of a diagnostic test or marker. Clin Chem. 2012;58(9):1292–1301.
- Metz CE. Basic principles of ROC analysis. Semin Nucl Med. 1978;8(4):283–298.
- Doubilet P. A mathematical approach to interpretation and selection of diagnostic tests. Med Decis Making. 1983;3(2):177–195.
- Kraemer HC. Evaluating medical tests. Objective and quantitative guidelines. Newbury Park (CA): Sage Publications; 1992. p. 119–123.
- Vickers AJ, Elkin EB. Decision curve analysis: a novel method for evaluating prediction models. Med Decis Making. 2006;26(6):565–574.
- Pauker SG, Kassirer JP. Therapeutic decision making: a cost-benefit analysis. N Engl J Med. 1975;293(5):229–234.
- Pauker SG, Kassirer JP. The threshold approach to clinical decision making. N Engl J Med. 1980;302(20):1109–1117.
- Youden WJ. Index for rating diagnostic tests. Cancer. 1950;3(1):32–35.
- Åsberg A, Odsæter IH, Carlsen SM, et al. Using the likelihood ratio to evaluate allowable total error–an example with glycated hemoglobin (HbA1c). Clin Chem Lab Med. 2015;53:1459–1464.
- World Health Organization. Definition and diagnosis of diabetes mellitus and intermediate hyperglycemia. Report of a WHO/IDF consultation. Geneva (Switzerland): World Health Organization; 2006. p. 3.
- Albert A. On the use and computation of likelihood ratios in clinical chemistry. Clin Chem. 1982;28(5):1113–1119.
- Habibzadeh F, Habibzadeh P, Yadollahie M. On determining the most appropriate test cut-off value: the case of tests with continuous results. Biochem Med. 2016;26:297–307.
- Carpenter J, Bithell J. Bootstrap confidence intervals: when, which, what? A practical guide for medical statisticians. Statist Med. 2000;19(9):1141–1164.