
Abstract
Infants are at risk for iron deficiency. Despite research advances, assessing iron stores during infancy remains a challenge to the clinician. Ferritin is the first-choice laboratory marker for measuring iron stores but it is today still unclear how to evaluate reference intervals among infants. We have studied Swedish infants (n = 456), born at term after normal pregnancies. Ferritin was measured at birth (umbilical cord sample), 48–72 h, 4 months and 12 months. Lower and upper reference interval limits were constructed as the 2.5th and 97.5th percentiles. By a large study population, we were able to use more stringent measures to avoid interference from the acute phase response than previous reports on ferritin reference intervals. When we used mathematical transformation we furthermore avoided potential information loss in precision and confirmed earlier reports of sex differences. At the lower reference interval limits there were small differences between sexes. For the higher limits, the differences were more pronounced in the older infant. At 0–3 d of age we observed a difference between the sexes of only 5% at the upper limits. The differences peaked at 12 months, where the boys’ upper 97.5th percentile was 56% compared to girls.
Introduction
Research has in recent years made impressive achievements in the understanding of iron metabolism [Citation1]. Even so, ferritin remains the first-choice marker for iron stores. The detection of mild iron deficiency (ID) or ID in the more complex clinical setting is a challenging task. In the rapidly growing child, detecting ID is essential, since irreversible impairment to neurodevelopment may develop before progression into iron deficiency anemia (IDA) and presentation of clinical signs [Citation2]. Iron status assessment during infancy remains a challenge to the clinician and reference intervals during infancy are currently not well described. Also, as the clinical chemistry area has undergone a considerable development during the last decades, there is a need to re-evaluate reference intervals based on older studies [Citation3].
The reference interval is a descriptive data model of a presumably healthy population. A result outside the reference interval does not necessarily indicate disease, but flag the result and inform physicians that a follow-up is needed. In contrast, clinical decision limits or cut-offs are used to flag for specific adverse outcomes and determine diagnosis or treatment [Citation4]. For ferritin, it is unfortunately often so that these concepts are confused and a mix-up between the lower end of the reference interval and the decision limit concept has been adopted.
The current WHO guidelines [Citation5] recommend a ferritin concentration decision limit of <12 µg/L as a definition of iron storage depletion among children <5 years old. However, this decision limit for the patient less than 1 year old has been questioned [Citation6]. Importantly, is not based on clinical outcomes as required for establishing a high quality clinical decision limit [Citation7]. Also, since it is difficult to achieve a sufficiently large number of blood samples from healthy infant subjects < 1 year, it has been estimated by extrapolating data from older age groups, thereby not reflecting the different phases of physiological development during infancy [Citation6].
The aim of our study was to calculate reference interval limits for ferritin as a marker of iron stores in a large number of healthy infants, born after uncomplicated pregnancies in a low-risk area for ID, taking into account important analytical and statistical methodology aspects necessary for reliable estimation of ferritin reference intervals.
Materials and methods
In our work, the 2.5th and 97.5th percentiles of ferritin in a population from a randomized control trial of 456 healthy, full-term infants with normal birth weight were calculated. The infants were born in a low-risk area for ID, from uncomplicated pregnancies and uneventful perinatal circumstances. The mothers were non-smokers and healthy. Data was collected during 2008–2013 as part of a study assessing timing of umbilical cord clamping [Citation8,Citation9] and was approved by the regional research ethics committee at Lund University (41/2008, 344/2009). It comprised of two separate sample populations, the first included infants born in vaginal births (N = 392) and the second children born with caesarean section (n = 64). Ethnicity was not recorded, but the vast majority was of Caucasian origin. Details on nutrition, growth and neurodevelopmental outcomes at 12 months for the population have been described elsewhere [Citation9–11]. In summary, at 4 months of age about 50% of the infants were exclusively breastfed. Of the 50% who received formula, approximately 20% were exclusively formula fed. The remaining 80% received a combination of breast milk and formula. The weights and lengths for the reference interval cohort at 12 months were within WHO Child growth standards [Citation12] except for two girls who had a slightly higher weight (13.5 kg) than the WHO 3 SD limit of 13.1 kg.
Blood samples that were taken at birth (umbilical cord blood, n = 442), after 48–72 h (n = 365), at 4 months (n = 415) and at 12 months (n = 391) were analysed for ferritin and C-reactive protein (CRP) concentrations on the Cobas 6000 instrument platform (Roche Diagnostics, Basel Switzerland).The ferritin assay was traceable to the 1st international standard, with agreement to the 3rd international standard according to the assay manufacturer. The laboratory was accredited according to SE-EN ISO/IEC 17025:2005 and participates in inter laboratory external proficiency testing schemes.
If a CRP concentration of >5 mg/L was measured in a sample of the umbilical cord or at 48–72 h, and >1 mg/L at 4 months or 12 months, the corresponding ferritin result was excluded from further data analysis, the resulting number of individuals for each group as described in . The higher limit of a CRP >5 mg/L at the two first sampling points represent the higher reference interval limit of CRP for newborns. As the distribution of ferritin deviates from the Gaussian (normality), transformation according to the power transformation of Box-Cox was applied, with the exception of the umbilical cord data for the subgroup girls. For this data transformation according to Manly was used since the Box-Cox transformation for this group did not pass rule-in criteria, as the transformation was ruled in as successful only if (a) the visual inspection of the Q-Q-plot was approved and (b) if the hypothesis test of Anderson-Darling passed with a significance level of 10%. The 95% inter-percentile reference interval was calculated for each group and a 90% confidence interval around each endpoint was estimated by using the biweight, quantile, transformed, reflected methodology. Statistical analyses were conducted using Analyse-it for Microsoft Excel 4.90.4 from Analyse-it Software Ltd (Leeds, UK). Graphics of were performed by using the R package (version 3.5.1; The R Foundation for Statistical Computing, Vienna, Austria).
Table 1. Statistical description of data distributions as the minimum, median and maximum (n, number of subjects). The 2.5th and 97.5th percentiles calculated by Box-cox transformation.
Results
Ferritin concentrations from specimens collected from 456 infants were analysed. The distribution of the original ferritin concentration data at the four sampling time points is shown in and the descriptive statistics of the ferritin concentrations in the study population in . Ferritin concentrations were consistently lower in boys than in girls during infancy and therefore we divided data into subclasses by sex as well as age (). The calculated reference interval limits as the 2.5th and 97.5th percentiles are presented in and . At the reference interval lower limits there was a small difference between sexes. For boys, the lower limit concentration was about 80% compared to girls during the first 4 months and 90% by the age of 12 months. For the higher limit, the difference became more pronounced in the older infants. The first two sampling points (0–3 d of age) present upper limits with a difference between sexes of only 5%, increasing with age and peaking at 12 months, where the boys’ upper 97.5th percentile was just 56% of the upper limit of ferritin concentration of girls.
Figure 1. Ferritin concentration data distribution (non-transformed) of the population by combined bee swarm dot plot and box-whiskers diagram graphically presenting the minimum, first quartile, median, third quartile and maximum.
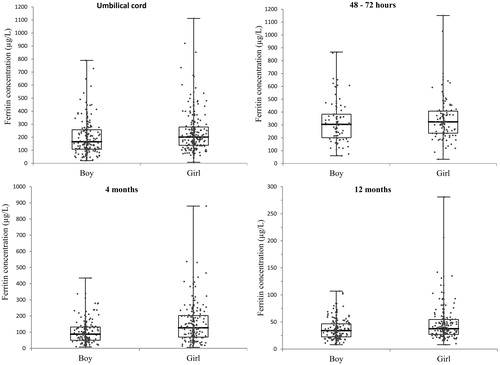
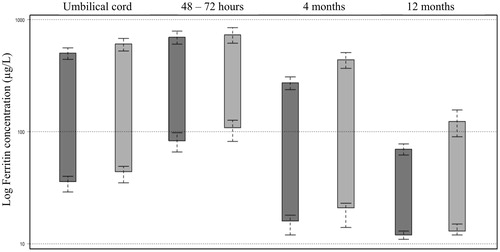
Figure 2. Overview of ferritin concentration as the 2.5th and 97.5th percentiles calculated by Box-Cox transformation at time points Umbilical cord, 48–72 h, 4 months and 12 months. Each sampling time point is divided in subclasses; boys and girls. The 90% confidence intervals at each reference interval time point included. The y-axis scale has been log transformed.
Discussion
Reference intervals for ferritin in serum during infancy were reported already in the 1970s [Citation13]. This study reported, similar to our results, high ferritin concentrations at birth and low levels from 6 months and upwards, but differences according to sex were not reported. The analytical methodology used, radioimmunoassay (RIA), is a technology replaced in the modern, high-throughput laboratory. Notably, very few subjects were studied in the age interval below 6 months. Compared to more recent studies such as the CALIPER study [Citation14] that primarily used data from an outpatient clinics population, our data is based on a supposedly healthy community population. Our observed reference interval lower limits for infants are similar to those suggested by the ESPGHAN Committee on Nutrition [Citation15] but our data suggest that that reference interval age stratifications are needed for even more time intervals during infancy.
The statistical methods used have a considerable effect on the validity of reference intervals and important guidelines for the statistical methodology as the Clinical and Laboratory Standards Institute C28-A3 [Citation16] are today available. However, there is a need to better adapt the guidelines to the complicated nature of pediatric data, where iron status changes rapidly during infancy, making partitioning criteria and statistical analyses complicated. By this, heterogeneity in presentation of reference intervals could be avoided, improving implementation and transferability of published results. The statistical method used is also important from the point of view that that there is a risk of losing information using robust statistical methods. As illustrated in and there are notable differences using the robust non-parametric statistical method compared to a transformed parametric method. The confidence intervals are narrower as seen in the confidence limit (CL) ranges. We hypothesized that since we, in our study, were able to use statistical methods which minimize information loss, we could quantitatively describe differences in ferritin concentrations between males and females. Sex differences have previously been observed and our results were in agreement with these findings [Citation17,Citation18].
Table 2. Comparison of the lower reference interval limit (2.5th percentile) with 90% confidence limits (CL) calculated by non-parametric robust statistical methodology (quantile) vs. transformed parametric statistical methodology.
Table 3. Comparison of the upper reference interval limit (97.5th percentile) with 90 % confidence limit
s (CL) calculated by non-parametric robust statistical methodology (quantile) vs transformed parametric statistical methodology.
The magnitude and time course of the increase in ferritin levels observed in conditions with an acute phase response are still a subject for research. Interestingly the recent work of Namaste et al showed the importance of considering interference from a raised CRP concentration below the commonly used CRP cut off of 5 mg/L [Citation19]. In our study, we therefore used a stringent measure to avoid interference from the role ferritin plays in the acute-phase response. Still, as reliable criteria for defining ID is lacking, we cannot fully exclude the possible occurrence of ID in the data population.
An interesting study using non-linear quantile regression to correlate ferritin levels to hematological parameters was recently reported [Citation20]. For children 4 months to <13 years of age, a lower limit of 30 µg/L was recommended. As opposed to our study which used data from a presumably healthy cohort of community infants to describe reference intervals, Markus et al used patient data to construct a decision limit. Similar future research approaches to gain more knowledge of the inter-relations between iron status parameters in a patient population, correlating iron status parameters to hematological parameters, but also taking CRP into consideration would be compelling. It is assumed that ferritin patient data is easily contaminated by elevated levels due to the acute phase response. Also, regarding the hematological parameters investigated by Markus et al, a similar correlation to the hemoglobin content of the reticulocytes would provide further insights.
Future studies are needed to describe the change in iron status parameters by reference change limits during infancy. Also, more research is warranted on the mechanisms behind the observed sex differences, the influence of growth and a connection to clinical outcome.
In conclusion, sex might be considered, in addition to age, when evaluating the results of ferritin in infants. However, it is not known whether the lower reference interval limits in boys reflect a physiological difference or rather a higher risk of ID in boys. In this context we would like to emphasize that reference intervals should not be interpreted as clinical decision limits. In the establishment of reference intervals we minimized the potential interference of the acute phase response, by using stringent CRP limits. We present reference interval limits at four different ages during the first year in life in a well-defined large cohort of healthy infants, as analysed by modern analytic methods and with use of statistical methodology that present a minimum of information loss and precision due to the approach used.
Acknowledgments
The authors thank Sasa Pejicic for the preparation of the graphical visualization of in R software.
Disclosure statement
The authors report no conflicts of interest.
Additional information
Funding
References
- Camaschella C, Pagani A. Advances in understanding iron metabolism and its crosstalk with erythropoiesis. Br J Haematol. 2018;182:481–494.
- Lozoff B, Beard J, Connor J, et al. Long-lasting neural and behavioral effects of iron deficiency in infancy. Nutr Rev. 2006;64:S34–S43; discussion S72–S91.
- Ferraro S, Mozzi R, Panteghini M. Revaluating serum ferritin as a marker of body iron stores in the traceability era. Clin Chem Lab Med. 2012;50:1911–1916.
- Ozarda Y, Sikaris K, Streichert T, et al. Distinguishing reference intervals and clinical decision limits - A review by the IFCC Committee on Reference Intervals and Decision Limits. Crit Rev Clin Lab Sci. 2018;55:420–431.
- World Health Organization. Iron deficiency anaemia assessment, prevention, and control. 2001 [cited 2018 Sep 20]. Available from: http://www.who.int/nutrition/publications/en/ida_assessment_prevention_control.pdf
- Domellöf M, Dewey KG, Lonnerdal B, et al. The diagnostic criteria for iron deficiency in infants should be reevaluated. J Nutr. 2002;132:3680–3686.
- Parkin PC, Hamid J, Borkhoff CM, et al. Laboratory reference intervals in the assessment of iron status in young children. BMJ Paediatr Open. 2017;1:e000074.
- Andersson O, Hellström-Westas L, Andersson D, et al. Effect of delayed versus early umbilical cord clamping on neonatal outcomes and iron status at 4 months: a randomised controlled trial. BMJ. 2011;343:d7157.
- Andersson O, Hellström-Westas L, Domellöf M. Elective caesarean: does delay in cord clamping for 30 s ensure sufficient iron stores at 4 months of age? A historical cohort control study. BMJ Open. 2016;6:e012995.
- Andersson O, Domellof M, Andersson D, et al. Effects of delayed cord clamping on neurodevelopment and infection at four months of age: a randomised trial. Acta Paediatr. 2013;102:525–531.
- Andersson O, Domellof M, Andersson D, et al. Effect of delayed vs early umbilical cord clamping on iron status and neurodevelopment at age 12 months: a randomized clinical trial. JAMA Pediatr. 2014;168:547–554.
- WHO Multicentre Growth Reference Study Group. WHO Child Growth Standards: length/height-for-age, weight-for-age, weight-for-length, weight-for-height and body mass index-for-age: Methods and development. Geneva: World Health Organization; 2006 [cited 2019 Jul 22]. p. 312. Available from: https://www.who.int/childgrowth/standards/technical_report/en/
- Siimes MA, Addiego JE Jr, Dallman PR. Ferritin in serum: diagnosis of iron deficiency and iron overload in infants and children. Blood. 1974;43:581–590.
- Adeli K, Higgins V, Trajcevski K, et al. The Canadian laboratory initiative on pediatric reference intervals: a CALIPER white paper. Crit Rev Clin Lab Sci. 2017;54:358–413.
- Domellöf M, Braegger C, Campoy C, et al. Iron requirements of infants and toddlers. J Pediatr Gastroenterol Nutr. 2014;58:119–129.
- CLSI. Defining, establishing, and verifying reference intervals in the clinical laboratory; approved guideline. 3rd ed. Wayne (PA): Clinical and Laboratory Standards Institute; 2008.
- Emond AM, Hawkins N, Pennock C, et al. Haemoglobin and ferritin concentrations in infants at 8 months of age. Arch Dis Child. 1996;74:36–39.
- Domellof M, Lonnerdal B, Dewey KG, et al. Sex differences in iron status during infancy. Pediatrics. 2002;110:545–552.
- Namaste SM, Rohner F, Huang J, et al. Adjusting ferritin concentrations for inflammation: Biomarkers Reflecting Inflammation and Nutritional Determinants of Anemia (BRINDA) project. Am J Clin Nutr. 2017;106:359S–371S.
- Markus C, Saxon B, Metz M. Ferritin as a functional biomarker of iron status in children and young adults. Br J Haematol. 2018;184:640–642.