
 ?Mathematical formulae have been encoded as MathML and are displayed in this HTML version using MathJax in order to improve their display. Uncheck the box to turn MathJax off. This feature requires Javascript. Click on a formula to zoom.
Abstract
Clinical testing of bronchial hyperreactivity (BHR) provides valuable information in asthma diagnostics. Nevertheless, the test results depend to a great extent on the testing procedure: test substance, apparatus and protocol. In Nordic countries, three protocols predominate in the testing field: Per Malmberg, Nieminen and Sovijärvi methods. However, knowledge of their equivalence is limited. We aimed to find equivalent provocative doses (PD) to obtain similar bronchoconstrictive responses for the three protocols. We recruited 31 patients with suspected asthma and health care workers and performed BHR testing with methacholine according to Malmberg and Nieminen methods, and with histamine according to Sovijärvi. We obtained the individual response-dose slopes for each method and predicted equivalent PD values. Applying a mixed-model, we found significant differences in the mean (standard error of mean) response-dose (forced expiratory volume in one second (FEV1)%/mg): Sovijärvi 7.2 (1.5), Nieminen 13.8 (4.2) and Malmberg 26 (7.3). We found that the earlier reported cut-point values for moderate BHR and marked BHR between the Sovijärvi (PD15) and Nieminen (PD20) methods were similar, but with the Malmberg method a significant bronchoconstrictive reaction was measured with lower PD20 values. We obtained a relationship between slope values and PD (mg) between different methods, useful in epidemiological research and clinical practice.
Introduction
Bronchial challenge testing with inhaled methacholine (chloride or bromide) and histamine diphosphate may provoke bronchoconstriction. This transient alteration of pulmonary function is expressed as a reduction of the forced expiratory volume in one second (FEV1). An absent bronchoconstrictive reaction to these substances usually indicates an absence of current asthma in test subjects [Citation1]. Inversely, a positive bronchial reaction concomitant with current symptoms can confirm an asthma diagnosis. Decades of bronchial hyperreactivity (BHR) testing with histamine or methacholine, acting directly on the bronchial histamine or cholinergic wall receptors, came hand in hand with different testing protocols and equipment. In two Nordic countries, three dosimetric protocols employed in clinical settings possess noteworthy methodological differences: methacholine testing with a nebuliser and a drying device developed by Per Malmberg et al. [Citation2], methacholine testing with a jet dosimeter according to Nieminen et al. [Citation3] and histamine testing with the same dosimeter according to Sovijärvi et al. [Citation4]. Previous researchers have compared the Sovijärvi and Nieminen methods in an epidemiological setting [Citation5], but the lack of further quantitative comparisons has resulted in limited knowledge of their equivalence, as well as a missing comparison with the Malmberg method. Through early studies, similarities between histamine and methacholine as provocative agents are well known [Citation6]. Nevertheless, comparison of the aforementioned protocols is a challenging task, considering that the endpoint level (provocative dose) varies between protocols and there are inherent differences in the testing substances, such as molecular mass and pharmacodynamics. A direct translation between provocative doses may yield erroneous interpretations. Therefore, a comparison study was needed.
The aim of this study was to find equivalent dose-response slopes and provocative dose values between the methods, for the same levels of bronchial response.
Methods
We recruited prospectively 31 volunteers, either patients with a referral for BHR testing or healthcare workers and included fractional exhaled nitric oxide (FENO) values from medical records if available.
We assessed BHR on the volunteers, employing two protocols with methacholine (Malmberg and Nieminen) and one protocol with histamine (Sovijärvi), all methods commonly employed in Finland, Sweden and Estonia. The challenge tests were performed in the Helsinki University Central Hospital area, Finland including the Skin and Allergy Hospital and the Laboratory of Clinical Physiology at the Meilahti Hospital, Finland. For each participant, the three challenge tests were scheduled within a two weeks period, with a minimum time interval of three days. The order of the challenge tests was based on the availability of the appointment times, with a fixed testing hour during the morning. Prior to BHR testing, the participants discontinued sympathomimetic and antimuscarinic medication according to the ATS technical standard [Citation7], and withheld antihistamines for at least five days. We followed the recent safety and quality standards [Citation8]. Additionally, the participants refrained from ingesting coffee, tea and cola for 4 h, alcohol for 24 h, and heavy meals or smoking 2 h before the challenge, in agreement with our laboratory guidelines. Furthermore, BHR was tested at least one month after any respiratory infections. The testing phase was during fall and winter seasons.
All participants signed a written consent agreement and the Helsinki University Hospital Ethical Committee approved our project (HUS 1417/2016). We followed the ethical principles stated in the Declaration of Helsinki [Citation9].
We determined a minimum of 30 participants in our study to achieve a statistical power of 80% for detecting an effect size of 0.25 (Cohen’s d) and an α error of 5% if considering repeated measurements with three methods and testing the difference between methods with an analysis of variance (ANOVA) test (G*Power 3.1.9.4 software)[Citation10].
Bronchial hyperreactivity protocols
Per Malmberg methacholine test
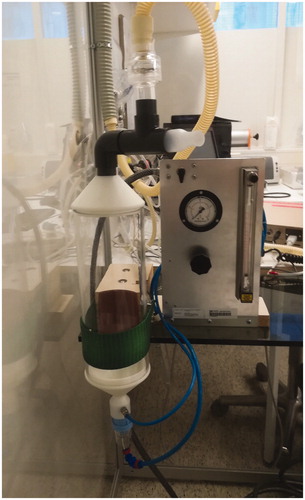
The device () developed by Malmberg et al. [Citation2], employs a drying device, a polymethyl methacrylate tower (Nova Plast, Karlskoga, Sweden) with 3.4 l volume and a Sidestream Durable jet nebuliser (Medic Aid Ltd, West Sussex, UK). The nebuliser chamber’s aerosol is driven by pressurised medical air (AGA, Espoo, Finland), supplied from a gas cylinder adjusted at 1.6 bar pressure, providing a primary flow towards the nebuliser of 8.7 l/min (20 °C, NTP). The Venturi-flow of 15.3 l/min (20° C, NTP) is adjusted by a Fischer and Porter rotameter (ABB Limited, Cambridgeshire, UK). These settings give a total flow in the drying device of 24 l/min and deliver the aerosol to the mouthpiece at the top of the tower. The mass output was determined gravimetrically, filling 3 ml of Aqua and nebulisation during 1 min, and set to 0.5–0.6 ml/min (20 °C, NTP). Reported mass median aerodynamic diameter (MMAD) for this setting is 1.7 µm [Citation2,Citation11]. Further on, the mass output was corrected with the efficiency coefficient 0.75, previously defined by Eklund et al. [Citation11].
Figure 1. Installation of the methacholine testing equipment according to Malmberg (©Pia Saarenkoski).
Before the methacholine challenge (5 min), FEV1 was determined by spirometry (Masterscreen, Jaeger GmbH, Würzburg, Germany). The dose delivered during 1 min was controlled through 15 tidal inspirations and expirations, each lasting 2 s and synchronised by a metronome, equivalent to 0.5 min total inhalation time and 0.8 l volume per inhalation [Citation12]. The delivered dose was determined by the product of the mass output (ml/min), the delivery time (0.5 min) and the methacholine concentration of the solution (mg/ml). The challenge started with 3 ml isotonic sodium chloride solution and the methacholine concentration was increased in doubling steps: 0.5, 1, 2, 4, 8, 16 and 32 mg/ml, respectively. The non-cumulated doses inhaled (after correction with the efficiency coefficient) at each step were: 0.1125, 0.225, 0.45, 0.9, 1.8, 3.6 and 7.2 mg, respectively. Accordingly, the cumulated doses were: 0.1125, 0.3375, 0.7875 , 1.6875 , 3.4875, 7.0875 and 14.2875 mg, respectively.
FEV1 was acquired 4 min after starting the inhalation of each dose. The time between doubling concentrations was 6 min. The challenge was performed until achieving a minimum reduction of 20% in FEV1 or until reaching the highest concentration of 32 mg/ml. The methacholine chloride solution employed (2-acetyloxypropyl(trimethyl)azanium; chloride) was prepared by the Helsinki University Hospital’s pharmacy.
Nieminen methacholine test
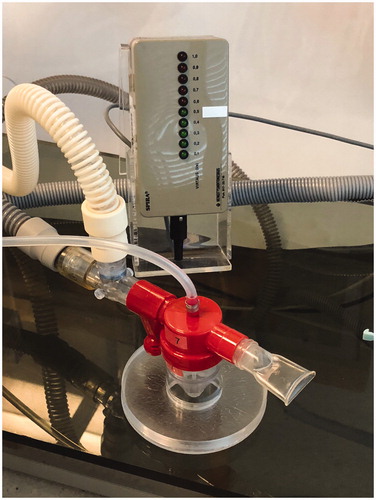
The protocol developed by Nieminen et al. [Citation3] employs a dosimetric Spira Elektro 2 automatic jet nebuliser device (Respiratory Care Centre, Hämeenlinna, Finland; ), driven by pressurised medical air at 2 bar and providing a primary flow towards the nebuliser of 7.5 l/min (20° C, NTP). It produces a MMAD of 1.6 µm [Citation13]. According to this protocol, the inhalation-synchronised-dosimeter delivers methacholine over 0.5 s triggered by tidal breath, controlled during nebulisation with an optimal inspiratory peak flowrate of 0.5 l/s and employs an inspiratory volume of at least 0.4 l. The optimal inspiratory flow level is visually controlled. In a five-step concentration increment, this setting provides cumulative doses of: 0.018, 0.072, 0.27, 0.81 and 2.6 mg, respectively. The five steps are: one inhalation at 2.5 mg/ml, three inhalations at 2.5 mg/ml, 11 inhalations at 2.5 mg/ml, three inhalations at 25 mg/ml and 10 inhalations at 25 mg/ml. The non-cumulated doses inhaled in the five steps are: 0.018, 0.054, 0.198, 0.540 and 1.78 mg, respectively [Citation14]. The time between the steps is 5 min. The mass output was determined gravimetrically [Citation14].
Figure 2. Spira Elektro 2 dosimeter employed in the Sovijärvi and Nieminen testing protocols.
Before the methacholine challenge (5 min), FEV1 was determined by spirometry (Masterscreen). After each step of the challenge, an FEV1 value was obtained. The challenge test was performed until achieving a minimum reduction of 20% in FEV1 or until reaching the highest dose of 2.6 mg.
Sovijärvi histamine test
Sovijärvi et al. [Citation4] established a rapid tidal-breathing-controlled dosimetric protocol with buffered histamine diphosphate as the provocative agent. The Sovijärvi method also utilises the aforementioned Spira Elektro 2 dosimeter with the following settings: drug delivery time 0.4 sec, starting inhalation volume 100 ml, controlled inspiratory volume of at least 0.5 l and inspiratory peak flow 0.5 l/s. The optimal inspiratory flow level is visually controlled. These settings produce, in fourfold increasing concentration increments, non-cumulative doses of 0.025, 0.1, 0.4 and 1.6 mg, respectively. The four steps are: one inhalation at 4 mg/ml, one inhalation at 16 mg/ml, four inhalations at 16 mg/ml and 16 inhalations at 16 mg/ml. The interval between steps is 5 min. The mass output was determined by weight [Citation4].
Prior to histamine challenge testing (5 min), FEV1 was obtained by spirometry (Masterscreen). FEV1 was measured after each dose, and the test continued until the onset of a 15% reduction in FEV1 or until the highest dose of 1.6 mg was given.
The Helsinki University Hospital’s pharmacy delivered the buffered histamine phosphate solution (2-(1 H-imidazol-5-yl)ethanamine; phosphoric acid).
Provocative dose
The provocative doses (PD) for each positive test were calculated (i.e. 15% FEV1 reduction for histamine (PD15) and 20% FEV1 reduction for methacholine (PD20)). We performed a two-point logarithmic interpolation of PD20 with the EquationEquation (1)(1)
(1) :
(1)
(1)
with D1 being the second to last dose (one step before D2), D2 the last dose provoking at least a 20% reduction in FEV1, R1 the FEV1 change in % measured after D1 and R2 the FEV1 change in % measured after D2 [Citation8].
For the histamine challenge test, the provocative dose causing a 15% reduction in FEV1 (PD15) was calculated with EquationEquation (1)(1)
(1) , by substituting 20 with 15.
The provocative dose was not calculated for subjects not achieving a significant reduction in FEV1 (i.e. 20% with methacholine and 15% with histamine). Nevertheless, we obtained response-dose slopes for all subjects (see statistics below).
The doses for the methacholine BHR tests are cumulative, since methacholine is regarded as partially having a cumulative effect [Citation15–17] during the testing time of 5–6 min. Additionally, the original protocols describe cumulative doses for methacholine. Histamine is rapidly metabolised [Citation15,Citation17], showing no significant cumulative effect and the doses delivered are regarded in the model as non-cumulative. Nevertheless, since the ERS technical standard on bronchial challenge testing recommends a non-cumulative approach on PD [Citation8], non-cumulative PDwere also calculated.
Statistics
Using the R language [Citation18] and Rstudio frontend version 1.1.383 (Boston, MA), we analysed the three protocols applying a mixed-effect model with crossed and nested effects (mathematical notation of the model is specified in the Supplementary Appendix A). The doses given for each subject are nested within each protocol and our study design specifies a crossed model, (i.e. every subject is tested with each protocol). The model defines random slopes for individual subjects, expressing the changes in FEV1 in percent per dose of the substance in milligrams. The intercepts were suppressed from the model, since physiologically the changes in FEV1 for each subject started from zero (a baseline FEV1 value of 100%). The mixed model was analysed with the lmer function from the lme4 package [Citation19], and we obtained the restricted maximum likelihood (REML) estimates. The p values for the fixed effects were calculated with the Satterthwaite’s method from the lmerTest package [Citation20].
We extracted the slopes (FEV1%/mg) for each subject and protocol and compared the differences in the log-transformed slopes between protocols with an ANOVA, passing the assumptions with a Shapiro-Wilk test, a Bartlett test and a Fligner-Killeen test. The untransformed slopes were tested for differences with a Kruskal-Wallis Rank Sum test. Furthermore, we fitted the slopes to a non-linear model with the obtained PD15 or PD20 as dependent variables. We specified a non-linear model for each protocol and applied the non-linear models to predict equivalent PD values between protocols, based on the slopes. We analysed the non-linear models with the Levenberg-Marquardt nonlinear least-squares algorithm nlsLM from the minipack.lm package [Citation21]. We regarded α = 0.05 as a significant level.
Results
The 28 participants completed the three challenges, except three participants, who omitted one methacholine test (Nieminen). No severe adverse reactions were observed. The characteristics of this population, including spirometric values are summarised in . The standard error of the mean (SEM) response in 31 subjects to histamine was a 7.2% (1.5) reduction in FEV1 per milligram. A 1mg dose of methacholine caused a mean 13.8% (4.2) reduction in FEV1 with the Nieminen method in 28 subjects and a 26% (7.3) reduction in FEV1 with the Malmberg method in 31 subjects. These fixed effects are visualised in . The mixed model (see Supplementary Appendix A) had an R2 of 0.99, i.e. explaining 99% of the variance in our population. The observed power of the model for the fixed effects was 97%.
Figure 3. Dose (mg) provoking FEV1 changes from baseline (%) for each substance. Lines depict the fixed effects from the mixed model and shaded area the 95% confidence interval.
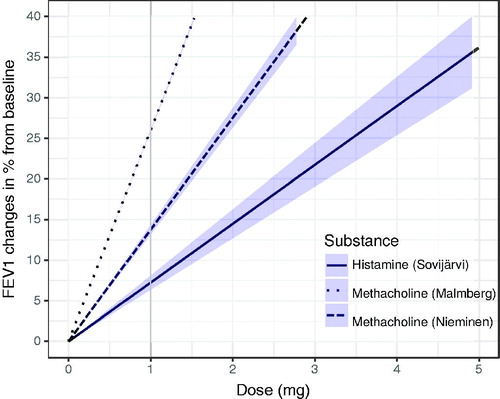
Table 1. Study participants’ demographics, spirometric, anthropometric data, medication and fractional expiratory nitric oxide (FENO) values.
The slopes (FEV1%/mg) were extracted from the model for each subject and separately for each method, and the individual slopes from the model and the individual response-dose measurements were plotted and arranged according to their steepness and can be found in the Supplementary Appendix A (Figures A1–A3). We found in testing with the non-parametric test between methods that, the differences in slopes (within-subjects) were not statistically significant (p = .22). The ANOVA of the log-transformed slopes produced similar results (p = .3). The distribution of all measured FEV1 responses for the three methods is plotted in .
Figure 4. Distribution (density) of all measured FEV1 changes in percent for the Sovijärvi, Malmberg and Nieminen methods.
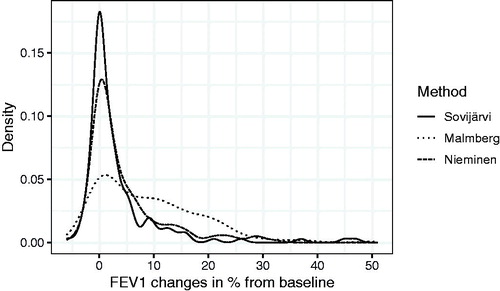
Figure 5. Non-linear regression modelling (EquationEquation (1)(1)
(1) ) of individual response-dose slopes, (i.e. FEV1 changes in percent per mg of methacholine and PD20 in mg with the Malmberg Method), N = 31.
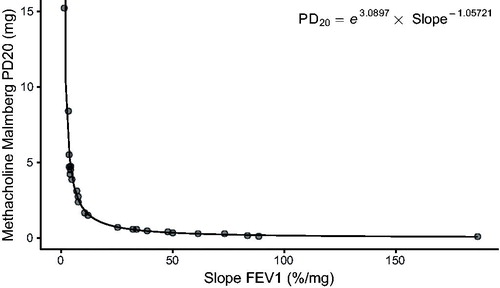
Fitting non-linear models to the PD and the extracted slopes resulted in the following regression equations:
(2)
(2)
(3)
(3)
(4)
(4)
where slope is the individual slope denoting the changes in FEV1 in percent per dose (mg) of inhaled substance, for the specific protocol and method. The estimates for the three models were statistically significant on the p < .001 level. exemplifies the model for methacholine and the Malmberg method (EquationEquation (2)
(2)
(2) ). The PD values employed for obtaining the models were the calculated PD values for the participants. These PD values were positive (i.e. 15% FEV1 reduction for histamine (PD15) and 20% FEV1 reduction for methacholine (PD20) with the highest dose) in 77% of the subjects with the Malmberg method, in 36% with the Nieminen method and 26% with the Sovijärvi method. shows the percentages of PD values with or without significant FEV1 decrease.
Table 2. Provocative doses (PD) classified according to the studied methods in our study population (n = 31).
We predicted a series of PD15 and PD20 values with equal slopes utilising the EquationEquations (2)–(4). These equivalent predicted provocative dose values are presented in (selected cut-point values) and extensively in Table A1 in Supplementary Appendix A.
Table 3. Predicted equivalent provocative doses (mg) and corresponding slope values.
Non-cumulative results for PD and tables can be found in Supplementary Appendix B.
Discussion
Mean reduction in FEV1 in the three dosimetric methods
We found that the response-dose relationship in the assessment of BHR was different between the methods when analysing the fixed effects (i.e. the mean FEV1 changes per milligram of test substance independent from the individual responses). The Malmberg method produced the greatest reduction in FEV1 per milligram, followed by the Nieminen method, both employing methacholine as the test substance. The Sovijärvi method with histamine produced the least changes per milligram. Preceding studies argue that when considering the molar masses of histamine and methacholine, their effect is roughly equivalent when employing the same protocol and device [Citation6]. Our results also indicate similarities when applying molar masses instead of mass (mg) to the Sovijärvi and Nieminen protocols, which utilise an identical device and considering a small disagreement probably originating from the characteristics of the substances used, since, as earlier reported, methacholine may partially have a cumulative effect and histamine not. Analysing the distribution of the FEV1 responses reveals similar curves for the Sovijärvi and Nieminen methods, but the Malmberg protocol produced a higher frequency of FEV1 responses over 20 percent from the baseline. Malmberg et al. [Citation2] developed the drying tower to improve the efficacy of the device and reported a 1.6-fold greater response in FEV1 changes than without the drying tower. This partly supports our findings concerning the differences between the methacholine protocols. It may be speculated that the afore-mentioned overall differences for the Malmberg methodology may result from an indirect stimulus caused by dry-air. This indirectly acting bronchoconstrictive effect of mucosal dehydration [Citation22] may sum up with the direct effect of methacholine on airway smooth muscle.
We employed mass (mg) and the accumulation as in the original protocols, despite their differences, because our main aim was to find corresponding PD in milligram, as near as the clinically employed protocols. For informational purposes, additional guideline-accurate non-cumulative PD’s was provided, with corresponding response-dose slopes. These non-cumulative values are very near to the cumulative values, supporting the fact, that the cumulative effect of methacholine is very limited within the testing times [Citation8]. Furthermore, the assumption of delivered doses in all the investigated methods were originally based on gravimetric measurements, which are inaccurate, since gravimetrical estimation of the mass output ignores evaporation, resulting in over-estimation of the mass output and the dose also. From this fact originates some degree of discrepancies between methods that is expressed as differences in PD values. The Malmberg protocol includes an adjustment considering evaporation [Citation11]. Evaporation values for the Sovijärvi and Nieminen methods are not currently available. Nevertheless, all the three methods have reported MMAD values, which are almost identical and therefore the issue of different particle sizes affecting the bronchial response could be eliminated.
Response categories
Reported response categories
For the three different BHR provocation tests, cut-off values were previously determined in different populations and with distinct methods. For the Malmberg method [Citation23], a PD20 of 0.6 mg corresponded to an 80% sensitivity in asthmatics (n = 102) and an 85% specificity in healthy subjects (n = 203).
Nieminen et al. [Citation24] retrospectively gathered PD20 values in an adult population (n = 791), including patients with asthma, allergic rhinitis, chronic bronchitis and healthy subjects. This study yielded the following cut-off categories of BHR: no reaction, PD20 >2.6 mg; mild, 2.6–0.61 mg; moderate, 0.6–0.15 mg; marked, <0.15 mg.
Sovijärvi et al. [Citation4] acquired cut-off values for histamine challenge testing with clinical material, including patients with asthma (n = 64), chronic bronchitis (n = 71), chronic rhinitis (n = 41) and healthy subjects (n = 31). The cut-off values were classified as the following: no reaction, PD15 >1.6 mg; mild, 1.6–0.41 mg; moderate, 0.4–0.11 mg; marked, ≤0.1 mg. The analyses of the asthmatic patients in the study [Citation4], showed a sensitivity of 86% and specificity of 92% with a PD15 cut-off level of 0.1 mg and a sensitivity of 66% and specificity of 100% with a PD15 cut-off level of 0.4 mg.
Response-dose slopes and PD
When examining the individual slopes of the response-dose relationship, the individual slopes were similar between the methods. We assumed equal method-independent slopes, as a measure of individual reactivity and obtained PD for each method with the slopes extracted from the mixed model. These equivalent PD are very near to the clinically significant cut-off values reported by the original studies [Citation4,Citation23,Citation24].
Moderate and mild hyperreactivity
The equivalent dose-response slopes are similar for the PD reported by Sovijärvi et al. [Citation4] and Nieminen [Citation24], when observing the cut-off between moderate and mild hyperreactivity (see bold values in ). We can assert that these cut-off values are interchangeable. With the Malmberg method, this equivalent response-dose slope translates into an analogous provocative dose of approximately 0.8 mg.
Ehrs et al. [Citation23] reported a cut-off value for the Malmberg method of 0.6 mg methacholine to distinguish between healthy and asthmatic subjects, which equals provocative doses of 0.4 mg for Nieminen and 0.3 mg histamine for Sovijärvi. This cut-point value lies between moderate and marked hyperreactivity.
Marked hyperreactivity
When observing the corresponding cut-off values for marked hyperreactivity, a similarity between the Sovijärvi and Nieminen provocative doses is seen. For the Malmberg method, no provocative dose has previously been reported to define marked hyperreactivity. Our results imply that this provocative dose corresponds to 0.3 mg of methacholine with the Malmberg method.
No hyperreactivity
The borders for classifying a normal reaction (no hyperreactivity) were more far away, when analysing the Sovijärvi and Nieminen methods. This may suggest differences in the grading of no hyperreactivity between the Sovijärvi and Nieminen methods.
Previous studies
Our results find support from Juusela et al. [Citation5], who found good agreement between the cut-off values for moderate and as well as marked BHR between the dosimetric methods of Sovijärvi and Nieminen but found only a moderate agreement for the cut-off values for a negative reaction. Response-dose slopes have been previously investigated and have been found able to discern between healthy and asthmatic subjects [Citation25]. These slopes were proven useful in population studies [Citation26], with good repeatability [Citation27]. Preceding Malmberg method analyses of the response-dose slopes and PD20 have found values in different studies and populations, that when compared to our dose-response slopes and provocative dose equivalences, show similar values [Citation12,Citation28,Citation29]. However, to the best of our knowledge, there are no earlier comparisons between the Malmberg and other BHR testing methods.
Utility
We provided an exhaustive table with equivalent provocative doses as reference for clinical application. Our reference table provides aid when comparing patient results obtained with different methods. Additionally, it facilitates comparison of epidemiological results. Recent population-based studies and clinical trials utilise one of the aforementioned testing methods each: Sovijärvi [Citation30–37], Malmberg [Citation38–41] or Nieminen [Citation14,Citation42–44]; the reference table may serve the purpose of offering comparisons in these example studies and others, or in future studies. Nowadays, the supply of histamine as a challenge test substance is very limited, therefore, a comparison to other challenge methods was also needed.
Strengths and limitations
The strengths of this study are employing the unmodified equipment and the original protocols for the comparison, except for omitting a step with inhalation of saline solution described in the Nieminen method. This omission is due to practicability. Additionally, we performed carefully the challenge tests with varying test order. Nevertheless, the number of volunteers acquired was limited, due to lack of motivation in potential study candidates to perform three challenge tests, availability of the tests and interruptions in the three-day protocol. Although the number of participants could represent a limiting factor, we calculated a priori a minimum of 30 participants needed for the study and fulfilled this objective. Our results indicate a difference in the methods studied, giving discordant quantities of positive results. However, we showed that evaluating the FEV1 reduction and dose-response slopes resulted in similarities between the methods at the level of PD15 or PD20, when regarding the diagnostic cut-off levels for asthma. This was more evident with the Sovijärvi and Nieminen methods.
Conclusion
In conclusion, we provided equivalent provocative doses for the Per Malmberg, Nieminen, and Sovijärvi methods of BHR testing and determined that the available cut-off values for a moderate reaction and a marked reaction between the Sovijärvi and Nieminen methods are similar. Additionally, we deduced cut-off values for the Malmberg method. The response-dose slopes can be used when comparing BHR methods in further physiological research.
Ethical approval
All procedures performed in studies involving human participants were in accordance with the ethical standards of the 1964 Helsinki declaration and its later amendments or comparable ethical standards.
Informed consent
Informed consent was obtained from all individual participants included in the study
Author contributions
AS, PLK, and PP conceived and designed the research. PM and PP supervised the experiments. BMS contributed with experimental tools. PLK analysed the data and wrote the manuscript, under the tutelage of PP. AS, BMS, PM and PP reviewed the manuscript. All authors read and approved the manuscript.
| Abbreviations | ||
| ANOVA | = | analysis of variance |
| BHR | = | bronchial hyperreactivity |
| CI | = | confidence interval |
| FENO | = | fractional exhaled nitric oxide |
| FEV1 | = | forced expiratory volume in one second |
| IQR | = | interquartile range |
| MMAD | = | mass median aerodynamic diameter |
| NTP | = | normal temperature and pressure |
| PD | = | provocative dose |
| SEM | = | standard error of the mean |
Supplemental Material
Download EPS Image (18.6 KB)Supplemental Material
Download EPS Image (17.8 KB)Supplemental Material
Download EPS Image (19.6 KB)Supplemental Material
Download MS Word (11.3 KB)Supplemental Material
Download MS Word (10.7 KB)Acknowledgments
The authors thank staff members from the Skin and Allergy Hospital and the Laboratory of Clinical Physiology at the Meilahti Hospital, particularly Pia Saarenkoski, Helena Punkari and Elina Voutilainen for performing the challenge tests. The authors also thank Anna But, PhD from the Faculty of Medicine, University of Helsinki for providing statistical counselling, Alyce Whipp, MPH for the language revision and Pia Saarenkoski for giving permission to reproduce .
Disclosure statement
The authors declare that they have no conflict of interest.
Additional information
Funding
References
- Sterk PJ, Fabbri LM, Quanjer PH, et al. Standardized challenge testing with pharmacological, physical and sensitizing stimuli in adults. Eur Respir J. 1993;6:53–83.
- Malmberg P, Larsson K, Thunberg S. Increased lung deposition and biological effect of methacholine by use of a drying device for bronchial provocation tests. Eur Respir J. 1991;4:890–898.
- Nieminen MM, Lahdensuo A, Kellomaeki L, et al. Methacholine bronchial challenge using a dosimeter with controlled tidal breathing. Thorax. 1988;43:896–900.
- Sovijärvi ARA, Malmberg LP, Reinikainen K, et al. A rapid dosimetric method with controlled tidal breathing for histamine challenge: repeatability and distribution of bronchial reactivity in a clinical material. Chest. 1993;104:164–170.
- Juusela M, Poussa T, Kotaniemi J, et al. Bronchial hyperresponsiveness in a population of north Finland with no previous diagnosis of asthma or chronic bronchitis assessed with histamine and methacholine tests. Int J Circumpolar Health. 2008;67:308–317.
- Higgins BG, Britton JR, Chinn S, et al. Comparison of histamine and methacholine for use in bronchial challenge tests in community studies. Thorax. 1988;43:605–610.
- Crapo RO, Casaburi R, Coates AL, et al. Guidelines for methacholine and exercise challenge testing-1999. This official statement of the American Thoracic Society was adopted by the ATS Board of Directors, July 1999. Am J Respir Crit Care Med. 2000;161:309–329.
- Coates AL, Wanger J, Cockcroft DW, et al. ERS technical standard on bronchial challenge testing: general considerations and performance of methacholine challenge tests. Eur Respir J. 2017;49:1601526.
- World Medical Association. World Medical Association Declaration of Helsinki: ethical principles for medical research involving human subjects. JAMA. 2013;310:2191.
- Faul F, Erdfelder E, Lang AG, et al. G*Power 3: a flexible statistical power analysis program for the social, behavioral, and biomedical sciences. Behav Res Methods. 2007;39:175–191.
- Eklund L, Sundblad BM, Malmberg P, et al. The salt output of a nebulizer-a comparison between two nebulizer types. Respir Med. 2000;94:139–144.
- Sundblad BM, Larsson M, Palmberg L, et al. Exhaled nitric oxide and bronchial responsiveness in healthy subjects exposed to organic dust. Eur Respir J. 2002;20:426–431.
- Nieminen MM, Holli H, Lahdensuo A, et al. Aerosol deposition in automatic dosimeter nebulization. Eur Respir JDis. 1987;71:145–152.
- Malmberg LP, Kauppi P, Mäkelä MJ. Standardizing dose in dosimetric bronchial challenge tests. Clin Physiol Funct Imaging . 2018;38:903–906.
- Martindale: The Complete Drug Reference. [Internet]. 2018 [cited 2018 Jun 28]. Available from: https://www.medicinescomplete.com/#/content/martindale/4520-n#content%2Fmartindale%2F4520-n%234520-a4-b
- Simard B, Turcotte H, Cockcroft DW, et al. Deep inspiration avoidance and methacholine response in normal subjects and patients with asthma. Chest. 2005;127:135–142.
- Juniper EF, Frith PA, Dunnett C, et al. Reproducibility and comparison of responses to inhaled histamine and methacholine. Thorax. 1978;33:705–710.
- R Core Team. R: a language and environment for statistical computing [Internet]. Vienna (Austria): R Foundation for Statistical Computing; 2018.
- Bates D, Mächler M, Bolker B, et al. Fitting linear mixed-effects models using lme4. JStat Softw. 2015;67.
- Kuznetsova A, Brockhoff PB, Christensen R. lmerTest package: tests in linear mixed effects models. J Stat Softw. 2017;82.
- Elzhov TV, Mullen KM, Spiess AN, et al. minpack.lm: R Interface to the Levenberg-Marquardt nonlinear least-squares algorithm found in MINPACK, plus support for bounds [Internet]. 2016. Available from: https://CRAN.R-project.org/package=minpack.lm
- Hallstrand TS, Leuppi JD, Joos G, et al. ERS technical standard on bronchial challenge testing: pathophysiology and methodology of indirect airway challenge testing. Eur Respir J. 2018;52:1801033.
- Ehrs PO, Sundblad BM, Larsson K. Quality of life and inflammatory markers in mild asthma. Chest. 2006;129:624–631.
- Nieminen MM. Unimodal distribution of bronchial hyperresponsiveness to methacholine in asthmatic patients. Chest. 1992;102:1537–1543.
- O’Connor G, Sparrow D, Taylor D, et al. Analysis of dose-response curves to methacholine: an approach suitable for population studies. Am Rev Respir Dis. 1987;136:1412–1417.
- Peat JK, Salome CM, Berry G, et al. Relation of dose-response slope to respiratory symptoms and lung function in a population study of adults living in Busselton, Western Australia. Am Rev Respir Dis. 1992;146:860–865.
- Peat JK, Salome CM, Bauman A, et al. Repeatability of histamine bronchial challenge and comparability with methacholine bronchial challenge in a population of Australian schoolchildren. Am Rev Respir Dis. 1991;144:338–343.
- Sundblad BM, Malmberg P, Larsson K. Different response to doubling and fourfold dose increases in methacholine provocation tests in healthy subjects. Chest. 2000;118:1371–1377.
- Sundblad BM, Larsson K. Effect of deep inhalations after a bronchial methacholine provocation in asthmatic and non-asthmatic subjects. Respir Med. 2002;96:477–481.
- Juusela M, Pallasaho P, Rönmark E, et al. Dose-dependent association of smoking and bronchial hyperresponsiveness. Eur Respir J. 2013;42:1503–1512.
- Juusela M, Pallasaho P, Sarna S, et al. Bronchial hyperresponsiveness in an adult population in Helsinki: decreased FEV1, the main determinant. Clin Respir J. 2013;7:34–44.
- Koskela HO, Purokivi MK. Airway oxidative stress in chronic cough. Cough. 2013;9:26.
- Koskela HO, Purokivi MK. Capability of hypertonic saline cough provocation test to predict the response to inhaled corticosteroids in chronic cough: a prospective, open-label study. Cough. 2013;9:15.
- Feng M, Yang Z, Pan L, et al. Associations of early life exposures and environmental factors with asthma among children in rural and urban areas of Guangdong, China. Chest. 2016;149:1030–1041.
- Selinheimo S, Vuokko A, Sainio M, et al. Comparing cognitive-behavioural psychotherapy and psychoeducation for non-specific symptoms associated with indoor air: a randomised control trial protocol. BMJ Open. 2016;6:e011003.
- Koskela HO, Lätti AM, Purokivi MK. Long-term prognosis of chronic cough: a prospective, observational cohort study. BMC Pulm Med. 2017;17:146.
- Suojalehto H, Karvala K, Ahonen S, et al. 3-(Bromomethyl)-2-chloro-4-(methylsulfonyl)- benzoic acid: a new cause of sensitiser induced occupational asthma, rhinitis and urticaria. Occup Environ Med. 2018;75:277–282.
- Palmberg L, Sundblad BM, Lindberg A, et al. Long term effect and allergic sensitization in newly employed workers in laboratory animal facilities. Respir Med. 2015;109:1164–1173.
- Palmberg L, Sundblad BM, Ji J, et al. Cholinergic mechanisms in an organic dust model simulating an acute exacerbation in patients with COPD. COPD. 2018; 13:3611–3624.
- Hedelin AS, Sundblad BM, Sahlander K, et al. Comparing human respiratory adverse effects after acute exposure to particulate matter in conventional and particle-reduced swine building environments. Occup Environ Med. 2016;73:648–655.
- Backman H, Hedman L, Stridsman C, et al. A population-based cohort of adults with asthma: mortality and participation in a long-term follow-up. Eur Clin Respir J. 2017;4:1334508.
- Blumberga G, Groes L, Dahl R. SQ-standardized house dust mite immunotherapy as an immunomodulatory treatment in patients with asthma. Allergy. 2011;66:178–185.
- Vollsaeter M, Skromme K, Satrell E, et al. Children born preterm at the turn of the millennium had better lung function than children born similarly preterm in the early 1990s. PLoS ONE. 2015;10:e0144243.
- Garcia-Larsen V, Potts JF, Del Giacco S, et al. Changes in symptoms of asthma and rhinitis by sensitization status over ten years in a cohort of young Chilean adults. BMC Pulm Med. 2016;16:116.
- Viljanen AA, Halttunen PK, Kreus KE, et al. Spirometric studies in non-smoking, healthy adults. Scand J Clin Lab Investig. 1982;42:5–20.