
Abstract
Shrunken pore syndrome (SPS) is defined by a cystatin C-based estimation of glomerular filtration rate (eGFRCYS) being less than 60% or 70% of a creatinine-based GFR estimation (eGFRCR) in the absence of extrarenal influences on cystatin C or creatinine concentrations. SPS has been associated with a substantial increase in mortality or morbidity in all investigated populations. However, in these studies, neither the diagnoses, nor causes of death were described, and only estimated GFR was available. The present study concerns 2781 individuals with measured GFR (mGFR), known diagnoses, and known causes of death during 5.6 years in median. Cox multivariate proportional hazards regression model was used to estimate hazard ratios (HR) for all-cause and cancer, cardiovascular, diabetes or chronic kidney disease (CKD) as cause-specific mortality among patients with SPS. At an eGFRCYS/eGFRCR-ratio <0.70, the adjusted SPS death risk in the total cohort (HR 3.0, 95% CI 2.4–3.7) was clearly higher than that for the other diagnosis groups. In a sub-cohort of 1300 persons with or without diagnosis, but with normal mGFR, the all-cause mortality of SPS was markedly increased (HR 4.1, 95% CI 2.6–6.5). In a sub-cohort of 567 persons with normal mGFR and no diagnosis, the all-cause mortality of SPS was even more increased (HR 7.3, 95% CI 2.3–23). The prevalence of SPS in the total cohort was 23% and in the sub-cohorts 17 and 12%, respectively. As SPS is associated with a high mortality, occurs in the absence of reduced mGFR and albuminuria, it expands the spectrum of kidney disorders.
Keywords:
Introduction
According to studies by Norden et al. the glomerular sieving coefficients for 10–30 kDa proteins in the human kidney are relatively high with coefficients between 0.07 and 0.9 [Citation1]. Similar sieving coefficients for proteins of corresponding sizes have been observed in the rat kidney [Citation2]. These relatively high sieving coefficients, combined with the high production of ultrafiltrate in health, means that peptides and proteins ≤30 kDa in plasma normally are mainly catabolised by the kidneys and have a high turnover. For example, at least 85% of the catabolism of cystatin C occurs in the kidney [Citation3]. The production of ultrafiltrate corresponds to the glomerular filtration rate (GFR), which usually is measured, or estimated, using molecules like creatinine, 51Cr-EDTA, iohexol, or iothalamate with molecular masses between 0.113 and 0.821 kDa. A pertinent question is then whether a reduction in the renal excretion of these small molecules always will correspond to an exactly equal reduction in the renal excretion of 10–30 kDa molecules. Invasive clearance studies in humans and rats show that this is not the case [Citation4–8]. In one of these studies, neutral dextrans of various sizes were used in pregnant females and showed, that the renal clearance of molecules corresponding 10–30 kDa proteins, is decreased in the third trimester, whereas the renal excretion of small molecules, corresponding to measured GFR (mGFR), is not [Citation6]. In another study of patients with diabetic nephropathy, neutral dextrans or cystatin C were used to measure glomerular filtration of molecules of various sizes, and it demonstrated that the filtration of cystatin C was reduced before that of iothalamate due to a reduction in mean glomerular pore size [Citation7]. We have interpreted our observations of a selective accumulation of 10–30 kDa proteins in the third trimester of pregnancy despite a normal GFR [Citation9,Citation10], as consequences of the selective reduction in the renal clearance of 10–30 kDa molecules shown by previous invasive studies [Citation6] and corresponding to shrunken pores in the pore model of glomerular filtration [Citation11,Citation12]. We have suggested that a simple way of demonstrating such a size-selective reduction in the glomerular filtration rate is to compare the ratio of a cystatin C- (eGFRCYS) and a creatinine (eGFRCR) based estimate of GFR [Citation11]. If the eGFRCYS/eGFRCR-ratio is <0.60 or <0.70, in the absence of known extrarenal influences on the levels of cystatin C or creatinine, we have suggested that it represents the presence of a syndrome tentatively called shrunken pore syndrome (SPS) [Citation11]. Several studies of SPS have been done and all of them show that the long-term mortality [Citation13–17], or morbidity [Citation17,Citation18], of individuals with SPS are strongly increased, even in the absence of reduced GFR.
But in all these studies, neither the diagnoses present when SPS was investigated, nor the death causes were reported, and no data for measured GFR available. The aim of the present study, which was based on the Lund Cystatin C Standardization (LCS) cohort with known mGFR [Citation19], was to study the association between SPS and mortality while controlling for general patient characteristics and disease history.
Material and methods
Study cohort
The cohort represents the patients’ first GFR examination in the Lund Cystatin C Standardization (LCS) cohort, primarily established to generate a new cystatin C-based GFR-estimating equation (the CAPA equation) [Citation19]. The LCS cohort is based on consecutive Swedish Caucasian (≥99%) patients above 18 years referred for determination of GFR at Skåne University Hospital, Lund, from May 2008 to March 2010. Common causes for referral were manifest or suspected diabetic nephropathy, interstitial nephritis, glomerulonephritis, nephrotic syndrome, haematuria, proteinuria, reflux nephropathy, myeloma, vasculitis, consideration of initiation of haemodialysis, evaluation of potential renal donors, control after kidney transplantation, and to dose drugs cleared by the kidneys. Among the original 2847 cohort members, 42 were excluded due to invalid personal registration number and 24 due to survival less than one month, leaving 2781 unique patients for the present study (). The study was approved by the local ethics committee (permissions LU 2015/860 and 2016/169). Patient data and samples were treated pseudonymized in all statistical analyses.
Table 1. Basic characteristics of the Lund Cystatin C standardization cohort, stratified by the quartiles of the ratio of estimated GFR according to CAPACYS and LMRCR.
Measurement of GFR
GFR was measured as plasma clearance of iohexol [Citation20–22].
Measurements of cystatin C and creatinine
Cystatin C was determined by a particle-enhanced immunoturbidimetric method using a reference material traceable to the international cystatin C calibrator [Citation19,Citation23] and creatinine by an enzymatic colorimetric assay using a calibrator traceable to a primary reference material with values assigned by isotope dilution mass spectrometry [Citation24].
Register linkage
The cohort was followed longitudinally from one month after the date of the first GFR determination during 2008–2010 with respect to survival in the Swedish population register until Feb 28, 2016.
Data on cause-specific deaths were obtained from the cause of death register hosted by the National Board of Health and Welfare in Sweden. The cause-specific deaths were grouped according to ICD-10 as cancer (C00.0–C97.9), CVD (I10.0–I82.9), DM (E10.0–E14.9), or CKD (N18.1–N18.9). Each patient´s history of disease was obtained from the patient register and grouped in the same way as cause-specific deaths. Cancer and CVD diagnoses were included from 5 years before, DM and CKD included all previous diagnoses and up to 1 month after the date of the patients’ first GFR determination. The date of diagnosis closest to the date of the patients’ first GFR determination was used.
Statistical analysis
All statistical analyses were conducted using STATA version 14.2 (StataCorp.). Kaplan–Meier estimates were used to present sex-specific survival probabilities in four eGFRCYS/eGFRCR-ratio intervals using the cystatin C-based CAPA-equation [Citation19] (CAPACYS) and the creatinine-based LMR equation (LMRCR) [Citation25]. Cox regression was used to model the association between the categorized eGFRCYS/eGFRCR-ratio and all-cause and cause-specific mortality with adjustment for age (continuous; per 10 years), sex, BMI (<20, 20–24, 25–29 or ≥30 kg/m2), history of disease at baseline (cancer, CVD, DM and CKD), mGFR, eGFRCR and eGFRCYS. The GFR-variables were entered categorized as <30, 30–59, 60–89 or ≥90 mL/min/1.73 m2 in the regression models. We conducted statistical trend tests by using the eGFRCYS/eGFRCR-ratio as a continuous variable in separate analyses. Results were presented as hazard ratios with 95% confidence intervals (CIs), combined or stratified by sex. Several sensitivity analyses were performed with all-cause mortality as outcome: 1) additional categorization of the eGFRCYS/eGFRCR-ratio in six groups, 2) estimating the eGFRCYS/eGFRCR-ratio with two additional pairs of GFR-estimating equations, 3) restriction to patients without any of the disorders studied (cancer, CVD, DM, CKD; n = 1049), 4) restriction to patients with measured GFR ≥60 mL/min/1.73m2 (n = 1300), 5) restriction to patients with both normal measured GFR (≥60 mL/min/1.73m2) and no diagnosis (n = 567), 6) excluding variables (CAPACYS, LMRCR, or mGFR) from the regression models, either one at a time or simultaneously.
Results
All-cause mortality in the total cohort
The study cohort constituted 2781 adult persons consecutively referred to Skåne University Hospital, Lund, for determination of mGFR by iohexol clearance 2008–2010 and followed until 2016 (median follow-up 5.6 years). The distribution of the eGFRCYS/eGFRCR-ratio is shown in . summarizes available baseline characteristics, stratified in four groups based on the eGFRCYS/eGFRCR-ratio obtained using the cystatin C-based CAPA-equation (CAPACYS) [Citation19] and the creatinine-based LMR equation (LMRCR) [Citation25]. The mortality in the total cohort was 37.7%. shows the survival stratified by sex. Cox regression analysis was used to study all-cause mortality as a function of different CAPACYS/LMRCR-ratio intervals. There was a significant increase in all-cause mortality for all eGFRCYS/eGFRCR-ratio intervals below 1.00 (ptrend <.001; ). The group with the lowest ratio interval (<0.70) displayed an adjusted HR for mortality of 3.0 (95% CI 2.4–3.7) when the ratio interval ≥1.0 was used as reference group. Diagnoses of cancer, diabetes mellitus (DM), cardiovascular disease (CVD), or CKD, all displayed a lower adjusted HR for mortality than SPS defined by an eGFRCYS/eGFRCR-ratio of <0.70 (). Low eGFR based upon cystatin C (CAPACYS) was also associated with an increase in mortality, but the HR was lower than that of the SPS-groups defined by the eGFRCYS/eGFRCR-ratio intervals <0.70 or 0.70–0.84. Neither a low eGFR (<30mL/min/1.73m2) based upon creatinine (LMRCR), nor a low mGFR (<30mL/min/1.73m2) was associated with an increase in mortality in the adjusted analysis (, columns B and C). Associations between low eGFRCYS/eGFRCR-ratios and all-cause mortality were present both among male and females ().
Figure 1. Distribution of the eGFRCYS/eGFRCR-ratio, calculated using three pairs of eGFR equations. CAPACYS and LMRCR [Citation19,Citation25]. CKD-EPICYS and CKD-EPICR [Citation26]. FASCYS and FASCR [Citation27].
![Figure 1. Distribution of the eGFRCYS/eGFRCR-ratio, calculated using three pairs of eGFR equations. CAPACYS and LMRCR [Citation19,Citation25]. CKD-EPICYS and CKD-EPICR [Citation26]. FASCYS and FASCR [Citation27].](/cms/asset/25537a47-7ba5-4146-a0ce-33478921b062/iclb_a_1759139_f0001_c.jpg)
Figure 2. Survival stratified on the quartiles of the ratio of estimated GFR using the CAPACYS and LMRCR equations (<0.70, 0.70–0.84, 0.85–0.99 and ≥ 1.00) for all 1332 female (A) and 1449 male (B) patients.
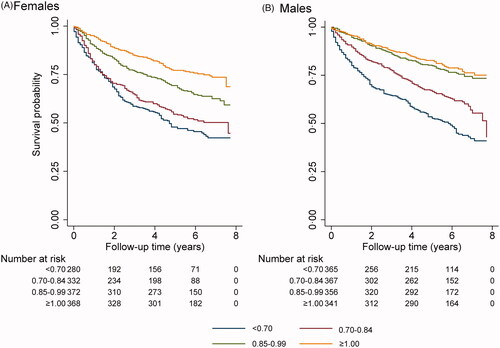
Table 2. Cox regression for all-cause mortality in the Lund Cystatin C standardization cohort (n = 2781).
Table 3. Cox regression for all-cause mortality in the Lund Cystatin C standardization cohort stratified by sex (males; n = 1429, and females; n = 1352)
Sensitivity analysis using six eGFRCYS/eGFRCR-ratio intervals
When an analysis was undertaken using six, rather than four, eGFRCYS/eGFRCR-ratio intervals, it was found that there is a progressive increase of all-cause mortality with a decrease of the ratios starting at the interval 0.70–0.84 (, ).
Figure 3. Survival stratified on 6 groups for the ratio of estimated GFR using the CAPACYS and LMRCR equations (six groups; <0.60, 0.60–0.69, 0.70–0.84, 0.85–0.99, 1.00–1.09 and ≥1.10) for all 2781 patients.
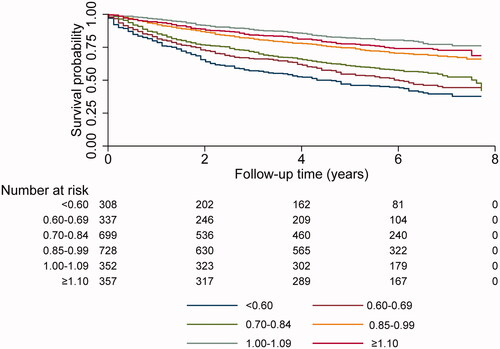
Table 4. Cox regression for all-cause mortality in the Lund Cystatin C standardization cohort (n = 2781) using 6 groups for the CAPACYS/LMRCR ratio.
All-cause mortality using two additional pairs of cystatin C- and creatinine-based GFR estimating equations
Similar results for all-cause mortality of the total cohort were obtained when the eGFRCYS/eGFRCR-ratio intervals used to categorize the population were based upon the CKD-EPICYS and CKD-EPICR equations [Citation26] () or the FASCYS and FASCR equations [Citation27] (), as when the eGFRCYS/eGFRCR-ratio intervals used were based upon the CAPACYS-and LMRCR-equations [Citation19,Citation25].
Table 5. Cox regression for all-cause mortality in the Lund Cystatin C standardization cohort (n = 2781) using eGFRCYS/eGFRCR-ratio intervals based on the CKD-EPI equations.
Table 6. Cox regression for all-cause mortality in the Lund Cystatin C standardization cohort (n = 2781) using eGFRCYS/eGFRCRc ratio intervals based on the FAS equations.
Cause-specific mortality in the total cohort
Cause-specific mortality was studied for the total cohort (). A decreased eGFRCYS/eGFRCR-ratio was associated with higher mortality due all specific causes investigated, but with larger statistical uncertainty in the less common causes of death (DM or CKD).
Table 7. Cox regression for cause-specific mortality in the Lund Cystatin C standardization cohort (n = 2781).
All-cause mortality for a sub-cohort of persons without diagnoses of cancer, CVD, DM or CKD
All-cause mortality was investigated in a sub-cohort of 1049 persons without any of the disorders studied (cancer, CVD, DM, CKD; overall mortality 21%) at baseline and using the CAPACYS- and the LMRCR-equations. The all-cause mortality in this sub-cohort also increased markedly and continuously with a reduction of the eGFRCYS/eGFRCR-ratio and showed an adjusted HR of 3.7 (95% CI 2.2–6.1) when the ratio was <0.70 ( and ).
Table 8. Cox regression for all-cause mortality in three sub-cohorts, patients with no prior diagnosis (n = 1049), patients with normal measured GFR (≥60 mL/min/1.73m2; n = 1300), and patients with both normal mGFR and no prior diagnosis (n = 567).
Table 9. Total all-cause mortality (%), prevalence (%) of SPS and hazard ratios (HR) for all-cause mortality using different eGFRCYS/eGFRCR-ratios for the SPS diagnosis.
All-cause mortality for a sub-cohort of persons with normal mGFR regardless diagnosis
It has previously been repeatedly described that all-cause mortality for patients with SPS is also significantly increased in individuals with normal GFR (≥60 mL/min/1.73m2) at baseline [Citation13–17]. But in these studies, only estimated GFR was available. In the present investigation measured GFR was available for all patients, so we used Cox analysis to determine all-cause mortality for the sub-cohort of 1300 patients with normal mGFR regardless diagnosis (≥60 mL/min/1.73m2; overall mortality 30.2%), at baseline. Also, in this sub-cohort the all-cause mortality increased markedly and continuously with a reduction of the eGFRCYS/eGFRCR-ratio and showed a HR of 4.1 (95% CI 2.6–6.5), when the ratio was <0.70 ( and ). In this sub-cohort cancer was also associated with an increase in all-cause mortality, but not CVD, DM or CKD ().
All-cause mortality for a sub-cohort of persons with normal mGFR and no diagnoses of cancer, CVD, DM or CKD
All-cause mortality was investigated in a third sub-cohort of 567 persons with normal mGFR and without any of the disorders studied (overall mortality 11.8%) at baseline. The prevalence of SPS was lower (11.5%) in this cohort than in all other investigated sub-cohorts (). Nevertheless, the all-cause mortality in this sub-cohort also was markedly and progressively increased with a reduction of the eGFRCYS/eGFRCR-ratio and showed an adjusted HR of 7.3 (95% CI 2.3–23) when the ratio was <0.70 ( and ).
Prevalence of SPS in the four cohorts
In most previous studies eGFRCYS/eGFRCR-ratios of 0.60 or 0.70 have been used for identifying SPS. The prevalence of SPS, using both ratios, is shown in for the studied cohorts, i.e. the total cohort and the three sub-cohorts. The corresponding HRs for all-cause mortality are also shown in . The prevalence of SPS at baseline was lowest in the sub-cohort of persons with normal mGFR and without any of the investigated diagnoses for both eGFRCYS/eGFRCR-ratios used to define SPS, but the corresponding HR for all-cause mortality was the highest.
Influence of eGFRCYS, eGFRCR or mGFR on all-cause mortality as a function of the eGFRCYS/eGFRCR-ratio
In order to assess the influence of CAPACYS, LMRCR, or mGFR on the eGFRCYS/eGFRCR-ratio, these variables were excluded from the regression models, either one at a time or simultaneously. The exclusion of CAPACYS, LMRCR, or mGFR only marginally influenced the HR for all cause-mortality of low ratios of eGFRCYS/eGFRCR ().
Table 10. Cox regression for all-cause mortality in the Lund Cystatin C standardization cohort (n = 2781), when excluding CAPACYS, LMRCR and mGFR, both one at a time and simultaneously.
Discussion
Several studies have indicated that the mean of a cystatin C- and creatinine-based estimation of GFR is more reliable than estimations based upon only one of these parameters [Citation24,Citation28–33]. Estimation strategies based upon this knowledge are therefore used in several laboratories and cater for convenient diagnosis of SPS [Citation33,Citation34]. Elevated concentrations of creatinine or cystatin C have been shown to be related to increased mortality in several populations, but increased cystatin C concentrations have been associated with larger increases in mortality than elevations in creatinine [Citation35–38]. Corresponding observations have been made for decreases of eGFRCYS or eGFRCR [Citation36–38]. Although cystatin C might be superior to creatinine as a GFR marker [Citation23,Citation39,Citation40], it has not been possible to show that this is the reason why cystatin C is a better predictor of mortality than creatinine [Citation41]. The presence of a recently proposed kidney disorder, SPS, has been suggested to explain the superiority of cystatin C as a predictor of mortality [Citation11,Citation13–17]. The basic feature of this syndrome is that the renal clearance of 5–40 kDa molecules is decreased more than that of low molecular mass molecules, like water, 0.018 kDa, or creatinine, 0.113 kDa [Citation11,Citation13–18,Citation42]. Previous invasive studies of Beattie and Corcoran [Citation4,Citation5], Roberts et al. [Citation6], Oberbauer et al. [Citation7], Rippe et al. [Citation8] and the pore model for the glomerular filtration barrier [Citation12] offer a pathophysiological interpretation of the basic feature of SPS, namely a decrease in the diameter of a fraction of the pores of the glomerular membrane impairing the filtration of big molecules more than that of small molecules like water, the dominating constituent of the glomerular filtrate, and creatinine. This might also explain why a significant proportion of patients with SPS displays normal GFR, since the molecular masses of the substances used to measure GFR, e.g. 51Cr-EDTA, iohexol, iothalamate, are much lower (0.344, 0.821, 0.809 kDa) than that of cystatin C (13.3 kDa) used in diagnosing SPS. SPS is characterised by a high cystatin C/creatinine concentration ratio [Citation11,Citation13–18], but more than 20 additional 10–30 kDa proteins display corresponding high protein/creatinine ratios in SPS [Citation11,Citation15,Citation17]. These proteins generally have different, mostly unrelated, functions and their genes are widely distributed among the chromosomes and carry different gene promoters [Citation11,Citation15,Citation17]. It is therefore highly unlikely that their plasma levels are co-regulated by non-renal mechanisms [Citation11] as has been suggested to explain the GFR-independent prognostic value of cystatin C and beta trace protein [Citation43]. A reduction in the common way of excretion of these proteins by the kidneys [Citation1], offers a simple explanation for their parallel increase in concentration characteristic for SPS [Citation11,Citation15,Citation17]. As a matter of fact, in an ongoing investigation of the impact of measured GFR on the human plasma proteome, 2893 proteins are studied in 389 patients with known GFR [Citation44], and preliminary data suggest that many more than 20 proteins are characteristically increased in SPS in parallel with cystatin C.
Although several studies of SPS have shown that it is of clinical relevance, the specific clinical impact of SPS is somewhat unclear, since all studies of it so far have relied on estimated GFR and neither described the diagnoses at baseline, nor the death causes [Citation11,Citation13–18]. The present study is based on a large population in which measured GFR was available for all individuals at baseline. The diagnoses at recruitment were also registered and diagnoses of cancer and CVD dominated, but DM and CKD were also frequent in the cohort, which also comprised individuals considered healthy, e.g. potential kidney donors.
Ratios between eGFRCYS and eGFRCR below 0.60 or 0.70 have most frequently been used for diagnosing SPS [Citation11,Citation13–15,Citation18,Citation34]. In the present study SPS was defined by an eGFRCYS/eGFRCR-ratio <0.70 as it has been shown produce a high specificity and yet a good sensitivity of a prediction of the 3-year mortality in common types of populations [Citation14]. When this ratio was used to diagnose SPS, adjusted HR for all-cause mortality associated with SPS in the total cohort was higher than the adjusted HRs for all-cause mortality associated with any of the other diagnoses. The HRs associated with SPS were also markedly raised for all the four cause-specific mortality groups of cancer, CVD, DM, or CKD. For CVD mortality, the HR associated with SPS was even higher than the HR of CVD diagnoses. It has previously been shown in studies relying on estimated GFR that a decrease in the eGFRCYS/eGFRCR-ratio used to define SPS is associated with an increase in total mortality [Citation13–16] and the same observation is made in the present study adjusting for measured GFR. It might be observed that the most common non-renal influence on the eGFRCYS/eGFRCR-ratio, a low muscle mass, does not seem to occur in the present study as BMI does not differ between the groups.
It has previously been shown that SPS is associated with an increase in mortality even among patients with normal GFR (≥60 mL/min/1.73m2), but in these studies only estimated GFR was available [Citation13–16]. The HR for all-cause mortality associated with SPS was markedly increased also in the present study when a sub-cohort of 1300 individuals with normal mGFR was analysed, supporting the idea that the pathophysiological processes of SPS and reduced GFR without SPS differ. The observation that HR for all-cause mortality associated with SPS was high also in a sub-cohort of 1049 patients without diagnoses of CVD, cancer, DM or CKD also indicates that SPS represents a distinct pathophysiological process. The notion that SPS represents a new pathophysiological process is further supported by its high HR for all-cause mortality in the sub-cohort of 567 individuals with normal mGFR and without diagnoses of CVD, cancer, DM or CKD.
In most previous studies of SPS, eGFRCYS/eGFRCR-ratios <0.60 or <0.70 have been used to diagnose the syndrome [Citation11,Citation13–15]. In the present study, with known mGFR of the patients, the prevalence of SPS in the total cohort was 23%, when an eGFRCYS/eGFRCR-ratio <0.70 was used for diagnosing SPS. Corresponding prevalence in the sub-cohort without diagnoses of CVD, cancer, DM or CKD was 17%, in the sub-cohort with normal mGFR 17%, and in the sub-cohort with normal mGFR and no diagnoses of CVD, cancer, DM or CKD, 12%, respectively. The corresponding HRs for all-cause mortality associated with SPS were all raised and varied between 3.0 and 7.3. It was somewhat unexpected that the highest HR was observed for the sub-cohort with normal mGFR and without any diagnosis. This sub-cohort has a total all-cause mortality of 11.8%, which is much lower than that of the total cohort (37.7%) and represents the healthiest of the investigated cohorts. The high prevalence of SPS in this sub-cohort also indicates that SPS represents a unique pathophysiological process. The absence of any of the investigated disorders in the healthiest sub-cohort might augment the relative influence of an SPS diagnosis on the all-cause mortality, producing a high HR.
It has earlier been shown that a decrease in eGFRCYS is associated with an increase in mortality [Citation36–38]. This is also demonstrated in the present investigation, but the adjusted HR for all-cause mortality of SPS is considerably higher than the corresponding adjusted HR associated with a decrease in eGFRCYS. This agrees with the present study of the influence of CAPACYS, LMRCR, or mGFR on the adjusted HR for all-cause mortality of SPS, showing that exclusion of any of these variables only marginally influences HR.
To diagnose SPS, two GFR-estimating equations based upon cystatin C or creatinine are required. As previously shown and corroborated in this study, not only the equation pair CAPACYS and LMRCR, but also the equation pairs CKD-EPICYS and CKD-EPICR, or FASCYS and FASCR are able to define cohorts with increased mortality and/or morbidity due to SPS [Citation13,Citation14,Citation16–18]. We prefer equation pairs such as CAPACYS and LMRCR, because they work for both children and adults [Citation19,Citation30,Citation34,Citation45], which is important since emerging evidence indicates that SPS is also present in children [Citation46,Citation47].
Diagnosing kidney disorders is presently mainly based upon determination or estimation of GFR, specifying the volume of primary urine produced per unit of time. The dominating part of this is water so the conventional way of diagnosing kidney disorders does not consider the important role of the kidneys in maintaining a dynamic equilibrium of 5–40 kDa molecules in extracellular fluids. Proteins with signalling functions constitute a significant part of these molecules and in SPS the decrease in their clearance will induce a general increase in their concentration in extracellular fluids with a consequent disturbance of the signalling system in the body. Recent studies of the proteomes of patients with and without SPS at normal or reduced mGFR, support this proposal for the pathophysiological mechanism in SPS [Citation15]. This mechanism means that the composition, or quality, of the glomerular filtrate is changed in SPS and it has previously been suggested that a similar mechanism is involved in the alteration of the glomerular filtration process occurring in normal pregnancy and, more pronounced, in preeclampsia [Citation9–11]. Earlier invasive studies have also indicated changes in the composition of the glomerular filtrate in other kidney disorders [Citation4–8]. It is interesting that the suggested pathophysiology of SPS allows for treatment modalities aiming at reducing the high levels of disease-producing signal proteins by use of, for example, monoclonal antibodies [Citation15].
The present study, showing that SPS strongly increases mortality in cohorts with diagnoses of CVD, cancer, DM or CKD, as well as in cohorts with normal measured GFR and without these diagnoses, indicates that a significant part of all individuals with serious kidney disorders might be missed by the conventionally used definition and classification of CKD recommended by KDIGO in 2012 [Citation48]. This might suggest that optimal classification and stratification of CKD requires not only analysis of GFR (estimated or measured) and the urine albumin/creatinine ratio, but also determination of the eGFRCYS/eGFRCR-ratio to assess the presence of SPS.
The present study has some limitations. Although the data in the Swedish patient register are generally of high quality [Citation49] some misclassification of disease history is probably present at baseline in our study. The diagnosis of CKD from the registers is based on ordinary clinical work-up where clinicians use the KDIGO 2012 CKD classification for CKD stages 1 to 5. Information about albuminuria is not always included, which means that we most likely to some extent underestimate the prevalence of CKD at baseline. However, we find it unlikely that this misclassification is dependent on SPS status. It should also be noted that the study investigates SPS as a predictor of mortality, and that no firm conclusion about the causality of the observed associations can be drawn based on our results. In particular residual confounding from e.g. other aspects of health not present in the registers cannot be ruled out. We addressed this limitation to some extent by investigating the robustness of the results across sub-cohorts likely to be more similar with respect to unmeasured health determinants. Finally, it should be noted that the present study was based on a selected cohort of patients with diverse medical reasons for having their GFR measured. The findings are thus not necessarily generalizable to general or healthier populations.
Acknowledgments
The investigation was supported by grants from Alfred Österlund foundation, from Skåne University Hospital Funds and the Medical Faculty of Lund University.
Disclosure statement
The authors report no conflict of interest and are alone responsible for the content and writing of the article.
References
- Norden AGW, Lapsley M, Lee PJ, et al. Glomerular protein sieving and implications for renal failure in Fanconi syndrome. Kidney Int. 2001;60:1885–1892.
- Lund U, Rippe A, Venturoli D, et al. Glomerular filtration rate dependence of sieving of albumin and some neutral proteins in rat kidneys. Amer J Physiol Renal Physiol. 2003;284:F1226–34.
- Tenstad O, Roald AB, Grubb A, et al. Renal handling of radiolabelled human cystatin C in the rat. Scand J Clin Lab Invest. 1996;56:409–414.
- Corcoran AC, Beattie J, Page IH. A grass polysaccharide as an index of decreased glomerular permeability in renal diseases. J Clin Invest. 1950;29:806–807.
- Beattie J, Corcoran AC. Renal clearances of grass polysaccharide: observations on glomerular porosity and on the relation of this function to proteinuria in renal disease. J Clin Invest. 1952;31:445–450.
- Roberts M, Lindheimer MD, Davison JM. Altered glomerular permselectivity to neutral dextrans and heteroporous membrane modeling in human pregnancy. Am J Physiol. 1996;270:F338–43.
- Oberbauer R, Nenov V, Weidekamm C, et al. Reduction in mean glomerular pore size coincides with the development of large shunt pores in patients with diabetic nephropathy. Exp Nephrol. 2001;9:49–53.
- Rippe C, Asgeirsson D, Venturoli D, et al. Effects of glomerular filtration rate on Ficoll sieving coefficients (theta) in rats. Kidney Int. 2006;69:1326–1332.,
- Strevens H, Wide-Swensson D, Grubb A. Serum cystatin C is a better marker for preeclampsia than serum creatinine or serum urate. Scand J Clin Lab Invest. 2001;61:575–580.
- Strevens H, Wide-Swensson D, Torffvit O, et al. Serum cystatin C for assessment of glomerular filtration rate in pregnant and non-pregnant women. Indications of altered filtration process in pregnancy. Scand J Clin Lab Invest. 2002;62:141–147.
- Grubb A, Lindström V, Jonsson M, et al. Reduction in glomerular pore size is not restricted to pregnant women. Evidence for a new syndrome: “Shrunken pore syndrome. Scand J Clin Lab Invest. 2015;75:333–340.
- Rippe B, Haraldsson B. Transport of macromolecules across microvascular walls: the two-pore theory. Physiol Rev. 1994;74:163–219.
- Dardashti A, Nozohoor S, Grubb A, et al. Shrunken Pore Syndrome is associated with a sharp rise in mortality in patients undergoing elective coronary artery bypass grafting. Scand J Clin Lab Invest. 2016;76:74–81.
- Herou E, Dardashti A, Nozohoor S, et al. The mortality increase in cardiac surgery patients associated with shrunken pore syndrome correlates with the eGFRcystatin C/eGFRcreatinine-ratio. Scand J Clin Lab Invest. 2019;79:167–173.
- Sällman-Almén M, Björk J, Nyman U, et al. Shrunken pore syndrome is associated with increased levels of atherosclerosis-promoting proteins. Kidney Int Rep. 2019;4:67–79.
- Purde MT, Nock S, Risch L, et al. Ratio of cystatin C and creatinine-based estimates of the glomerular filtration rate predicts mortality in healthy seniors independent of kidney function. Scand J Clin Lab Invest. 2016;76:341–343.
- Purde MT, Nock S, Risch L, et al. The cystatin C/creatinine ratio, a marker of glomerular filtration quality: associated factors, reference intervals, and prediction of morbidity and mortality in healthy seniors. Transl Res. 2016;169:80–90.
- Christensson A, Grubb A, Molvin J, et al. The shrunken pore syndrome is associated with declined right ventricular systolic function in a heart failure population – the HARVEST study. Scand J Clin Lab Invest. 2016;76:568–574.
- Grubb A, Horio M, Hansson LO, et al. Generation of a new cystatin C-based estimating equation for glomerular filtration rate using seven assays standardized to the international calibrator. Clin Chem. 2014;60:974–986.
- Krutzén E, Bäck SE, Nilsson-Ehle I, et al. Plasma clearance of a new contrast agent, iohexol: a method for the assessment of glomerular filtration rate. J. Lab. Clin. Med. 1984;104:955–961.
- Nilsson-Ehle P, Grubb A. New markers for the determination of GFR: Iohexol clearance and cystatin C serum concentration. Kidney Int. 1994;46:S17–S9.
- Soveri I, Berg UB, Björk J, et al. Measuring GFR: a systematic review. Am J Kidney Dis. 2014;64:411–424.
- Kyhse-Andersen J, Schmidt C, Nordin G, et al. Serum cystatin C, determined by a rapid, automated particle-enhanced turbidimetric method, is a better marker than serum creatinine for glomerular filtration rate. Clin Chem. 1994;40:1921–1926.
- Björk J, Grubb A, Larsson A, et al. Accuracy of GFR estimating equations combining standardized cystatin C and creatinine assays: a cross-sectional study in Sweden. Clin Chem Lab Med. 2015;53:403–414.
- Nyman U, Grubb A, Larsson A, et al. The revised Lund-Malmö GFR estimating equation outperforms MDRD and CKD-EPI across GFR, age and BMI intervals in a large Swedish population. Clin Chem Lab Med. 2014;52:815–824.
- Inker LA, Schmid CH, Tighiouart H, et al. Estimating glomerular filtration rate from serum creatinine and cystatin C. N Engl J Med. 2012;367:20–29.
- Pottel H, Delanaye P, Schaeffner E, et al. Estimating glomerular filtration rate for the full age spectrum from serum creatinine and cystatin C. Nephrol Dial Transplant. 2017;32:497–507.
- Grubb A, Nyman U, Björk J. Improved estimation of glomerular filtration rate (GFR) by comparison of eGFRcystatin C and eGFRcreatinine. Scand J Clin Lab Invest. 2012;72:73–77.
- Björk J, Grubb A, Gudnason V, et al. Comparison of glomerular filtration rate estimating equations derived from creatinine and cystatin C: validation in the Age, Gene/Environment Susceptibility-Reykjavik elderly cohort. Nephrol Dial Transplant. 2018;33:1380–1388.
- Björk J, Nyman U, Berg U, et al. Validation of standardized creatinine and cystatin C GFR estimating equations in a large multicentre. Pediatr Nephrol. 2019;34:1087–1098.
- Leion F, Hegbrant J, den Bakker E, et al. Estimating glomerular filtration rate (GFR) in children. The average between a cystatin C- and a creatinine-based equation improves estimation of GFR in both children and adults and enables diagnosing Shrunken Pore Syndrome. Scand J Clin Lab Invest. 2017;77:338–344.
- Ma YC, Zuo L, Chen JH, et al. Chinese eGFR Investigation Collaboration. Improved GFR estimation by combined creatinine and cystatin C measurements. Kidney Int. 2007;72:1535–1542.
- Grubb A. Non-invasive estimation of glomerular filtration rate (GFR). The Lund model: Simultaneous use of cystatin C- and creatinine-based GFR-prediction equations, clinical data and an internal quality check. Scand J Clin Lab Invest. 2010;70:65–70.
- Tools for calculating robust cystatin C- and creatinine-based estimates of relative GFR and absolute GFR from relative GFR as well as for diagnosing shrunken pore syndrome. Accessed 2020 Apr. Available from: www.egfr.se/eGFRen.html
- Jernberg T, Lindahl B, James S, et al. Cystatin C: a novel predictor of outcome in suspected or confirmed non-ST-elevation acute coronary syndrome. Circulation. 2004;110:2342–2348.
- Shlipak MG, Sarnak MJ, Katz R, et al. Cystatin C and the risk of death and cardiovascular events among elderly persons. N Engl J Med. 2005;352:2049–2060.
- Peralta C, Shlipak MG, Judd S, et al. Detection of chronic kidney disease with creatinine, cystatin C, and urine albumin-to-creatinine ratio and association with progression to end-stage renal disease and mortality. JAMA. 2011;305:1545–1552.
- Shlipak MG, Matsushita K, Ärnlöv J, et al. CKD Prognosis Consortium. Cystatin C versus creatinine in determining risk based on kidney function. N Engl J Med. 2013;369:932–943.
- Newman DJ, Thakkar H, Edwards RG, et al. Serum cystatin C measured by automated immunoassay: A more sensitive marker of changes in GFR than serum creatinine. Kidney Int. 1995;47:312–318.
- Dharnidharka VR, Kwon C, Stevens G. Serum cystatin C is superior to serum creatinine as a marker of kidney function: a meta-analysis. Am J Kidney Dis. 2002;40:221–226.
- Sundin PO, Sjöström P, Jones I, et al. Measured GFR does not improve prediction of mortality by cystatin C and creatinine. Nephrol Dial Transplant. 2017;32:663–670.
- Grubb A. Cystatin C is indispensable for evaluation of kidney disease. eJIFCC. 2017;28:269–276.
- Tangri N, Inker LA, Tighiouart H, et al. Filtration markers may have prognostic value independent of glomerular filtration rate. JASN. 2012;23:351–359.
- Christensson A, Ash JA, DeLisle RK, et al. The impact of the glomerular filtration rate on the human plasma proteome. Prot Clin Appl. 2018; 12:e1700067.
- Nyman U, Björk J, Lindström V, et al. The Lund-Malmö creatinine-based glomerular filtration rate prediction equation for adults also performs well in children. Scand J Clin Lab Invest. 2008;68:568–576.
- den Bakker E, Hubeek I, Stoffel-Wagner B, et al. “Das „Shrunken pore syndrome “– auch im Kindersalter?”“Nieren- und Hochdruckkrankheiten. 2017;46:9–10. Available from: https://docplayer.org/40832815-Issn-postvertriebsstueck-entgelt-bezahlt-b-1185-e-dustri-verlag-dr-karl-feistle-bajuwarenring-4-d-deisenhofen-oberhaching.html
- den Bakker E, Gemke R, van Wijk J, et al. Evidence for shrunken pore syndrome in children. Scand J Clin Lab Invest. 2020;80:32–38.
- Definition and classification of CKD. KDIGO 2012 Clinical practice guideline for the evaluation and management of chronic kidney disease. Kidney Int Suppl. 2013;3:19–150.
- Ludvigsson JF, Andersson E, Ekbom A, et al. External review and validation of the Swedish national inpatient register. BMC Public Health. 2011;11:450.