
Abstract
D-dimer testing combined with a clinical assessment has become a standard pathway for ruling-out venous thromboembolism (VTE). Recently, novel Point-of-Care (POC) D-dimer assays have been introduced, enabling low-volume blood sampling for rapid exclusion of VTE in a one-step procedure. We assessed the analytical validity and user-friendliness of a set of these novel POC D-dimer assays, and compared the results with a standard laboratory assay. Plasma samples were run on our reference assay (STA-Liatest D-di PLUS®) and five POC assays: Nano-Checker 710®, AFIAS-1®; iChroma-II®; Standard F200® and Hipro AFS/1®). After evaluating imprecision, Pearson Product-Moment correlation coefficients were calculated, Passing Bablok regression was performed and Bland-Altman plots were generated. User-friendliness was evaluated using the System Usability Scale (SUS). A set of 238 plasma samples of patients clinically suspected of VTE in general practice was available for analysis. Only one POC D-dimer assay (Nano-Checker 710) demonstrated an insufficient degree of imprecision. Pearson correlation coefficients and mean biases ranged from 0.68 to 0.93 and −165 to −53 μg/L respectively, and concordance with our reference assay varied from 71.8% to 89.5% using a 500 μg/L cut-off point. While we found considerable variation in overall user-friendliness, most devices were judged easy to use. In view of our findings regarding analytical performance and user-friendliness, we consider most of the novel POC D-dimer assays can be used in settings outside of the laboratory such as general practice, combining the possibility of multi-testing with low-volume capillary blood sampling and processing times of less than 15 min.
Introduction
Venous thromboembolism (VTE), consisting of deep vein thrombosis (DVT) and pulmonary embolism (PE), is the third most common cause of cardiovascular death, after myocardial infarction and stroke. The annual incidence rate is about 1 per 1000 person-years in a general population [Citation1,Citation2]. Diagnoses are confirmed by imaging – i.e. compression ultrasonography (CUS) for DVT and computed tomographic pulmonary angiography (CTPA) for PE – with typical ratio of confirmed versus negative diagnoses of 1:6 in suspected patients. The challenge of correct VTE diagnosis is that symptoms mimic and overlap with many everyday illnesses. However, lowering the ‘threshold’ for performing CUS/CTPA will lead to unneeded referrals [Citation3–6]. This may result in an increase in health care costs and may also cause unnecessary burden and harm to patients, e.g. due to radiation exposure or contrast nephropathy associated with CTPA [Citation7]. This thus emphasizes the clinical dilemma of suspected VTE: many patients may have a suspicion but referring all of them for imaging is burdensome, costly and in the end not necessary for the majority, whereas missing a diagnosis still is common as well [Citation8,Citation9].
This clinical problem is often first assessed by general practitioners (GPs), but definitive diagnosis is difficult without access to rapid and around-the-clock laboratory tests such as through point-of-care (POC) testing. Guidelines for suspected DVT and PE assist GPs to combine clinical decision rules (CDRs) with, in selected cases, a D-dimer test [Citation10–13]. A low score – CDR ≤ 3 (DVT) or CDR ≤ 4 (PE) − combined with a negative D-dimer was shown to safely rule-out both DVT and PE [Citation14,Citation15].
Thus, rapid access to D-dimer point-of-care testing is decisive for GPs and their patients. Previously, qualitative D-dimer tests, suited for capillary blood samples, were incorporated in guidelines. Those tests turned out to be prone to significant pre-analytical and interpretation errors in less-controlled non-research environment, leading to avoidable false-negative results [Citation16]. Immediately after market withdrawal, comparable alternatives were not available for use in general practice. Recently, new quantitative POC D-dimer assays have been introduced which need only a small volume blood sample obtained by a finger-prick. We set out to evaluate the analytical performance of these five POC D-dimer tests with a laboratory D-dimer test as the reference standard. User-friendliness was assessed in a hands-on session, in which GP assistants filled out questionnaires after their first-time use of the test systems.
Materials and methods
Patient samples
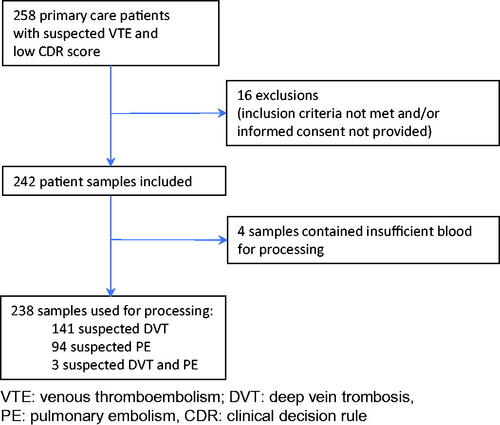
We collected blood samples from 242 patients suspected of having DVT (CDR ≤ 3) and/or PE (CDR ≤ 4) in general practice, after patients had provided informed consent. In this population we expected to find a wide variability of D-dimer values [Citation12]. The study protocol was approved by the Medical Ethics Committee of the University Medical Centre of Utrecht, the Netherlands. The inclusion period was 26 September 2016 – 10 January 2019. A more detailed design of the study is shown in .
Figure 1. Flowchart of study design.
Sample collection
Routine D-dimer tests were performed in a laboratory facility for general practice prior to the initiation of any anticoagulant treatment, and were obtained by venipuncture drawn from the anterior cubital vein.
Also, an additional blood sample (4.0 mL) was drawn from the same venipuncture into a lithium heparin tube (LH PSTTM II), and a citrate tube (9NC 0,105 M Buff. Na3 citrate), all from Becton Dickinson, New Jersey, USA. Within four hours, these additional tubes were centrifuged and aliquoted (centrifugation settings: 2,000 g; 10 min; 21 °C). Then, tubes were stored until analysis at −70 °C.
D-dimer measurements
After thawing, sample processing was performed in the Jeroen Bosch Hospital.
An immuno-turbidimetric assay (STA-Liatest®D-Di PLUS) on a routine laboratory analyzer (STA-R Max®, Stago Diagnostica, Asnières-sur-Seine, France) was used as the analytical reference method for D-dimer testing.
This assay uses a suspension of latex microparticles coated by covalent bonding with monoclonal antibodies to measure D-dimer levels; it has undergone extensive clinical validation and its cut-off value, recommended by the manufacturer, (=500 μg/L), has been confirmed in clinical studies [Citation17,Citation18]. According to the package leaflet, precision studies were performed in accordance with CLSI guideline EP5-A2 showing a coefficient of variation (CV) for within-day precision of 4.6% (mean = 690 μg/L) and 1.2% (mean = 2,300 μg/L), and a between-day precision (CV) of 3.3% (mean = 690 μg/L) and 0.0% (mean = 2,300 μg/L) with linearity between 290 μg/L and 18,210 μg/L [Citation19]. External Quality Controls from the ECAT foundation demonstrated a Z-score of <−1.5 in the latest 8 surveys of our laboratory assay, implying our measurements came close to the laboratory group average of the surverys. Latest quality controls showed a D-dimer result of 350 μg/L versus an (assay-specific) group value of 430 μg/L with a CV of 14.6% (level 1) and 980 μg/L versus an (assay-specific) group value of 1,040 μg/L with a CV of 6.6% (level 2).
The following five commercially available POC D-dimer test systems were then evaluated: Nano-Checker 710 D-dimer®, Nano-Ditech Corporation, Cranbury, USA, AFIAS-1®, Boditech Med Inc, Gangwon-do, Korea; iChroma-II®, Boditech Med Inc, Gangwon-do, Korea; Standard F200®, SD Biosensor, Seoul, Korea; Hipro AFS/1®, Hipro Biotechnology, Shijiazhuang, China.
Citrated plasma specimens were used on both routine and POC test systems except for Nano-Checker 710, for which lithium heparin plasma was used. POC D-dimer measurements have been carried out according to the manufacturer’s instructions by an experienced laboratory technician who was unaware of the routine D-dimer testing results and the clinical details of the patient including the CDR score.
Quantitative test results were reported as μg/L fibrinogen equivalent units (FEU), which were based on the amount of purified fibrinogen used for the preparation of a cross-linked fibrin clot, which was then degraded by plasmin and used as calibrator.
Analytical performance
Imprecision
As an elementary quality check (verification), between-run and between-day CVs for each D-dimer assay were calculated using two different D-dimer levels for each test system. Accordingly, CVs were compared with criteria from the respective manufacturer and with 50% of the CV based on within-subject biologic variation, i.e. 0.5 × 23.3% = 11.65% [Citation2,Citation20], which is a commonly accepted criterion for the desirable specification for imprecision [Citation21,Citation22].
Comparability
For a method comparison, it is recommended that at least 40 samples of broad concentration range should be available for testing with two methods (EP9 protocol) [Citation23,Citation24]. D-dimer values that ranged between 100 and 1,600 μg/L were considered as of greatest clinical relevance. Values below 100 μg/L and above 1,600 μg/L were excluded, as they would influence analyses disproportionately, while in clinical practice such values are considered negative and positive, respectively, without any discussion.
First, Pearson Product-Moment correlation coefficients r between routine and POC D-dimer assays were calculated. Next, Passing Bablok linear regression analysis was performed, which allows estimation of agreement between analytical methods, and is less susceptible to distribution of errors and to the presence of a low amount of data outliers than other similar regression methods [Citation23]. Regression equations (slope and intercept) were calculated between routine and POC D-dimer assays and presented with 95% confidence intervals (CI), in order to find out if mutual results differ from y = x, or y = ax+b, with a = 1 (slope), b = 0 (intercept).
Bland-Altman plots were generated to provide more detail about the nature of the differences between routine and POC D-dimer results [Citation25,Citation26]. Mean differences were calculated and presented with 95% CIs.
Finally, dichotomous (positive/negative) D-dimer test results were generated to demonstrate concordance and discordance percentages between routine and POC D-dimer assays. All results below 500 μg/L were considered negative, while higher results were considered positive. This value (500 μg/L) was chosen as a cut-off point because to date this value is widely used for clinical decision making in general practice and as such is incorporated in clinical guidelines.
User-friendliness
User-friendliness of the POC D-dimer test systems was assessed using a questionnaire based on the System Usability Scale (SUS; Supplementary Appendix 1). The SUS has been in use for decades and is a widespread, reliable, and well-tested tool for assessing the subjective perception of users on the usability of a system in quick and easy way, which is suited for system comparison and could function as a guide to system improvement [Citation27,Citation28]. Using a set of 10 questions a score is calculated ranging from 0 to 100 and can be interpreted as follows: ≤51.8: system should be fixed; 51.9–67.9: improvement is recommended; 68–73.9: usable but could improve; 74–80.2: usable; ≥80.3: excellent; alternatively, a grade rating can be used [Citation28]. A group of eleven GP assistants, unfamiliar with the devices but familiar with CRP POC testing, were given a short instruction by a laboratory technician and all assistants were given a written instruction chart. They then directly carried out one D-dimer test on all five POC D-dimer test systems in a random order and completed a SUS questionnaire accordingly, along with a few additional questions about sample management and readability of displays and results. Next, for each device, one SUS score was calculated based on median scores of the 10 questions of the SUS questionnaire, and an interquartile range (IQR) was calculated.
Additionally, detailed characteristics of POC D-dimer devices, collected from manufacturers’ information sheets and own experiments, were evaluated.
Statistical analyses were performed using the Statistical Package for the Social Sciences Software® (PASW Version 22, SPSS, IBM, Somers, NY, USA). Bland-Altman plots were generated using Analyse-it® (Version 5.11, Kirkstall Rd, Leeds, UK).
Results
After exclusion of samples that contained insufficient blood for processing, 238 samples were included in the data analysis which ensured sufficient samples were in the desired range of measurement and exceeded the usual criterion of at least 40 samples to be analyzed.
Analytical performance
Imprecision
Between-run and between-day variation for the POC assays is presented in for two different D-dimer levels for each test system. Four out of five assays demonstrated acceptable imprecision with CVs within the criteria set by the respective manufacturer and within 11.65%. Only the Nano-Checker 710 demonstrated substantially higher CVs in the low range sample, both regarding within-day variation CV (26.1%) and between-day variation CV (15.3%).
Table 1. Imprecision data of the Point-of-Care (POC) D-dimer assays used in this study.
Comparability
Pearson Product-Moment correlation coefficients r and regression line equations according to Passing and Bablok are presented in (first and second columns). R coefficients of POC assays ranged from r = 0.68 (Hipro AFS/1) to r = 0.93 (AFIAS-1). All Passing and Bablok fits demonstrated a significant deviation from y=ax+b (a = 1, b = 0), implicating that slope and/or intercept fall outside the 95% CI of 1 and 0, respectively. shows agreement of POC assays with the laboratory test by Bland-Altman plots. For AFIAS-1 and iChroma-II assays, higher D-dimer values demonstrate a stronger negative bias (difference). For the remaining POC assays, around 500 μg/L, biases appeared relatively constant and small considered in the context of the entire D-dimer range. Mean biases and accompanying 95% CIs are shown in (third column). The Standard F200 assay demonstrated lowest mean bias of all POC test systems (−53 μg/L), with its 95% CI being the second narrowest (−278 – +384 μg/L), while the Nano-Checker 710 assay demonstrated highest bias (−165 μg/L) and 95% CI (−675 – +345 μg/L).
Figure 2. Bland-Altman plots comparing Point-of-Care (POC) D-dimer results of (A) Nano-Checker 710, (B) AFIAS-1, (C) iChroma-II, (D) Standard F200, (E) Hipro AFS/1 assays with D-dimer results of our laboratory (lab) assay (STA-Liatest PLUS). The dotted lines indicate mean differences between POC assays and lab assays, while the dashed lines indicate their 95% confidence intervals. Corresponding values are presented in (third column).
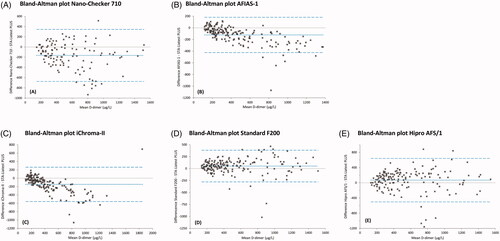
Table 2. Results of method comparison of five Point-of-Care D-dimer assays with the STA-Liatest PLUS.
presents concordance and discordance percentages of our laboratory assay versus POC assays. Concordance varied from 71.8% (Nano-Checker 710) to 89.5% (Standard F200). In three out of five POC assays (Nano-Checker 710, AFIAS-1, iChroma-II), discordance was mainly due to lower POC results than the STA-Liatest PLUS and in two out of five POC assays (Standard F200, Hipro AFS/1), discordance was mainly due to higher POC results.
Table 3. Concordance and discordance of all Point-of-Care assays versus the STA-Liatest PLUS assay. Data are based on dichotomous results (positive/negative) with a 500 μg/L cut-off value.
User-friendliness
The GP assistants, who were all first-time users, generally did not have problems with generating test results. All questionnaires were filled out completely. Median SUS scores of the five systems varied from 37.5 (iChroma-II) to 75.0 (Hipro AFS/1) and are presented in with accompanying IQRs. Median scores of the third SUS question ‘I thought the system was easy to use’ were: 4 → ‘I agree’ (AFIAS-1, Nano-Checker 710 and Hipro AFS/1), 3 → ‘neutral’ (Standard F200) and 2 → ‘I disagree’ (iChroma-II). As for the POC D-dimer test systems in general, no positive or negative outliers were found on median scores of the individual questions. Participants referred to the number of (extensive) actions to be performed and components to handle, the risk of spilling blood and the ease in which screen instructions can be followed, as noteworthy aspects of user-friendliness in these test systems. A more detailed report is presented in appendix 2.
Table 4. Device characteristics and user-friendliness of Point-of-Care D-dimer devices used in this study.
We hypothesized that a learning effect could occur due to the use of multiple devices, which could have been resulted in higher SUS scores. Therefore, we compared SUS scores of test systems based on participants that used these devices as their first test system, with SUS scores from (based on all participants). No structural difference in SUS scores was found, implying that a bias based on a learning effect could not be proven.
Device characteristics differ considerably between the five POC D-dimer assays (). All test systems are able to handle both plasma and whole blood samples, although – for the Hipro AFS/1 test system – the ability to handle whole blood D-dimer tests was under development at the time of writing. While processing of a D-dimer test takes three minutes on the Hipro AFS/1 test system, processing time for the other devices varied between seven and 15 min. Also, plasma volumes vary considerably: most devices need 5–15 μL plasma, while the AFIAS-1 test system requires 100 μLFootnote1. All devices are able to handle biomarkers other than D-dimer; details are provided in .
Discussion
We assessed the analytical performance and user-friendliness of five novel POC D-dimer test systems in a direct assay comparison with the STA-Liatest Plus reference. Imprecision of all POC D-dimer assays was sufficiently low, with the exception of the Nano-Checker 710 test system. Mean bias between POC assays and the laboratory assay was small (ranging from −165 to −53 μg/L) and, importantly, bias was smallest around the most clinically relevant area (500 μg/L). Choosing 500 μg/L as a cut-off point, concordance between POC assays and the laboratory assay varied from 71.8% to 89.5%. In view of these results, we consider precise and reliable D-dimer measurements to be possible in daily practice using these novel POC assays.
Using the SUS questionnaire, we found considerable variation in overall user-friendliness, in addition to objective test system characteristics such as size, processing time, sample volume, and the number of testable biomarkers. Most devices were judged easy to use. Limited user-friendliness seemed largely related to the number of actions to be performed, the number of components to handle, and the risk of spilling blood. We consider user-friendliness of one device (iChroma-II) to be insufficient (SUS score = 37.5) and strongly advice making device modifications before (re)introducing in clinical practice.
To our knowledge, ours is the first study to evaluate these novel POC D-dimer test systems on analytical performance and user-friendliness. Unlike recent evaluations of POC D-dimer test systems, the devices in this study are portable, enable drawing a whole blood sample by finger-prick and, for this purpose, only need limited amounts of blood (most of them ≤15 μL) compared to existing quantitative assays requiring 75–150 μL [Citation9,Citation21]. We noted a reduction in processing time: processing time varied between 3 and 15 min in contrast to between 10 and >30 min for existing devices [Citation9,Citation21,Citation29].
The Passing and Bablok regression lines demonstrate the presence of a substantial, assay-dependent, linear deviation of all POC assays compared with the laboratory assay. Significant improvement of agreement is possible by adjusting such deviations through modification of pre-defined manufacturer’s (software) settings and seems most beneficial for AFIAS-1 and iChroma-II assays (). Other possible reasons for the presence of these linear deviations are calibration and/or hardware (i.e. dilution process) issues.
The impact of these linear deviations on our results can be illustrated by the observation that the assay that revealed highest correlation coefficient (r) – the AFIAS-1 test system – did not demonstrate best performance results in terms of mean bias and concordance. Actually, this proved to be the Standard F200 test system. Since both slope and intercept of the AFIAS-1 demonstrated a significant deviation from y = x, performance results of this assay will considerably improve after adjustment of slope and intercept, as shown in .
Performance is largely in accordance with studies on similar venous whole blood POC D-dimer devices carried out in recent years; most of these assays also demonstrated good performance, with Cohen’s Kappa coefficients ranging from κ = 0.72–0.94 [Citation21] and Pearson correlation coefficients ranging from r = 0.73–0.99 [Citation29–33]. It has been suggested that in some studies, the documented performance might, at least partially, have been biased by the inclusion of very high values – largely exceeding twice the diagnostic cut-off level – favourably affecting correlation but of little relevance for clinical decision making [Citation29]. As previously indicated, such high values have not been included in this study.
The strength of our study is that test characteristics, different methods of measuring analytical performance, and user-friendliness were combined, thus providing an overview of all relevant aspects of these novel portable POC D-dimer test systems. By including samples of patients actually suspected of having VTE from the general population in general practice, larger sample numbers were available covering the entire clinical relevant measuring range to be used to assess analytical validity in the target population. Also, analyses of the same samples were performed on all POC assays, ensuring that in each POC versus lab assay comparison, the same collection of samples was used. We assessed user-friendliness using GP assistants instead of laboratory technicians. Also, in contrast to similar studies, we used a widely-used multi-purpose scale system for analysis, facilitating straightforward result interpretation [Citation34–36]. Nevertheless, for full appreciation, the following limitations need to be discussed.
Firstly, although a state-of-the-art D-dimer laboratory assay has been used as reference assay, results may differ if another laboratory assay had been chosen as a reference. However, because of the lack of standardization between assays, no actual reference standard of D-dimer assays is available to date; in this respect, it is unlikely that another laboratory assay would provide more reliable results [Citation37]. In fact, it may even be true that one or more POC D-dimer assays would provide a better diagnostic performance than our laboratory assay. For these reasons, a first impression of diagnostic accuracy based on results of the current study is difficult to provide.
Secondly, in this study, all sample processing was performed by an experienced laboratory technician. We cannot foresee if, when used within their own environment, non-laboratory users experience problems that may influence test results [Citation38]. Therefore, verifying results in in a general practice, an emergency room or outpatient department setting is recommended to see how they function outside the lab. Using whole blood samples, preferably drawn from a finger-prick, will further approach daily general practice. Besides, in addition to a laboratory assay, clinical outcome could be used as a reference standard to provide well-grounded diagnostic accuracy measures such as sensitivity, specificity and predictive values – a final diagnosis is generally based on (CUS/CTPA) imaging after a positive D-dimer result [Citation39]. We are currently planning a study to combine these aspects. Nonetheless, in our opinion, the method and setting we used in this study were sufficient for our goal to assess analytical performance and general agreement between tests.
Thirdly, for assessing user-friendliness participants used blood samples that were available from venipunctures. Thus, aspects of sample collection by drawing blood from a finger-prick were not taken into account. The number of participants was limited, but there was consensus within the GP assistants’ comments on the devices.
Although overall SUS scores are relatively low, they should be interpreted in the right context. The POC D-dimer test systems were only recently released and will most likely be further developed. Also, while a bias based on a learning effect during the session could not be proven, we can satisfactorily assume that users operating with such devices on a frequent basis and after a thorough, personalized, training program would provide higher SUS scores. Hence, the SUS scores must not be interpreted as static numbers, but can serve as a benchmark for further development instead – the feedback from the GP assistants can be used as guidance.
In short, our study shows that the analytical performance of the studied, quantitative POC D-dimer tests is comparable with a laboratory D-dimer test (STA-Liatest PLUS). This new generation of POC D-dimer assays is well suited for use in general practice and offers the potential for actually being introduced in this setting for the exclusion of VTE. Currently, most D-dimer assays are being performed in central or hospital-based laboratories, so the results of this study can contribute to the accessibility of rapid D-dimer testing for GPs [Citation21].
Conclusion
Our results show that most POC D-dimer test systems perform adequately when compared with the STA-Liatest PLUS assay, especially when we take due account of results in the clinically relevant area. Only the Nano-Checker 710 test system did not fulfill the desired analytical specifications. Based upon these results and user-friendliness findings, these novel POC D-dimer assays have the potential to function as an alternative for a laboratory assay, although further studies are needed on diagnostic accuracy − to be verified on capillary samples − in the specific clinical setting where the POC devices are to be used. The Standard F200 assay demonstrated the best overall analytical performance and the Hipro AFS/1 assay proved to be the most user-friendly test system. All portable test systems evaluated possess the desired functionalities for out-of-hospital settings, combining multi-test analysis and low-volume capillary blood sampling with strongly reduced processing times.
Ethical approval
The medical-ethics committee of University Medical Centre of Utrecht approved this study (METC protocol number: 16-356/M; NL56475.041.16)
Supplemental Material
Download PDF (215.5 KB)Acknowledgements
We would like to thank Huibert Kuijsters for his assistance on the realization of the user-friendliness session, the GP assistants for their participation in the session, and Mirrian Hilbink (epidemiologist) for her support on statistics.
We gratefully acknowledge the support provided by Nano-Ditech Corporation.
Disclosure statement
The authors declared no potential conflict of interest with respect to the research, authorship and/or publication of this article.
Correction Statement
This article has been republished with minor changes. These changes do not impact the academic content of the article.
Additional information
Funding
Notes
1 The latest version requires 30 μL, however this version was not yet available at the time of sample processing.
References
- Huerta C, Johansson S, Wallander MA, et al. Risk factors and short-term mortality of venous thromboembolism diagnosed in the primary care setting in the United Kingdom. Arch Intern Med. 2007;167(9):935–943.
- Naess IA, Christiansen SC, Romundstad P, et al. Incidence and mortality of venous thrombosis: a population-based study. J Thromb Haemost. 2007;5(4):692–699.
- Kearon C. Natural history of venous thromboembolism. Circulation. 2003;107(90231):22I–230.
- Meyer G, Roy PM, Gilberg S, et al. Pulmonary embolism. BMJ. 2010;340(apr13 2):c1421–c1421.
- Oudega R, Moons KG, Hoes AW. Limited value of patient history and physical examination in diagnosing deep vein thrombosis in primary care. Fam Pract. 2005;22(1):86–91.
- Schiff GD, Hasan O, Kim S, et al. Diagnostic error in medicine: analysis of 583 physician-reported errors. Arch Intern Med. 2009;169(20):1881–1887.
- Bates SM, Jaeschke R, Stevens SM, et al. Diagnosis of DVT: antithrombotic therapy and prevention of thrombosis, 9th ed: American College of Chest Physicians Evidence-Based Clinical Practice Guidelines. Chest. 2012;141(2):e351S–e2299.
- Buller HR, Ten Cate-Hoek AJ, Hoes AW, et al. Safely ruling out deep venous thrombosis in primary care. Ann Intern Med. 2009;150(4):229–235.
- Geersing GJ, Erkens PM, Lucassen WA, et al. Safe exclusion of pulmonary embolism using the Wells rule and qualitative D-dimer testing in primary care: prospective cohort study. BMJ. 2012;345:e6564.
- Deep vein thrombosis (DVT): Diagnosis. Thrombosis Canada; 2017. http://thrombosiscanada.ca/wp-content/uploads/2017/05/Deep-Vein-Thrombosis-Diagnosis-2017May16-Final.pdf
- Lim W, Le Gal G, Bates SM, et al. American Society of Hematology 2018 guidelines for management of venous thromboembolism: diagnosis of venous thromboembolism. Blood Adv. 2018;2(22):3226–3256.
- NHG-werkgroep Diepe veneuze trombose en longembolie. NHG-Standaard Diepe veneuze trombose en longembolie (tweede partiële herziening). Huisarts Wet 2017;60(9):460.
- Tran HA, Gibbs H, Merriman E, et al. New guidelines from the Thrombosis and Haemostasis Society of Australia and New Zealand for the diagnosis and management of venous thromboembolism. Med J Aust. 2019;210(5):227–235.
- Oudega R, Moons KG, Hoes AW. Ruling out deep venous thrombosis in primary care. A simple diagnostic algorithm including D-dimer testing. Thromb Haemost. 2005;94(1):200–205.
- van Belle A, Buller HR, Huisman MV, et al. Effectiveness of managing suspected pulmonary embolism using an algorithm combining clinical probability, D-dimer testing, and computed tomography. JAMA. 2006;295(2):172–179.
- Saltro Diagnostic Centre. Communiqué of the Dutch Society of Clinical Biochemistry. Utrecht, the Netherlands; 2014.
- Aguilar C, Sartori M, D'Angelo A, et al. Validation of the STA-Liatest DDi assay for exclusion of proximal deep vein thrombosis according to the latest Clinical and Laboratory Standards Institute/Food and Drug Administration guideline: results of a multicenter management study. Blood Coagul Fibrinolysis. 2018;29(6):562–566.
- Kline JA, Hogg MM, Courtney DM, et al. D-dimer threshold increase with pretest probability unlikely for pulmonary embolism to decrease unnecessary computerized tomographic pulmonary angiography. J Thromb Haemost. 2012;10(4):572–581.
- CLSI. Document EP05-A2: Evaluation of precision performance of quantitative measurement methods; approved guideline. 2nd ed.; 2004.
- Michinela J, Ricós C, Perich C, et al. Biological variation database and quality specifications for imprecision, bias and total error (desirable and minimum). The 2014 update. Westgard QC; 2014. https://www.westgard.com/biodatabase1.htm
- Antovic JP, Hoog Hammarstrom K, Forslund G, et al. Comparison of five point-of-care D-dimer assays with the standard laboratory method. Int J Lab Hematol. 2012;34(5):495–501.
- Kallner A, McQueen M, Heuck C. The Stockholm Consensus Conference on quality specifications in laboratory medicine, 25–26 April 1999. Scand J Clin Lab Invest. 1999;59(7):475–476.
- Bilic-Zulle L. Comparison of methods: passing and Bablok regression. Biochem Med. 2011;21:49–52.
- Wayne P. Clinical and Laboratory Standards Institute (CLSI). Method comparison and bias estimation using patient samples; approved guideline. CLSI; 1992 (CLSI Document EP9-A).
- Bland JM, Altman DG. Comparing methods of measurement: why plotting difference against standard method is misleading. Lancet. 1995;346(8982):1085–1087.
- Dewitte K, Fierens C, Stockl D, et al. Application of the Bland-Altman plot for interpretation of method-comparison studies: a critical investigation of its practice. Clin Chem. 2002;48(5):799–801.
- Brooke J. SUS: a ‘quick and dirty’ usability scale. In: Usability evaluation in industry. London: Taylor and Francis; 1996, p. 189–194.
- Klug B. An overview of the system usability scale in library website and system usability testing. Weave J Libr User Experience. 2017;1(6):1.
- Oude Elferink RF, Loot AE, Van De Klashorst CG, et al. Clinical evaluation of eight different D-dimer tests for the exclusion of deep venous thrombosis in primary care patients. Scand J Clin Lab Invest. 2015;75(3):230–238.
- Fukuda T, Kasai H, Kusano T, et al. A rapid and quantitative D-Dimer assay in whole blood and plasma on the point-of-care PATHFAST analyzer. Thromb Res. 2007;120(5):695–701.
- Sen B, Kesteven P, Avery P. Comparison of D-dimer point of care test (POCT) against current laboratory test in patients with suspected venous thromboembolism (VTE) presenting to the emergency department (ED). J Clin Pathol. 2014;67(5):437–440.
- Spanuth E, Ivandic B, Thomae R, et al. Comparison of the PATHFAST D-dimer assay with two POC D-dimer assays. Crit Care. 2015;19(Suppl 1):P321.
- von Lode P, Rainaho J, Laiho MK, et al. Sensitive and quantitative, 10-min immunofluorometric assay for D-Dimer in whole blood. Thromb Res. 2006;118(5):573–585.
- Geersing GJ, Toll DB, Janssen KJ, et al. Diagnostic accuracy and user-friendliness of 5 point-of-care D-dimer tests for the exclusion of deep vein thrombosis. Clin Chem. 2010;56(11):1758–1766.
- Minnaard MC, van de Pol AC, Broekhuizen BD, et al. Analytical performance, agreement and user-friendliness of five C-reactive protein point-of-care tests. Scand J Clin Lab Invest. 2013;73(8):627–634.
- Schot MJ, van Delft S, Kooijman-Buiting AM, et al. Analytical performance, agreement and user-friendliness of six point-of-care testing urine analysers for urinary tract infection in general practice. BMJ Open. 2015;5(5):e006857–006857.
- Adam SS, Key NS, Greenberg CS. D-dimer antigen: current concepts and future prospects. Blood. 2009;113(13):2878–2887.
- Skeie S, Thue G, Nerhus K, et al. Instruments for self-monitoring of blood glucose: comparisons of testing quality achieved by patients and a technician. Clin Chem. 2002;48(7):994–1003.
- Ekelund S, Heilmann E. Comments on point of care D-dimer testing in the emergency department: a bioequivalence study. Ann Lab Med. 2014;34(1):64–65.