
 ?Mathematical formulae have been encoded as MathML and are displayed in this HTML version using MathJax in order to improve their display. Uncheck the box to turn MathJax off. This feature requires Javascript. Click on a formula to zoom.
Abstract
The aim of this study was to establish creatinine growth curves separately for males and females that can be used to adjust childhood levels of serum creatinine to corresponding adult levels. Linear regression with fractional polynomials of age as independent variable was used to construct creatinine growth curves for a reference cohort (n = 83,157 samples from Belgium and Sweden, age 2–40 years). Adjusted creatinine obtained from the growth curves was used to improve accuracy of estimated glomerular filtration rate (eGFR) based on the Lund–Malmö revised (LMR) equation in children. The LMR equation based on creatinine values adjusted to age 18 years was validated against measured GFR (mGFR) in a separate cohort of 4005 children from four different European countries. Validation metrics included median bias, precision, and accuracy expressed as percentage of estimates within ±30% (P30) of mGFR. Remarkable improvements in bias and accuracy were observed; P30 increased from 56% to 74% after creatinine adjustments in children with mGFR <75 mL/min/1.73 m2 (n = 932), while P30 was relatively unchanged (89–90%) at mGFR ≥75 mL/min/1.73 m2 (n = 3073). The suggested approach with adjusted creatinine makes LMR applicable in children irrespective of their renal function.
Introduction
The Lund–Malmö revised (LMR) equation was developed in 2011 with the explicit goal to improve accuracy of estimated glomerular filtration rate (eGFR) in adults with chronic kidney disease (CKD) [Citation1]. Several validation studies have reported superior accuracy of LMR compared with the Chronic Kidney Disease Epidemiology Collaboration (CKD-EPI) equation in adults with CKD [Citation2–10]. LMR can be used with similar accuracy as dedicated paediatric equations in children with normal renal function, but yields marked overestimations in children with CKD [Citation11]. Thus, LMR is presently not an equation for the full spectrum of age and renal function.
More recently, a novel way of developing GFR equations based on age- and sex-adjusted serum creatinine was presented [Citation12]. This resulted in the Full Age Spectrum (FAS) equation that is applicable for all ages after normalizing creatinine for age (among children and adolescents) and sex (among adolescents and adults) [Citation13]. The FAS equation remediates the discontinuity problem and the implausible changes in eGFR when switching from paediatric to adult equations as children grow into adulthood [Citation14], but overestimates GFR in children with severe CKD [Citation11].
In the present study, we build on previous work with models for how creatinine levels increase during childhood and adolescence [Citation12,Citation13]. Using statistical regression, the overall aim of this study was to establish creatinine growth curves separately for males and females that can be used to adjust childhood levels of creatinine to corresponding adult levels. We demonstrate how adjusted creatinine obtained from this method can be used to improve GFR estimation accuracy based on the LMR equation in children.
Material and methods
The present study of GFR equations for children was reviewed and approved by the Regional Ethical Board in Lund, Sweden. All procedures involving subjects and data agreed with the ethical principles for medical research involving human subjects established in the World Medical Association Declaration of Helsinki of 1975, as revised in 2000.
Reference cohort for establishment of creatinine growth curves
Anonymous reference data on age, sex and plasma/serum creatinine levels for patients aged 2–40 years old were obtained from non-nephrology units at three different hospitals: (i) Kortrijk, Belgium in 2005–2007 (n = 9634), (ii) Liege, Belgium in 2019 (n = 9123) and (iii) Uppsala, Sweden, in 2015–2019 (n = 64,410). All creatinine samples were analyzed in clinical routine at the hospitals with standardized assays traceable to isotope dilution mass spectrometry (IDMS) and standard reference material (SRM) 967 (National Institute of Standards and Technology, NIST, Gaithersburg, MD, USA). Creatinine was analyzed in Kortrijk on a Roche Integra 800 (Roche Diagnostics, Mannheim, Germany), in Liege on an Abbott Alinity (Abbott Laboratories, Abbott Park, IL) and in Uppsala on an Architect 8000 (Abbott Laboratories). Enzymatic creatinine reagents were used at all three sites.
Creatinine growth curves
Previous work by Hoste et al. [Citation12] has provided mathematical expressions for how median creatinine levels grow among females and males until age 20 years. In the present study, we extended this work by allowing the growth of creatinine in the reference cohort to continue beyond 20 years, as muscle mass especially among males can be expected to continue to grow in young adulthood. We used linear regression with fractional polynomials of age as independent variable in order to construct creatinine growth curves separately for males and females:
where ln is the natural logarithm (included in order to open up for smoother associations than exponential between age and creatinine on the original scale), Cr is the observed creatinine level for each individual and β0–β4 are regression coefficients estimated from data.
Adjusted GFR estimation
The creatinine growth curves can be used to recalculate childhood levels of creatinine to an equivalent level for an adult at a particular age, referred to as adjusted creatinine In the present study, we used age 18 years as threshold. This means that adjusted creatinine at age 18 years is predicted for children (individuals with age <18 years). Creatinine values are left unchanged among adults (individuals with age ≥18 years):
Note that the location parameter (intercept β0) for the growth curves is cancelled out and therefore does not affect adjusted creatinine (). This means that the adjustment is insensitive to any bias in the location of the growth curves, e.g. stemming from selection of patients into the reference cohort.
GFR estimation using the LMR equation among children is based on adjusted creatinine () and as though the individual had age 18 years irrespective of his or her actual age.
Lund–Malmö revised equation [Citation1], based on creatinine adjusted to age 18 years :
where max(Age;18) represents the maximum of Age (actual age of the patient) and 18 years (the applied age threshold). Actual creatinine and actual age are used among adults.
Validation cohort
The European Kidney Function Consortium (EKFC), endorsed by the ERA-EDTA, has taken the initiative to collect observational data on patients referred for GFR measurement including plasma/serum creatinine, age, sex, height and weight. Common causes for referral were congenital malformations, hereditary diseases, acquired diseases (glomerulonephritis, nephrotic syndrome, reflux nephropathy, etc.), markers of kidney injury (e.g. proteinuria), follow-up after organ transplantation and to dose drugs eliminated by the kidneys.
The children included in the EKFC database originate from six different cohorts used in cross-sectional and longitudinal studies; from the Netherlands (Amsterdam; [Citation15–19]), Belgium (Leuven; [Citation7]), France (Lyon; [Citation7,Citation13]), and Sweden (Lund; [Citation18], Stockholm [Citation11] and Örebro [Citation11]). As validation cohort for the present study we selected the first available measurement of GFR for all children 2.0–17.9 years old in the EKFC database with a simultaneous creatinine measurement (n = 4005 unique patients; ). Patient data were pooled in an anonymous database for the present study at Lund University, Sweden.
Table 1. Patient characteristics.
Laboratory methods for the validation cohort
Details of laboratory methods are summarized in Supplementary Table S1. Clearance methods for measured GFR (mGFR) included plasma and renal clearance of inulin, and plasma clearance of 51Cr-EDTA and iohexol, all considered acceptable as reference test [Citation20]. Samples of creatinine were obtained on the day of GFR measurement in all cohorts but Stockholm, where samples within 48 h of measured GFR were accepted. All centres used standardized creatinine assays traceable to IDMS and NIST, SRM 967.
Statistical evaluation
In the validation cohort, the performance of LMR18 (i.e. the adjusted LMR equation to 18 years described above) was compared with three other equations:
the standard LMR equation without creatinine adjustment [Citation1]
the Chronic Kidney Disease in Children (CKiD; bedside Schwartz) equation [Citation21]
the Schwartz-Lyon equation [Citation22]
Males <13 years and females <18 years:
Males ≥13 years:
Creatinine is expressed in μmol/L and body height in centimetre in the equation expressions above. The validation focussed on bias, precision and accuracy [Citation23]. Bias was assessed as the median of eGFR – mGFR and precision as the interquartile range (IQR) of the differences eGFR – mGFR. Accuracy was assessed from the absolute error |eGFR – mGFR|/mGFR and summarized as the median absolute percentage difference (absolute accuracy) and as the percentage of estimates within ±10% and ±30% of mGFR (P10 and P30). P30 accuracy of at least 75% has been considered sufficient “for good clinical decision-making” by the National Kidney Foundation but the benchmark is to reach P30 > 90% [Citation24]. Differences in P30 accuracy were evaluated statistically using 95% confidence intervals (CIs) for paired proportions.
Main results are presented stratified for mGFR below and above 75 mL/min/1.73 m2, as abnormal GFR in children has been regarded to start below this threshold [Citation25], and by sex.
Results
Creatinine growth curves
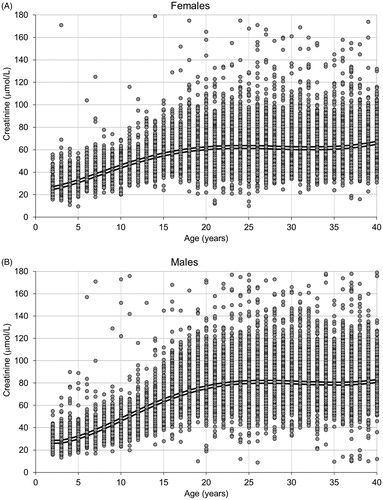
The association between age and median plasma/serum creatinine levels was for both females and males similar across the three laboratories (hospitals; Supplementary Figure S1). The pooled reference cohort included 83,157 samples in total (46,601 females and 36,556 males; median age 27 years). The serum creatinine median value (2.5, 97.5 percentile) for women (n = 1278) and men (n = 992) aged 18 years were 61 (42, 86) umol/L and 76 (54, 107) umol/L, respectively.
Coefficients for the sex-specific creatinine growth curves were estimated based on the reference cohort, as illustrated in . The following growth curves were obtained:
Figure 1. Plasma/serum creatinine values in 83,157 patients from the reference cohort as a function of age in (A) females (n = 57 > 180 μmol/L) and (B) males (n = 130 > 180 μmol/L). The double line represents the creatinine growth curve based on linear regression with fractional polynomials of age as independent variable (see text).
Males:
Females:
The estimated geometric means at each age obtained from the growth curves were for both boys and girls consistently within the laboratory specific reference intervals (Supplementary Table S2). The calculation of adjusted creatinine at age 18 years based on actual creatinine (Cr) and actual age of the child (Age) was done by constructing individual creatinine growth projections in the following way:
Males:
Females:
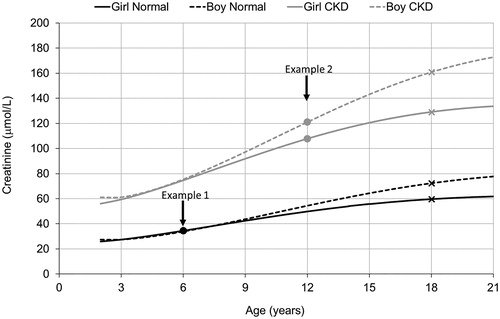
The calculation is outlined in for two hypothetical pairs of children, one pair with normal and one pair with increased creatinine levels.
Figure 2. Individual creatinine growth projections for two hypothetical example pairs of children: (1) age 6 years and normal creatinine levels (boy 34 and girl 35 µmol/L), (2) age 12 years with elevated creatinine levels (boy 121 and girl 108 µmol/L) indicating chronic kidney disease (CKD). Adjusted creatinine for the Lund–Malmö revised equation (LMR18) is obtained by following the corresponding growth curve until age 18 years (marked with crosses).
Validation results
Overall validation results stratified by mGFR (<75 versus ≥75 mL/min/1.73 m2) are presented in . Noticeable improvements at mGFR below 75 mL/min/1.73 m2 were noted for LMR18 (using adjusted age and creatinine) compared with LMR (without adjustment), with decreased bias and P30 accuracy increasing from 56% to 74%. LMR18 thereby reached similar performance as CKiD albeit with 2.6 percentage points (pp; 95% CI 0.0–5.2 pp) higher P30 accuracy. However, Schwartz-Lyon was the most accurate equation at mGFR below 75 mL/min/1.73 m2 (P30 = 81%, 6.4 pp higher than for LMR18, 95% CI 4.1–8.7 pp).
Table 2. Bias, precision, accuracy (95% confidence intervals) of GFR estimating equations in children 2.0–17.9 years stratified for measured GFR <75 (n = 932) and ≥75 mL/min/1.73 m2 (n = 3 073).
Using LMR18 at mGFR above 75 mL/min/1.73 m2 led to increased underestimation but improved precision compared to LMR, which kept the accuracy unchanged. Comparing P30 at mGFR above 75 mL/min/1.73 m2, LMR18 had 8.1 pp (95% CI 6.5–9.6 pp) and 3.4 pp (95% CI 2.3–4.6 pp) higher accuracy than CKiD and Schwartz–Lyon, respectively. Validation results for a more detailed stratification by mGFR are presented in Supplementary Table S3. Decreased bias for LMR18 compared with LMR was noted at all levels of mGFR below 75 mL/min/1.73 m2 and resulted in P30 of at least 75% at mGFR 45–74 mL/min/1.73 m2. However, Schwartz–Lyon had superior accuracy among the evaluated equations in the range 30–74 mL/min/1.73 m2.
Validation results for children stratified by sex are presented in . Substantial improvements in bias were noted for LMR18 among both girls and boys at mGFR below 75 mL/min/1.73 m2. Bias and accuracy of the LMR equation with and without adjustment was further compared stratified for age (, Supplementary Table S4). The improvement in bias and accuracy at mGFR below 75 mL/min/1.73 m2 was especially evident at age below 13. Underestimation at mGFR above 75 mL/min/1.73 m2 was noticeable for LMR also after adjustment in the youngest age group. Validation results for individual cohorts are presented in Supplementary Tables S5. Noticeable improvements in P30 accuracy for LMR18 in children with mGFR below 75 mL/min/1.73 m2 was observed in all cohorts.
Figure 3. Associations in the validation cohort between age groups and median bias (estimated GFR – measured GFR) of the Lund–Malmö revised equation, both in the original formulation (LMR) and with creatinine adjusted to age 18 years (LMR18). Results stratified by (A) females with mGFR <75 (n = 385) and ≥75 mL/min/1.73 m2 (n = 1309) and (B) males with measured GFR (mGFR) <75 (n = 547) and ≥75 mL/min/1.73 m2 (n = 1764).
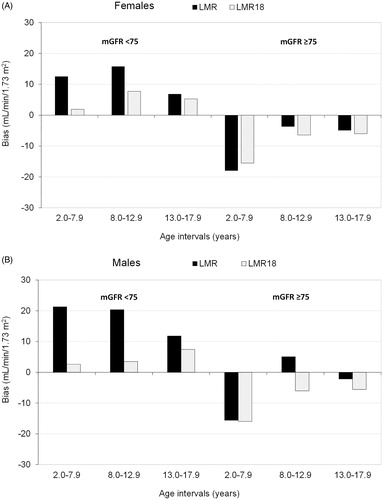
Table 3. Bias and accuracy (P30) of GFR estimating equations in children 2.0–17.9 years old stratified by sex and measured GFR <75 and ≥75 mL/min/1.73 m2.
Discussion
The sex-specific creatinine growth curves derived based on the reference cohort in the present study show how average creatinine levels increase during childhood and emerging adulthood. These growth curves can be used to recalculate childhood levels of creatinine to corresponding adult levels to make commonly used adult GFR equations applicable also among children. The present study demonstrated how this adjustment strategy led to marked improvements in GFR estimation accuracy for LMR when applied in children with decreased renal function and resulted in P30 accuracy of at least 75% at all mGFR levels above 45 mL/min/1.73 m2. A practical advantage of the suggested adjustment strategy is that there is no need for change in the original coefficients of the equation. We, therefore, expect that the same type of adjustment can be readily used also for other adult GFR equations, but the appropriate age threshold to use for each specific equation is a topic for further investigations. Another advantage of the recalculated creatinine values is that well established creatinine reference intervals for adults may be used if not available for certain childhood age intervals.
A major strength of the present study was that separate and non-overlapping cohorts were used for establishment of creatinine growth curves and validation of the GFR equations. The size of the cohorts, n = 83,157 to establish creatinine curves and n = 4005 in the validation cohort, led to narrow CIs in the overall performance metrics (e.g. the statistical uncertainty in the estimated P30 accuracy was at most ±3 pp). The validation cohort included paediatric patients from four different European countries (Belgium, France, Netherlands and Sweden). Nevertheless, we do not know to what extent the creatinine growth curves and the reported improvements in estimation accuracy for LMR are broadly generalizable to patient populations of children elsewhere in Europe. Another limitation was that we were not able to study different ethnic groups. Our growth curves should therefore be used with caution in other populations, including ethnic minorities within the investigated populations, which may exhibit different patterns of growth in muscle mass and thereby in creatinine levels during childhood and emerging adulthood. On the positive side, however, is that creatinine growth curves for more specific populations can be established based on routine health care data as they do not require mGFR. A final limitation, as with all creatinine based GFR equations, estimates for patients with abnormally low muscle mass due to e.g. anorexia or paralysis can be expected to be systematically too high also when LMR is applied on adjusted creatinine.
The current Kidney Disease Improving Global Outcomes (KDIGO) guidelines recommend the use of the CKiD equation in children and the CKD-EPI equation in adults, unless alternative equations improve accuracy [Citation26]. LMR18 with adjusted creatinine was in the present validation equally accurate as CKiD in children with decreased renal function, and more accurate in children with normal GFR. Previous research has highlighted how implausible intra-individual changes in eGFR may occur when switching from the height-dependent CKiD equation in paediatric care to the age-dependent CKD-EPI in adults [Citation14]. FAS bypasses this transition problem and has so far been the only creatinine-based equation applicable for the entire lifespan [Citation13]. However, the present study shows that LMR18 based on adjusted creatinine is an alternative that can be used irrespectively of both age and renal function. Another advantage with both FAS and LMR18 compared to the paediatric equations CKiD and Schwartz–Lyon is that data on height are not necessary for valid estimations in children. As in adults, estimated GFR can thus be automatically given by the laboratories. This notwithstanding, LMR18 does not reach the KDIGO 75% limit of P30 accuracy (74%) in children with mGFR <75 mL/min/1.73 m2 in contrast to Schwartz–Lyon (81%), which is most likely explained by the fact that height is a better marker of growth in muscle mass and creatinine than age for these patients. Still LMR18 has 80–90% P30 across the 75 mL/min/1.73 m2 suggested CKD threshold for children [Citation25] and 75% P30 down to at least 60 mL/min/1.73 m2. It should also be noted that Schwartz-Lyon has a substandard accuracy (P30 <75%) at mGFR <45 mL/min/1.73 m2.
A recent validation study using the EKFC database has provided evidence that cystatin C is a more reliable filtration marker than creatinine for GFR estimations in children with severe CKD [Citation11]. However, arithmetic means of the best creatinine and cystatin C equations generally led in the same study to improvements in estimation accuracy compared with both single-marker and composite equations. Future validation studies should therefore consider the possibility to use the arithmetic mean of LMR applied on adjusted creatinine and the CAPA (Caucasian, Asian, Paediatric and Adult) equation based on cystatin C [Citation18].
In conclusion, the suggested GFR estimation strategy based on adjusted creatinine obtained from growth curves showed remarkable improvement in GFR estimation accuracy among children with CKD. The approach should be possible to extend to other GFR equations, other ethnic groups and other biomarkers of renal function such as cystatin C.
Supplemental Material
Download PDF (327.5 KB)Acknowledgements
The authors are grateful to the following collaborators who provided data and valuable input for the study: Laurence Dubourg (Hospices Civils de Lyon, Université Claude Bernard, Lyon, France), Arend Bökenkamp (Emma Children’s Hospital, Amsterdam UMC, The Netherlands), Karolien Goffin (University Hospital, Leuven, Belgium), Ulla Berg, Magnus Hansson, Karin Littmann and Kajsa Åsling-Monemi (Karolinska University Hospital Huddinge, Stockholm, Sweden), Veronica Lindström (Lund University, Sweden), and Per-Ola Sundin (Örebro University, Sweden).
Disclosure statement
None of the authors declare any conflict of interest.
Data availability statement
The EKFC dataset used in the present study is hosted by the Lund University Population Research Platform (LUPOP). Legal and ethical restrictions prevent public sharing of the dataset. Data can be made available for collaborations upon request to interested researchers but would generally require a new ethical permission and the permission of each of the data-owners. You can find contact information for the data host at https://www.lupop.lu.se/
Additional information
Funding
References
- Björk J, Grubb A, Sterner G, et al. Revised equations for estimating glomerular filtration rate based on the Lund-Malmö Study cohort. Scand J Clin Lab Invest. 2011;71:232–239.
- Björk J, Jones I, Nyman U, et al. Validation of the Lund–Malmö, chronic kidney disease epidemiology (CKD-EPI) and modification of diet in renal disease (MDRD) equations to estimate glomerular filtration rate in a large Swedish clinical population. Scand J Urol Nephrol. 2012;46:212–222.
- Evans M, van Stralen KJ, Schon S, et al.; On the behalf of the ERA-EDTA Registry and the Swedish Renal Registry oration. Glomerular filtration rate-estimating equations for patients with advanced chronic kidney disease. Nephrol Dial Transplant. 2013;28:2518–2526.
- Nyman U, Grubb A, Larsson A, et al. The revised Lund-Malmo GFR estimating equation outperforms MDRD and CKD-EPI across GFR, age and BMI intervals in a large Swedish population. Clin Chem Lab Med. 2014;52:815–824.
- Ebert N, Loesment A, Martus P, et al. Iohexol plasma clearance measurement in older adults with chronic kidney disease-sampling time matters. Nephrol Dial Transplant. 2015;30:1307–1314.
- Inker LA, Levey AS, Tighiouart H, et al. Performance of glomerular filtration rate estimating equations in a community-based sample of Blacks and Whites: the multiethnic study of atherosclerosis. Nephrol Dial Transplant. 2018;33:417–425.
- Pottel H, Delanaye P, Schaeffner E, et al. Estimating glomerular filtration rate for the full age spectrum from serum creatinine and cystatin C. Nephrol Dial Transplant. 2017;32:497–507.
- Werner K, Pihlsgard M, Elmstahl S, et al. Combining cystatin C and creatinine yields a reliable glomerular filtration rate estimation in older adults in contrast to β-trace protein and β2-microglobulin. Nephron. 2017;137:29–37.
- Björk J, Bäck SE, Ebert N, et al. GFR estimation based on standardized creatinine and cystatin C: a European multicenter analysis in older adults. Clin Chem Lab Med. 2018;56:422–435.
- Björk J, Grubb A, Gudnason V, et al. Comparison of glomerular filtration rate estimating equations derived from creatinine and cystatin C: validation in the Age, Gene/Environment Susceptibility-Reykjavik Elderly Cohort. Nephrol Dial Transplant. 2018;33:1380–1388.
- Björk J, Nyman U, Berg U, et al. Validation of standardized creatinine and cystatin C GFR estimating equations in a large multicentre European cohort of children. Pediatr Nephrol. 2019;34:1087–1098.
- Hoste L, Dubourg L, Selistre L, et al. A new equation to estimate the glomerular filtration rate in children, adolescents and young adults. Nephrol Dial Transplant. 2014;29:1082–1091.
- Pottel H, Hoste L, Dubourg L, et al. estimated glomerular filtration rate equation for the full age spectrum. Nephrol Dial Transplant. 2016;31:798–806.
- Pottel H, Björk J, Bökenkamp A, et al. Estimating glomerular filtration rate at the transition from pediatric to adult care. Kidney Int. 2019;95:1234–1243.
- Blufpand HN, Tromp J, Abbink FC, et al. Cystatin C more accurately detects mildly impaired renal function than creatinine in children receiving treatment for malignancy. Pediatr Blood Cancer. 2011;57:262–267.
- Blufpand HN, Westland R, van Wijk JA, et al. Height-independent estimation of glomerular filtration rate in children: an alternative to the Schwartz equation. J Pediatr. 2013;163:1722–1727.
- Westland R, Abraham Y, Bokenkamp A, et al. Precision of estimating equations for GFR in children with a solitary functioning kidney: the KIMONO study. Clin J Am Soc Nephrol. 2013;8:764–772.
- Grubb A, Horio M, Hansson LO, et al. Generation of a new cystatin C-based estimating equation for glomerular filtration rate by use of 7 assays standardized to the international calibrator. Clin Chem. 2014;60:974–986.
- den Bakker E, Gemke R, van Wijk JAE, et al. Accurate eGFR reporting for children without anthropometric data. Clin Chim Acta. 2017;474:38–43.
- Soveri I, Berg UB, Björk J, et al. Measuring GFR: a systematic review. Am J Kidney Dis. 2014;64:411–424.
- Schwartz GJ, Munoz A, Schneider MF, et al. New equations to estimate GFR in children with CKD. J Am Soc Nephrol. 2009;20:629–637.
- De Souza VC, Rabilloud M, Cochat P, et al. Schwartz formula: is one k-coefficient adequate for all children. PLoS One. 2012;7:e53439.
- Stevens LA, Zhang Y, Schmid CH. Evaluating the performance of equations for estimating glomerular filtration rate. J Nephrol. 2008;21:797–807.
- NKF5. K/DOQI clinical practice guidelines for chronic kidney disease: evaluation, classification, and stratification. Part 5. Evaluation of laboratory measurements for clinical assessment of kidney disease. Guideline 4. Estimation of GFR. Am J Kidney Dis. 2002;39:S76–S92.
- Pottel H, Hoste L, Delanaye P. Abnormal glomerular filtration rate in children, adolescents and young adults starts below 75 mL/min/1.73 m(2). Pediatr Nephrol. 2015;30:821–828.
- Kdigo. Kidney Disease Improving Global Outcomes (KDIGO) CKD Work Group. KDIGO 2012 clinical practice guideline for the evaluation and management of chronic kidney disease. Kidney Int Suppl. 2013;3:1–150.