
Abstract
Quantitation of endogenous steroids and their precursors is essential for diagnosis of a wide range of endocrine disorders. Usually, these analyses have been carried out using immunoassays. However, immunoassays often overestimate concentrations due to assay interference by other endogenous steroids, especially for low concentrations. Mass spectrometry based methods offer superior specificity, accuracy, and sensitivity. We therefore present a liquid chromatography–tandem mass spectrometry (LC-MS/MS) method with automated sample preparation for determination of 17α-hydroxyprogesterone (17OHP), cortisol, cortisone, dehydroepiandrosterone sulfate (DHEAS), androstenedione (A4), testosterone (T), and estrone sulfate (E1S). Samples were prepared using protein precipitation and 96-well filter plates, fully automated in a pipetting robot and analyzed by LC-MS/MS. Serum samples from 187 healthy children and adolescents aged 5-18 years were used to study hormone changes in relation to sex and pubertal stage. Lower limit of quantification for 17OHP was 0.7 nmol/L, for cortisol 11 nmol/L, for cortisone 2 nmol/L, for DHEAS 0.1 µmol/L, and for A4, T, and E1S, 0.2 nmol/L. This study showed a general increase in 17OHP, DHEAS, A4, T and E1S in both genders during puberty. In boys, A4 and T increased significantly throughout pubertal development. Girls had significantly higher A4 and E1S concentrations, while boys had higher T concentrations. No sex- or puberty-specific differences were seen in cortisol or cortisone concentrations. To the best of our knowledge, this is the first presentation of changes in serum E1S concentrations during pubertal development in healthy children.
Introduction
Quantitative determination of steroids is important for assessing adrenal and gonadal function, differential diagnosis, and therapeutic drug monitoring, and steroid analysis is increasingly in demand for research in neonates, children, and adults.
Immunoassay, often without extraction or chromatographic separation, has become the principal method for routine determination of steroid concentrations. While these assays may be validated in adults, they do not produce accurate results in the lower serum or plasma levels, especially for samples taken during the neonatal period [Citation1–7]. There is also a lack of pediatric reference intervals which are crucial in patient care for distinguishing between healthy and pathological states [Citation8]. Tandem mass spectrometry techniques have emerged as the golden standard method to meet this need for determination of steroid hormones. Advantages include its superior specificity and the possibility for multiplexing with a low sample volume. This enables simultaneous analyses of several steroids that might improve clinical care and research studies.
We have previously presented a highly sensitive gas chromatography–tandem mass spectrometry method for the simultaneous determination of estrone (E1), and estradiol (E2) [Citation9]. Although sensitivity and chromatographic resolution of gas chromatography–tandem mass spectrometry are excellent, liquid chromatography–tandem mass spectrometry (LC-MS/MS) allows the rapid determination of both unconjugated and conjugated steroids. Furthermore, GC-based methods require more extensive sample workup and derivatization before analysis.
17α-hydroxyprogesterone (17OHP) is predominantly synthesized in the adrenal glands but also in the gonads, and it is a metabolic precursor of cortisol. Elevated levels of 17OHP co-occurring with elevated concentrations of androstenedione (A4) and testosterone (T) is indicative of congenital adrenal hyperplasia (CAH) in the newborn or non-classical CAH in children and adolescents [Citation10]. In many countries, determination of 17OHP is routinely used as neonatal screening and monitoring of optimal hydrocortisone treatment in CAH [Citation11]. However, with MS/MS technology, quantitation of 17OHP together with A4 and T is also useful in the investigation of suspected hyperandrogenism and its origin [Citation12–14]. Although the underlying mechanism of hyperandrogenism in females with polycystic ovarian syndrome (PCOS) is not fully understood yet, a recent study on obese adolescent girls showed that A4 and T are key steroid hormones to distinguish between PCOS and non- PCOS [Citation15]. Reference intervals during pubertal development are needed for further research studies, assessing differential diagnosis and monitoring of replacement therapy.
Serum cortisol levels display an individual variation which is preserved through childhood, with a classical circadian pattern and an immediate increase in response to stress or meal load [Citation16]. The 11-beta hydroxysteroid dehydrogenase-type 2 (β-HSD2) enzyme is responsible for the conversion of cortisol to the biologically inactive cortisone [Citation17]. Recent research has focused on the association between the plasma cortisol/cortisone ratio as an indirect marker of β-HSD2 enzyme activity and on the metabolic consequences of suboptimal activity of this enzyme [Citation18,Citation19].
Dehydroepiandrosterone (DHEA) is an adrenal-derived androgen which serves as a precursor for both androgen and estrogen synthesis. Its sulfo-conjugated form DHEA-sulfate (DHEAS) is the most abundant circulating androgen, probably due to its longer half-life. The concentration of DHEAS is more stable than DHEA during the day, and it is therefore preferred over DHEA for measurement in serum and/or plasma samples [Citation20]. Mildly elevated concentrations of DHEAS, A4, and T are found in children with premature adrenarche [Citation21].
The sulfo-conjugated estrone sulfate (E1S) is the most abundant estrogen precursor in the human circulation. As an estrogen, it has a relatively low biological activity; however, it is readily converted into other more powerful estrogen. In adults, serum E1S concentrations are 10-20 times higher than E1 and E2 levels, and E1S has a long half-life [Citation3,Citation22–25]. In humans, there is a suggestion that the conversion of E1S to E2 may have a biological role in the development of disease, i.e. the activity of tissue sulfatase enzyme may be elevated. However, to the best of our knowledge there are no published studies examining how serum concentration of E1S changes throughout puberty in children.
In an attempt to mimic normal puberty, girls with hypogonadism need estrogen replacement therapy (ERT) for pubertal induction. Although titration of E2 concentrations during transdermal treatment has been studied, no such target range has been established with oral estrogen therapy in girls, given the higher levels of E1, E1S and total bioestrogen. Determination of E1S concentrations as a complement to that of E1 and E2 would potentially be a valuable tool for studies of total estrogen exposure during ERT in children.
In this study, we developed an automated sample preparation and LC-MS/MS method for simultaneous determination of serum 17OHP, cortisol, cortisone, DHEAS, A4, T, and E1S. We studied steroid changes in relation to sex and puberty in children and adolescents.
Material and methods
Pure reference compounds were used to optimize chromatography, ionization settings, and mass transitions for MRM (). A very simple sample preparation method consisting of protein precipitation in acetonitrile and filtration was used for serum samples. This method was implemented using 96-well plates and a pipetting robot.
Table 1. Internal standards and settings for MRM transitions.
Reagents and standards
Certified reference materials (CeriliantTM) were purchased from Sigma-Aldrich AB (Stockholm, Sweden); internal standards of 17OHP, DHEAS, A4, T, in isotope labelled forms: 2,2,4,6,6,21,21,21-D8-17OHP, 2,2,3,4,4,-D5-DHEAS, 2,3,4-13C3-androstene-3,17-dione, and 2,3,4-13C3-T were purchased from Sigma-Aldrich AB (Stockholm, Sweden); 9,11,12,12-D4-cortsiol was purchased from Cambridge isotopes laboratories Inc (Tewksbury, MA, USA) and 2,4,16,16-D4-E1S from QMX laboratories Ltd (Dunmow, UK). All other reagents were purchased from VWR International AB (Stockholm, Sweden) and were of the highest purity available. The free steroids matrix (blank serum) was charcoal-adsorbed human serum (MSG3000) purchased from Golden West Diagnostics, LLC (Temecula, USA). The 96-well filter (Captiva™) and collection plates were from Agilent (Montreal, Canada).
Calibrator preparation
Stock standards were prepared in absolute ethanol at a concentration of 100 ng/µL for 17OHP (303 µmol/L), cortisone (277 µmol/L), A4 (349 µmol/L), and T (347 µmol/L), 1 µg/µL for cortisol (2761 µmol/L) and DHEAS (2716 µmol/L), and 1 ng/µL for E1S (2.9 µmol/L); these were stored at −20 °C. Stock calibrator solutions of 2.6 µmol/L for 17OHP, 55.2 µmol/L for cortisol, 33.3 µmol/L for cortisone, 1290 µmol/L for DHEAS, 2.8 µmol/L for A4, 5.9 µmol/L for T, and 0.3 µmol/L for E1S were prepared in absolute ethanol. This stock was diluted with charcoal-adsorbed human serum (MSG3000 blank serum) to achieve a 50.5 nmol/L for 17OHP, 1083 nmol/L for cortisol, 653 nmol/L for cortisone, 25.3 µmol/L for DHEAS, 55 nmol/L calibrator for A4, 115 nmol/L for T, and 5.6 nmol/L for E1S; this calibrator was thereafter serially diluted with charcoal-adsorbed human serum (MSG3000 blank serum) to make six additional calibrators in the range shown in .
Sample preparation
Sample preparation was routinely carried out fully automatized using a pipetting robot (Freedom Evo, Tecan, Switzerland). 100 µl of acetonitrile containing internal standards (2.4 nmol/L of D8-17OHP, 193 nmol/L of D4-cortisol, 1.1 µmol/L of D5-DHEAS, 14.0 nmol/L of 13C3-A4, 17.3 nmol/L of 13C3-T, and 2.9 nmol/L of D4-E1S) was transferred to each well of a Captiva™ (Agilent, Montreal, Canada) 96-well filter plate using the fixed Teflon-coated tips. Thawed serum sample (50 µl) was added to the filter plate using disposable tips. The plate was shaken for 10 min at 1000 rpm to precipitate serum proteins. The samples were filtered into 96-well collection plates using 600 mbar of negative pressure for 5 min. Finally, the samples were diluted with 80 µl of deionized water and mixed by shaking at 1000 rpm for 5 min. A typical batch consisted of two 96-well filter plates. A calibration curve of seven samples, a blank serum after each calibration set, as well as seven quality control samples on each plate, all in duplicates were included in all batches analyzed. This protocol allowed for another 160 samples divided into these two plates. Using these quality control samples, LOQ and inter-assay variability at three concentration levels was possible to assess for each steroid.
Liquid chromatography–mass spectrometry
LC-MS/MS was performed on an Agilent 1260 LC system coupled to an Agilent 6460 triple quadrupole mass spectrometer (Montreal, Canada) equipped with a JetStream™ electrospray interface. A sample volume of 20 µL was injected. The steroids were separated on a Poroshell 120 EC-C18, 3 × 50 mm, 2.7 µm (Agilent, Montreal, Canada) with a 3 mm guard column. The column was thermostated to 40 °C. The gradient consisting of 1 mM NH4F (A) and 1 mM NH4F in methanol:2-propanol (3:1, by vol, B) at a constant flow of 0.25 ml/min. The separation started with 10% B isocratic for 1 min, followed by a linear increase to 100% B in 7 min and held for 2 min. The gradient was reversed for 1 min and the column allowed to re-equilibrate for 3 min. Hence, the total gradient elution was 11 min, followed by a 3 min post run equilibration time. The ion source was operated with the following settings: nebulizer gas temperature 300 °C, nebulizer gas flow 4 L/min, nebulizer gas pressure 40 psi, sheath gas temperature 375 °C, sheath gas flow 11 L/min, capillary positive voltage 4000 V, capillary negative voltage 4500, nozzle voltage 500 (positive mode) or 1500 (negative mode). The column effluent was directed to waste from 0–6 min, to the detector 6–10 min and again to waste until completion of the run. The detector was operated in polarity-switching mode from 6 to 8 min for cortisol, cortisone, DHEAS, and E1S. From 8 to 10 min the detector was operated in positive mode only for T, A4, and 17OHP. Multiple reaction monitoring (MRM) settings for each component were optimized using the Optimizer (Agilent, Montreal, Canada) software and are listed in .
Specimens
The serum samples used were leftover patient samples from children and adolescents (non-fasting, ages 5–18 years) submitted for routine clinical testing to the laboratory at Göteborg Pediatric Growth Research Center, Sweden in 2015–2018. Taking into account diurnal variations, blood samples drawn between 8 and 12 a.m. were selected. All samples were de-identified and stored at −20 °C until assayed. All samples were determined in duplicates. Six samples were re-analyzed diluted due to E1S concentrations above highest calibrator. The highest calibrator was therefore changed to 24 nmol/L in the next batch of calibrators.
In 187 samples from children and adolescents (85 females and 102 males), puberty stages (estimated by pediatricians) were registered for studying steroid changes during pubertal development. These individuals were seemingly healthy, non-obese and not subject to sex hormone replacement therapy, contraceptive pills or puberty blockers. Pathological conditions such as anorexia nervosa, CAH, precocious or delayed puberty, PCOS, gynecomastia and chromosomal disorders were excluded. Individuals coming as immigrants to Sweden recent years were also excluded. In females, breast development was assessed according to Tanner [Citation26]. In males, testicular volumes were determined by orchidometer [Citation27] and classified into different stages based on testosterone secretion during puberty [Citation28]. Informed consent was obtained, in accordance with the Swedish Biobank Act (Biobankslagen SFS 2002: 297), in the form of parental agreement to the inclusion of their child’s samples and data at referral in a biobank.
Assay performance characteristics
The lower limit of detection (LOD) was determined by using both repeated measurement of a blank sample (charcoal-adsorbed human serum from Golden West Diagnostics, LLC, Temecula, USA) containing no steroids (limit of blank = mean (blank) + 1.645 (SD (blank))) and 10–20 replicates of three different serum samples known to contain low endogenous sex steroid concentrations (LOD = limit of blank + 1.645 (SD (low concentration sample))) [Citation29]. The lower limit of quantification (LOQ) was defined as the lowest concentration of an analyte that could be determined with an inter-assay coefficient of variation (CV) of ≤ 20%.
Evaluation of intra- and inter-assay precision was performed with pure pooled serum samples (not spiked) obtained from prepubertal and early-mid pubertal boys and girls, respectively, representing low and medium sex steroid concentrations and commercially available quality controls; Lyphochek 40301 and 40272 from Bio-Rad (Hercules, CA, USA). Seven pooled sera were used for intra-and inter-assay evaluation during validation and four of them were used later in routine. For defining LOD, four additional samples with low hormone levels were used.
To assess accuracy, three pooled child samples were spiked with a calibrator containing 0.5 nmol/L 17OHP, 9.8 nmol/L cortisol, 5.9 nmol/L cortisone, 0.2 µmol/L DHEAS, 0.5 nmol/L A4, 1.1 nmol/L T, and 0.051 nmol/L E1S. The measured concentration was compared with the expected concentration. We participated in an international external quality assessment scheme (EQAS) for laboratory medicine (Labquality, Finland), where our results were compared with other MS/MS method results (n = number of other participants) for 17OHP (n = 2), A4 (n = 2), and T (n = 5), or with immunoassays for cortisol (n = 100) and DHEAS (n = 34); however, no such program was available for cortisone or E1S.
Statistical analysis
Steroid concentrations in relation to sex and pubertal stage are presented as median values and ranges in tables and as 5th, 25th, 50th, 75th and 95th percentiles in figures. Steroid concentrations below LOQ were set to LOQ divided by 2 for each of the steroids. The Mann–Whitney U test (IBM SPSS Statistics, version 20) was used for comparison of steroid concentrations at different pubertal stages. p < 0.05 was considered as statistically significant.
Results
Characteristics of the LC-MS/MS method
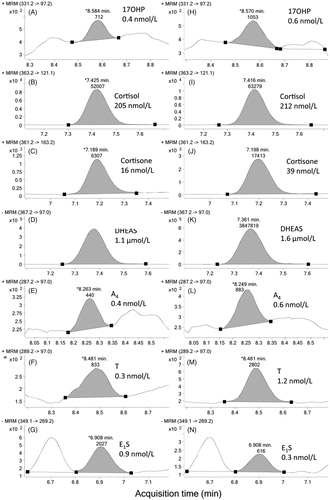
Representative chromatograms from two pediatric serum pools are shown in . Key to achieving high enough sensitivity was to include NH4F in both phases used in the chromatographic gradient. Substitution of NH4F by ammonium acetate, ammonium formate, or formic acid resulted in substantially decreased sensitivity.
Figure 1. Typical MRM chromatograms for endogenous 17OHP, cortisol, cortisone, DHEAS, A4, T, and E1S. Two different child serum pools were analyzed by liquid chromatography–tandem mass spectrometry: panels A to G show results for the low androgen serum pool and panels H to N show results for the low estrogen serum pool. Analyte and measured concentration is indicated for each panel. (MRM: multiple reaction monitoring; 17OHP: 17α-hydroxyprogesterone; DHEAS: dehydroepiandrosterone sulfate; A4: androstenedione; T: testosterone; E1S: estrone sulfate).
Calibration curve, sensitivity, and precision
Calibrators made from spiking pure standards into charcoal-washed human serum showed a linear response through all points in the calibration curves (). Linearity was considered satisfactory when the correlation coefficients were above r = 0.98 over the full concentration range. However, analysis of authentic samples displayed lower sensitivity at the lowest concentrations, as there was substantial ion suppression in patient samples and serum pools. Precision data, LODs and LOQs are shown in .
Table 2. Lower limit of detection (LOD), limit of quantification (LOQ) and precision data for determination of seven different steroids in serum by LC-MS/MS.
Accuracy
Accuracy was consistent and reproducible, tested by spiking three different child sera: 101–109% for 0.9-1.0 nmol/L 17OHP, 100–108% for 219-266 nmol/L cortisol, 94–108% for 31-42 nmol/L cortisone, 95–104% for 1.1-1.6 µmol/L DHEAS, 102–107% for 0.2–0.6 nmol/L A4, 84–107% for 0.3-1.2 nmol/L T, and 83–98% for 0.1-0.2 nmol/L E1S, all performed in duplicates. Twenty-two samples were analyzed in the Labquality EQAS for laboratory medicine. The majority of our deviations compared to other methods were within the accepted variance of ± 2SD. However, results for 17OHP were outside the accepted range in three samples and A4 were outside the accepted range in two samples.
Interference from structurally related steroids
To test interference from other steroids, blank serum was spiked with the following pure standards at high concentration: E2, E1, T, A4, 5α- dihydrotestosterone, cortisol, cortisone, DHEAS, 16OHP, 17OHP, progesterone, E1S, 11-deoxycorticosterone (=21OHP), 11-deoxycortisol, 2-methoxyE1, 2-methoxyE2, and DHEA. Of these, only DHEA and 11-deoxycorticosterone produced visible peaks in the integration window of A4 and 17OHP, respectively. Both interfering steroids were, however, clearly chromatographically separated from each target component.
Stability tests
Previous studies have found steroids to be relatively stable in plasma and serum and not affected by long-term storage at −20 °C or −80 °C for up to a decade or repeated thaw–freeze cycles [Citation28,Citation30,Citation31]. Twelve months of stock stability was established for serum calibrators. Rerunning three batches of samples stored for between 14 days and two months at −20 °C resulted in no change in concentrations (within inter-assay CVs) of the seven analyzed steroids. Four internal quality controls were used continuously for three years without drift in concentrations (± 2SD from mean).
Steroid levels during puberty
Serum concentrations of 17OHP, DHEAS, A4, T, and E1S determined by LC-MS/MS in relation to sex and pubertal stages, as expressed in Tanner breast stage or testicular volume, are summarized in , and Citation3.
Figure 2. Box and whisker plots presenting serum androgen concentrations in relation to pubertal stages in children and adolescents (85 females (left panel) and 102 males (right panel)), compared against the preceding pubertal stage. Serum A4 and testosterone concentrations below LOQ were set to LOQ/2. Box whisker plots show 5th, 25th, 50th, 75th, and 95th percentiles. *p < 0.05, **p < 0.01, ***p < 0.001. (DHEAS: dehydroepiandrosterone sulfate; A4: androstenedione; T: testosterone.).
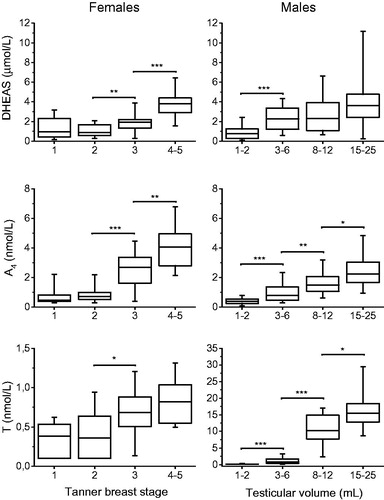
Table 3. Serum steroid concentrations in 85 females and 102 males, ages 5-18 years, determined by LC-MS/MS in relation to Tanner breast stage or testicular volume. Samples were taken between 8 and 12 a.m.
Cortisol, cortisone or the ratio cortisol/cortisone did not show any sex or pubertal dependency; therefore, cortisol/cortisone ratio was calculated on the whole group of children and adolescents (). No sex differences were found in cortisol, cortisone or the ratio cortisol/cortisone. Before puberty, girls had significantly higher A4 (p < 0.05) and T (p < 0.01) concentrations but no sex differences were found in DHEAS, 17OHP, or E1S concentrations. At the end of puberty, there was no sex-specific difference in DHEAS concentrations, but adolescent boys had significantly higher T (p < 0.001) and 17OHP (p < 0.05) concentrations, while adolescent girls had significantly higher A4 (p < 0.01) and E1S concentrations (p < 0.001).
Serum 17OHP concentrations followed the same pattern in both sexes, with a significant increase from early to mid-puberty. The majority of samples from children before and in early puberty were below LOQ (). There was a significant stepwise increase in A4 and T in males. In males, the largest increase in serum androgen concentration occurred at the start of puberty (). In females, DHEAS and A4 concentrations increased in parallel from Tanner breast stage 2 to Tanner breast stage 4-5. T and 17OHP, on the other hand, increased significantly from Tanner breast stage 2 to Tanner breast stage 3 ( and ).
Figure 3. Box and whisker plots presenting serum 17OHP and E1S concentrations in children and adolescents (85 females (left panel) and 102 males (right panel)) before puberty and during pubertal development. Hormone concentrations below LOQ were set to LOQ/2. Box whisker plots show 5th, 25th, 50th, 75th, and 95th percentiles. *p < 0.05, **p < 0.01, ***p < 0.001. (17OHP: 17α-hydroxyprogesterone;) E1S: estrone sulfate.).
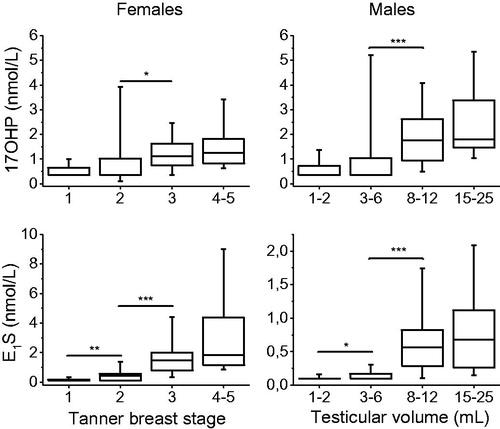
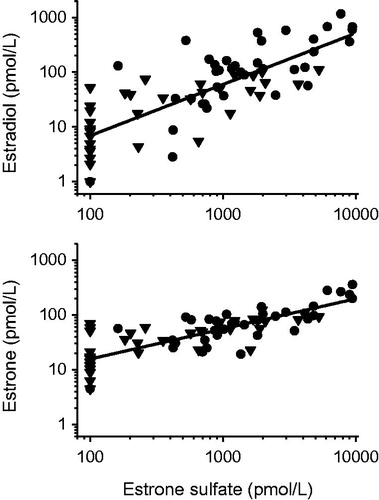
Serum concentration of E1S in both females and males was very low in prepubertal children, with 70% of the samples from girls and 90% of the samples from boys containing E1S concentrations below the LOQ. Both females and males followed a similar marked increase in serum E1S concentrations throughout puberty, although the levels in adolescent girls were three to four times higher compared to adolescent boys by the end of puberty (). A significant correlation was found between E1S and previously determined E1 and E2 [9], n = 73, r = 0.80, r = 0.79 and p < 0.001, respectively ().
Figure 4. Scatter plot presenting the correlation between serum estrone sulfate concentrations, estradiol (upper panel) and estrone (lower panel), respectively in 73 healthy children. Triangles depict boys and circles represent girls. Estrogen concentrations below LOQ were set to LOQ/2. Linear regression analysis yielded a strong correlation with estrone sulfate: r = 0.79, p < 0.001 for estradiol and r = 0.80, p < 0.001 for estrone.
Discussion
We describe the development of a simple and selective LC-MS/MS-based method which allows for simultaneous quantification of 17OHP, cortisol, cortisone, DHEAS, A4, T, and E1S, together with sex- and puberty-specific levels. To the best of our knowledge, this is the first presentation of E1S changes during puberty in children.
To date there are only a few previous studies on 17OHP changes in healthy children and adolescents. However, the majority of those studies divided the children into age groups, which is suboptimal given that individuals mature more or less independently of chronological age. Our study was based on pubertal maturation and accordingly, we found a significant rise in 17OHP from early to mid-puberty, indicating a gonadal contribution. This has also been shown for adult women with 17OHP levels being lower in the follicular phase compared to the luteal phase during the menstrual cycle [Citation12]. Using mass spectrometric methodology, only three of the previous studies followed children in relation to pubertal stages [Citation32–34]. These reports are well in line with the results of the present study.
The clinical implication of 17OHP analysis is to identify hyperandrogenism, with plasma 17OHP above 5 nmol/L in children and adults [Citation14] and CAH, with levels above 75 nmol/L in term infants [Citation11], or monitoring of replacement therapy. However, these levels may not be appropriate cut-offs for LC-MS/MS, especially not for prepubertal children as shown in this study, and needs to be locally verified. It is known that 17OHP methods show considerable variation in results in EQAS programs [Citation35]. Hence, also our EQAS data revealed deviations in the results produced by different MS/MS methods. The phenomenon is thought to originate from two specific serum pools.
We did not find any sex or pubertal dependency in cortisol and cortisone concentration, but we did find a wide inter-individual variation, consistent with previous studies [Citation16,Citation36]. The serum concentrations of both hormones were consistent with a previous study using LC-MS/MS methodology [Citation36]. However, two other studies on cortisone concentrations in children, using similar methodology, yielded twice as high values compared to the present study [Citation18,Citation19], which could indicate interference with binding proteins, commutability issue, or isobaric interferences.
The average T concentrations in prepubertal girls were higher than expected [Citation9,Citation34,Citation37,Citation38], which probably reflects the selection of samples. The group with Tanner breast stage 1 may include true prepubertal girls as well as girls in early puberty (gonadarche) yet without signs of breast development. Previous studies have shown that girls in early puberty have significantly higher T concentrations compared to prepubertal girls [Citation34,Citation37,Citation38]. Hence, a mixture of prepubertal and early pubertal girls with Tanner breast stage 1 is likely the cause for the finding that girls have higher T concentrations compared to boys before start of puberty.
In the present study, adolescent boys had about twenty times higher T concentrations compared to adolescent girls, whereas girls had higher A4 throughout puberty, consistent with previous studies [Citation33,Citation34]. There is contradictory evidence whether there is a sex difference or not in DHEAS serum levels. Two previous studies report higher DHEAS concentrations in adolescent boys compared to adolescent girls in late puberty [Citation34,Citation39]. This study and another by Ceglarek et al., on the other hand found no sex difference [Citation32]. Fortunately, MS/MS methods for A4, DHEAS, and T are stable with high reproducibility, and the values presented here are fully comparable to previous studies [Citation9,Citation32,Citation34,Citation37,Citation40].
Previous studies on E1S in humans have almost exclusively focused on the role of E1S as a potential biomarker in pathophysiologic conditions. It is suggested that the conversion of E1S to E2 may have a biological role in the development of disease such as estrogen dependent tumors [Citation41]. Hence, in this study we found a strong correlation between the precursor E1S and the biological active E2. To the best of our knowledge this is the first study on changes of E1S in children during puberty, which opens new opportunities for clinical research studies in children. A previous study, however reported similar E1S concentrations in 391 healthy boys, as the present study, although not divided into age groups or pubertal stages [Citation42]. As expected, adolescent girls had higher E1S concentrations than adolescent boys during puberty, as estrogens are primarily secreted by the ovaries in adolescent girls. In adult men, only 5% of plasma E1 is produced directly by the testes and 95% is formed from circulating androgens [Citation43]. Serum E1S concentrations in adolescent boys and girls at the end of puberty were consistent with previous reports on levels in adult men and women [Citation23,Citation24]. Furthermore, the serum E1S concentrations in prepubertal girls were consistent with previous reports on levels in postmenopausal women [Citation25]. In the present study, children yielded about 5-10 times higher E1S in the beginning of puberty and increased to about 20-30 times higher in the end of puberty compared to our previously reported E1 concentrations [Citation9]. On the contrary, prepubertal children yielded about 20-50 times higher E1S compared to our previously reported E2 concentrations [Citation9], but only about 10-20 times higher than E2 at the end of pubertal development.
The weakness of this study is the limited number of individuals that may influence the interpretation of results. Although the sensitivity for T and E1S seems suboptimal, it was possible to distinguish between prepubertal stage and start of puberty. The latter is a crucial characteristic of a clinically useful method. One should also keep in mind that the analyses of LOQ and assay precision were performed on pure pooled patient samples from children with true low concentrations.
To conclude, based on its high specificity and estimated sex- and puberty-specific steroid changes, the LC-MS/MS method presented here is suitable for further scientific examination of 17OHP, cortisol, cortisone, DHEAS, A4, T, and E1S in children and adolescents.
Author contributions
All the authors have accepted responsibility for the entire content of this submitted manuscript and approved submission.
| Abbreviations | ||
| A4 | = | androstenedione |
| CAH | = | congenital adrenal hyperplasia |
| CV | = | coefficient of variation |
| DHEA | = | dehydroepiandrosterone |
| DHEAS | = | dehydroepiandrosterone sulfate |
| ERT | = | estrogen replacement therapy |
| E1 | = | estrone |
| E1S | = | estrone sulfate |
| E2 | = | estradiol |
| EQAS | = | external quality assessment scheme |
| β-HSD2 | = | 11-beta hydroxysteroid dehydrogenase-type 2 |
| LC-MS/MS | = | liquid chromatography–tandem mass spectrometry |
| LOD | = | limit of detection |
| LOQ | = | limit of quantification |
| MRM | = | Multiple reaction monitoring |
| 17OHP | = | 17α-hydroxyprogesterone |
| T | = | testosterone |
| PCOS | = | polycystic ovarian syndrome |
Acknowledgements
The authors thank the staff at the Göteborg Pediatric Growth Research Center laboratory for sample handling and Monika Eriksson for excellent technical assistance.
Disclosure statement
No potential conflict of interest was reported by the author(s).
Additional information
Funding
References
- Wudy SA, Wachter UA, Homoki J, et al. 17 alpha-hydroxyprogesterone, 4-androstenedione, and testosterone profiled by routine stable isotope dilution/gas chromatography-mass spectrometry in plasma of children. Pediatr Res. 1995;38(1):76–80.
- Rauh M, Groschl M, Rascher W, et al. Automated, fast and sensitive quantification of 17 alpha-hydroxy-progesterone, androstenedione and testosterone by tandem mass spectrometry with on-line extraction. Steroids. 2006;71(6):450–458.
- Corona G, Elia C, Casetta B, et al. Liquid chromatography tandem mass spectrometry assay for fast and sensitive quantification of estrone-sulfate. Clin Chim Acta. 2010;411(7-8):574–580.
- Koal T, Schmiederer D, Pham-Tuan H, et al. Standardized LC-MS/MS based steroid hormone profile-analysis. J Steroid Biochem Mol Biol. 2012;129(3-5):129–138.
- Soeborg T, Frederiksen H, Fruekilde P, et al. Serum concentrations of DHEA, DHEAS, 17alpha-hydroxyprogesterone, Delta4-androstenedione and testosterone in children determined by TurboFlow-LC-MS/MS. Clin Chim Acta. 2013;419:95–101.
- Mouritsen A, Soeborg T, Johannsen TH, et al. Longitudinal changes in circulating testosterone levels determined by LC-MS/MS and by a commercially available radioimmunoassay in healthy girls and boys during the pubertal transition. Horm Res Paediatr. 2014;82(1):12–17.
- Hamer HM, Finken MJJ, van Herwaarden AE, et al. Falsely elevated plasma testosterone concentrations in neonates: importance of LC-MS/MS measurements. Clin Chem Lab Med. 2018;56(6):e141–e143.
- Rauh M. Steroid measurement with LC-MS/MS. Application examples in pediatrics. J Steroid Biochem Mol Biol. 2010;121(3-5):520–527.
- Ankarberg-Lindgren C, Dahlgren J, Andersson MX. High-sensitivity quantification of serum androstenedione, testosterone, dihydrotestosterone, estrone and estradiol by gas chromatography-tandem mass spectrometry with sex- and puberty-specific reference intervals. J Steroid Biochem Mol Biol. 2018;183:116–124.
- Dahl SR, Nermoen I, Brondstad I, et al. 2018. Assay of steroids by liquid chromatography-tandem mass spectrometry in monitoring 21-hydroxylase deficiency. Endocr Connect. 7(12): 1542–1550.
- Nordenstrom A, Wedell A, Hagenfeldt L, Marcus C, et al. Neonatal screening for congenital adrenal hyperplasia: 17-hydroxyprogesterone levels and CYP21 genotypes in preterm infants. Pediatrics 2001. 108:E68.
- Fanelli F, Gambineri A, Belluomo I, et al. Androgen profiling by liquid chromatography-tandem mass spectrometry (LC-MS/MS) in healthy normal-weight ovulatory and anovulatory late adolescent and young women. J Clin Endocrinol Metab. 2013;98(7):3058–3067.
- Medeiros SF, Gil-Junior AB, Barbosa JS, et al. New insights into steroidogenesis in normo- and hyperandrogenic polycystic ovary syndrome patients. Arq Bras Endocrinol Metab. 2013;57(6):437–444.
- Honour JW. 17-Hydroxyprogesterone in children, adolescents and adults. Ann Clin Biochem. 2014;51(Pt 4):424–440.
- Reinehr T, Kulle A, Rothermel J, et al. Longitudinal analyses of the steroid metabolome in obese PCOS girls with weight loss. Endocr Connec. 2017;6(4):213–224.
- Knutsson U, Dahlgren J, Marcus C, et al. Circadian cortisol rhythms in healthy boys and girls: relationship with age, growth, body composition, and pubertal development. J Clin Endocrinol Metab. 1997;82(2):536–540.
- Tomlinson JW, Stewart PM. Cortisol metabolism and the role of 11beta-hydroxysteroid dehydrogenase. Best Pract Res Clin Endocrinol Metab. 2001;15(1):61–78.
- Tenhola S, Turpeinen U, Halonen P, et al. Association of serum lipid concentrations, insulin resistance index and catch-up growth with serum cortisol/cortisone ratio by liquid chromatography tandem mass spectrometry in children born small for gestational age. Pediatr Res. 2005;58(3):467–471.
- Carvajal CA, Tapia-Castillo A, Valdivia CP, et al. Serum Cortisol and Cortisone as potential biomarkers of Partial 11beta-hydroxysteroid dehydrogenase type-2 Deficiency. Am J Hypertens. 2018;31(8):910–918.
- Rosenfeld RS, Rosenberg BJ, Fukushima DK, et al. Hellman L: 24-Hour secretory pattern of dehydroisoandrosterone and dehydroisoandrosterone sulfate. J Clin Endocrinol Metab. 1975;40(5):850–855.,
- Kaplowitz P, Soldin SJ. Steroid profiles in serum by liquid chromatography-tandem mass spectrometry in infants with genital hair. J Pediatr Endocrinol Metab. 2007;20:597–605.
- Ruder HJ, Loriaux L, Lipsett MB. Estrone sulfate: production rate and metabolism in man. J Clin Invest. 1972;51(4):1020–1033.
- Giton F, Caron P, Berube R, et al. Plasma estrone sulfate assay in men: Comparison of radioimmunoassay, mass spectrometry coupled to gas chromatography (GC-MS), and liquid chromatography-tandem mass spectrometry (LC-MS/MS). Clin Chim Acta. 2010;411(17-18):1208–1213.
- Hosogi J, Tanaka H, Fujita K, et al. LC-MS/MS coupled with immunoaffinity extraction for determination of estrone, 17beta-estradiol and estrone 3-sulfate in human plasma. J Chromatogr B Analyt Technol Biomed Life Sci. 2010;878(2):222–227.
- Wang Q, Bottalico L, Mesaros C, et al. Analysis of estrogens and androgens in postmenopausal serum and plasma by liquid chromatography-mass spectrometry. Steroids. 2015;99(Pt A):76–83.
- Tanner JM, Whitehouse RH. Clinical longitudinal standards for height, weight, height velocity, weight velocity, and stages of puberty. Arch Dis Child. 1976;51(3):170–179.
- Prader A. Testicular size: assessment and clinical importance. Triangle. 1966;7(6):240–243.
- Ankarberg-Lindgren C, Norjavaara E. Changes of diurnal rhythm and levels of total and free testosterone secretion from pre to late puberty in boys: testis size of 3 ml is a transition stage to puberty. Eur J Endocrinol. 2004;151(6):747–757.
- Armbruster DA, Pry T. Limit of blank, limit of detection and limit of quantitation. Clinical Biochem Rev. 2008;29(1):S49–S52.
- Kley HK, Schlaghecke R, Kruskemper HL. Stability of steroids in plasma over a 10-year period. J Clin Chem Clin Biochem. 1985;23:875–878.
- Ankarberg-Lindgren C, Norjavaara E. Twenty-four hours secretion pattern of serum estradiol in healthy prepubertal and pubertal boys as determined by a validated ultra-sensitive extraction RIA. BMC Endocr Disord. 2008;8(1):10.
- Ceglarek U, Werner M, Kortz L, et al. Preclinical challenges in steroid analysis of human samples. J Steroid Biochem Mol Biol. 2010;121(3-5):505–512.
- Meikle AW, Kushnir MM, Rockwood AL, et al. Adrenal steroid concentrations in children seven to seventeen years of age. J Pediatr Endocrinol Metab. 2007;20(12):1281–1291.
- Soeborg T, Frederiksen H, Mouritsen A, et al. Juul A: Sex, age, pubertal development and use of oral contraceptives in relation to serum concentrations of DHEA, DHEAS, 17alpha-hydroxyprogesterone, Delta4-androstenedione, testosterone and their ratios in children, adolescents and young adults. Clin Chim Acta. 2014;437:6–13.
- Greaves RF, Ho CS, Loh TP, on behalf of Working Group 3 “Harmonisation of Laboratory Assessment” European Cooperation in Science and Technology (COST) Action BM1303 “DSDnet”, et al. Working Group 3 “Harmonisation of Laboratory Assessment” European Cooperation in S, Technology Action BMD: Current state and recommendations for harmonization of serum/plasma 17-hydroxyprogesterone mass spectrometry methods. Clin Chem Lab Med. 2018;56(10):1685–1697.,
- Kulle AE, Welzel M, Holterhus PM, et al. Implementation of a liquid chromatography tandem mass spectrometry assay for eight adrenal C-21 steroids and pediatric reference data. Horm Res Paediatr. 2013;79(1):22–31.
- Kulle AE, Riepe FG, Melchior D, et al. A novel ultrapressure liquid chromatography tandem mass spectrometry method for the simultaneous determination of androstenedione, testosterone, and dihydrotestosterone in pediatric blood samples: age- and sex-specific reference data. J Clin Endocrinol Metab. 2010;95(5):2399–2409.
- Ankarberg C, Norjavaara E. Diurnal rhythm of testosterone secretion before and throughout puberty in healthy girls: correlation with 17beta-estradiol and dehydroepiandrosterone sulfate. J Clin Endocrinol Metab. 1999;84(3):975–984.
- Kulle AE, Reinehr T, Simic-Schleicher G, et al. Holterhus PM: Determination of 17OHPreg and DHEAS by LC-MS/MS: Impact of Age, Sex, Pubertal Stage, and BMI on the Delta5 Steroid Pathway. J Clin Endocrinol Metab. 2017;102(1):232–241.,
- Kushnir MM, Blamires T, Rockwood AL, et al. Liquid chromatography-tandem mass spectrometry assay for androstenedione, dehydroepiandrosterone, and testosterone with pediatric and adult reference intervals. Clin Chem. 2010;56(7):1138–1147.
- Rezvanpour A, Don-Wauchope AC. Clinical implications of estrone sulfate measurement in laboratory medicine. Crit Rev Clin Lab Sci. 2017;54(2):73–86.
- Soeborg T, Frederiksen H, Johannsen TH, et al. Isotope-dilution TurboFlow-LC-MS/MS method for simultaneous quantification of ten steroid metabolites in serum. Clin Chim Acta. 2017;468:180–186.
- Ismail AA, Barth JH. Endocrinology of gynaecomastia. Ann Clin Biochem. 2001;38(Pt 6):596–607.