
Abstract
Salivary mRNA biomarkers and serum carcinoembryonic antigen (CEA) have been recognized as promising liquid biopsy methods for detection of multiple cancers. However, current tests normally use solitary type of biomarkers, and are limited by unsatisfactory sensitivity and specificity when applied to differentiate cancer patients from healthy controls. In this study, a combined approach of CEA and salivary mRNA biomarkers was evaluated for discriminatory performance of ovarian cancer patients from healthy controls. We designed our study with two phases: a discovery phase to find and evaluate multiple biomarkers, and an independent validation phase to confirm the applicability of the selected biomarkers. In the discovery phase, a total of 140 ovarian cancer patients and 140 healthy controls were recruited. The CEA level in blood as well as five mRNA biomarkers in saliva (i.e. AGPAT1, B2M, BASP1, IER3 and IL1β) were measured, followed by developing a machine-learning model to differentiate ovarian cancer patients and healthy controls. We found a novel panel of biomarkers, which could differentiate ovarian cancer patients from healthy controls with high sensitivity (89.3%) and high specificity (82.9%). Next, we applied this panel of biomarkers in an independent validation study that consisted of 60 ovarian cancer patients and 60 healthy controls. The ovarian cancer patients were successfully differentiated from healthy controls in the validation phase, with sensitivity reaching 85.0% and specificity reaching 88.3%. To our best knowledge, it is the first time that a combined use of CEA and salivary mRNA biomarkers were applied for non-invasive detection of ovarian cancer.
Introduction
Ovarian cancer is the deadliest gynecological disease, and contributes to approximately 184,799 female deaths in the world in 2018 [Citation1,Citation2]. The primary reason for such high mortality is that ovarian cancer is asymptomatic in the early stage. As a result, 60% of the ovarian cancer cases are diagnosed when the malignancies have spread to distant organs, and the 5-year survival rate is only 29% in the late stage1. Traditional tests for ovarian cancer detection include transvaginal ultrasound and computed tomography scans [Citation3], which, however, are not efficient in lowering death rates caused by ovarian cancer. In addition, CA-125 is a common serum biomarker for advanced ovarian cancer (specificity >80%) [Citation4], but its sensitivity is not high enough for early detection of ovarian cancer [Citation5].
Recently, salivary mRNA biomarkers have been suggested as potential methods for non-invasive early detection of various cancers [Citation6–14]. For ovarian cancer, five salivary mRNAs (B2M, BASP1, AGPAT1, IL1β, and IER3) have been validated to discriminate ovarian cancer patients from healthy controls, with sensitivity of 85.7% and specificity of 91.4% [Citation10]. However, it is worth noting that this biomarker panel was developed and validated in a Korean Asian population [Citation10], and its performance in other populations remains largely unknown. Serum carcinoembryonic antigen (CEA) is another commonly-used biomarker for cancer recurrence detection, and response or progression in metastatic cancer in blood test [Citation15]. Although considered as a non-invasive prognostic cancer biomarker [Citation16], CEA is usually associated with high false positive rate and cannot discriminate cancer by itself [Citation17].
So far, most of the liquid biopsy studies on cancer detection were conducted by using either blood biomarkers such as CEA or salivary biomarkers such as mRNA biomarkers. This study aimed at exploring the potential of combining both blood biomarkers and salivary biomarkers to detect ovarian cancer. To this end, we designed our study with two phases: a discovery phase to find and evaluate biomarkers, and an independent validation phase to confirm the applicability of the selected biomarkers. We first collected the blood samples and saliva samples of 140 ovarian cancer patients and 140 healthy controls in the discovery phase, and systematically analyzed their CEA levels in blood and mRNA expression levels of AGPAT1, B2M, BASP1, IER3 and IL1β in saliva. We next built a machine-learning model that was trained with the measurement data to discriminate ovarian cancer patients from healthy controls. We found that our approach could successfully discriminate ovarian cancer patients from healthy controls with sensitivity and specificity reaching 89.3% and 82.9%, respectively. Next, we conducted an independent clinical validation phase. In this phase of study, CEA level in blood and mRNA levels of BASP1 and IER3 in saliva of 60 ovarian cancer patients and 60 healthy controls were measured. By applying our machine-learning algorithm that was previously trained, ovarian cancer patients and healthy controls were differentiated with high sensitivity (85.0%) and high specificity (88.3%). This study confirmed that the combined use of blood biomarkers and salivary biomarkers could improve the detection accuracy and presents a promising clinical approach as a non-invasive detection approach for ovarian cancer detection.
Materials and methods
Patient cohort
This study was approved by the institutional review board at Binzhou People's Hospital. In the discovery phase, we recruited totally 140 ovarian cancer patients and 140 ovarian cancer-negative people (i.e. healthy controls) between April 2nd, 2018 and December 3rd, 2018. In the independent clinical validation phase, we recruited totally 60 ovarian cancer patients and 60 ovarian cancer-negative people (i.e. healthy controls) between December 10th, 2018 and April 12th, 2019. All the patients and healthy controls were recruited from Binzhou People's Hospital (Binzhou, Shandong, China). Written informed consents and questionnaire data sheets were obtained from all patients who agreed to serve as blood and saliva donors. The information on patient characteristics, such as age and sex, is presented in for the discovery phase and clinical validation phase.
Table 1. Demographic information of all subjects used in this study.
Sample collection
In discovery phase, both un-stimulated whole saliva samples and whole peripheral blood samples were obtained by a standard procedure between 08:00 and 09:00 in the morning from ovarian cancer patients and healthy controls. All saliva samples (2 mL) were collect at least 1 h after the subjects were asked to refrain from eating, drinking, smoking, or oral hygiene procedures. Saliva samples were kept on ice during collection and were then centrifuged at 13,000 g for 10 min at 4 °C. For preservation of salivary RNA, the supernatant was removed from the pellet and treated with RNase inhibitor (Superase-In, Ambion Inc., Austin, TX) and stored at −80 °C prior to assay. All blood samples (2 mL) were collected using tubes without anti-coagulant for CEA analysis. Serum was separated in 30 min after collection, divided into four aliquots, and stored at −25 °C until assays. In the independent clinical validation phase, whole peripheral blood samples and un-stimulated whole saliva samples were blinded and randomized. Afterwards, the same procedure for mRNA and CEA analysis were performed.
Inclusion criteria of cancer patients consisted of a confirmed diagnosis of ovarian cancer via histology or cytology. Exclusion criteria of ovarian cancer patients included chemotherapy/radiotherapy within 1 month, a diagnosis of other malignancies within 5 years prior to saliva collection.
Analysis of RNA in saliva samples
We followed a protocol that was previously published for extracting salivary RNA [Citation12]. In brief, the supernatant of 330 µL saliva supernatant was used and processed. Extraction of saliva RNA was conducted by using RNeasy Protect Saliva Mini Kit (Qiagen, Germany) as instructed by the product manual. After extraction, RNA samples were stored at −80 °C and analyzed within 12 h of sample preparation. Extracted RNA was linearly amplified with TURBO DNase treatment. Quantitative real-time PCR (qPCR) analysis was conducted to detect the expression levels of selected genes in saliva samples. Amplification was performed using Roche LightCycler® 480 (Roche, Switzerland) in 20 µL reactions containing 2 µL cDNA, the primers (), the probe, and the reaction mix with qPCR. GAPDH was used as an internal control. The primers used in qPCR analysis were listed in . Raw Ct data was normalized by subtracting GAPDH Ct values from the biomarker Ct values to generate ΔCt. We next followed a reported method [Citation18] to calculate the relative gene expression in various saliva samples: Relative Gene Expression = 2 ∧ (−ΔCt) * K, where K was chosen as 1000 in our study.
Table 2. Primers used in this study.
Analysis of CEA level in blood samples
Blood specimens were obtained by a standard procedure between 08:00 and 09:00 in the morning. Serum was separated in 30 min after collection, divided into four aliquots, and stored at −25 °C until assays. CEA concentrations were determined by enzyme immunoassays using ARCHITECT CEA kit (Abbott, Ireland) and ARCHITECT i System (Abbott, Ireland) following the manual. Briefly, serum samples and anti-CEA coated paramagnetic microparticles were combined. CEA present in the sample bound to the anti-CEA coated microparticles. After washing, anti-CEA acridinium-labeled conjugate was added in the next step. Pre-Trigger and Trigger Solutions were then added to the reaction mixture; the resulting chemiluminescent reaction was measured as relative light units (RLUs). A direct relationship existed between the amount of CEA in the sample and the RLUs detected by the ARCHITECT i optical system.
Statistical analysis
Expression levels of candidate genes and CEA level were compared using the multiple t-test. We considered p < .05 as statistically significant. The receiver operating characteristic (ROC) curve and the area under the curve (AUC) value were calculated, using MedCalc software and MATLAB software.
Machine learning for sample classification
We selected decision tree algorithm as our machine learning classifier. We used the ‘fitctree’ and “predict” functions in Statistics and Machine Learning Toolbox as implemented in MATLABTM software to classify sample classes in the discovery phase. Ten rounds of 10-fold cross-validations were performed. After training the classifier, we then applied it to the datasets in the independent clinical validation phase, and used mRNA and CEA levels as the features for the classifier to predict the occurrence of ovarian cancer. The predicted classes of the 60 ovarian cancer patients and 60 healthy controls were listed in .
Table 3. Performance of different panels of mRNA biomarkers and CEA in the discovery phase and validation phase.
Results
Study design
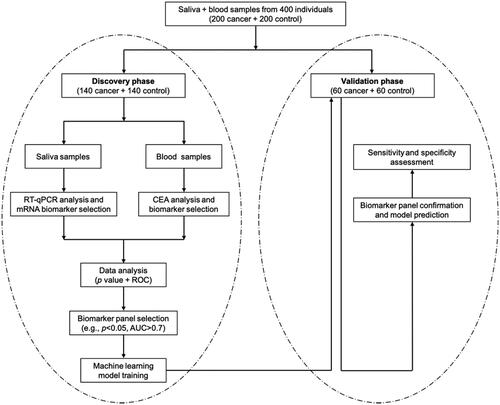
This study was consisted of a discovery phase and a subsequent clinical validation phase (). In the discovery phase, we measured the CEA level in blood and mRNA level of five candidate biomarker genes in saliva, and built a machine-learning model that used the CEA level and gene expression levels as input to predict the occurrence of ovarian cancer. In the following validation phase, we applied our trained model to a different set of subjects to evaluate its classification performance independently. In the discovery phase, we recruited 140 ovarian cancer patients and 140 healthy controls, and analyzed their CEA level in blood samples and expression levels of candidate genes in saliva samples. We also collected their clinical characteristics, such as age and sex (). We used these data to form a training dataset and applied a machine-learning model with 10-fold cross-validation to determine its sensitivity and specificity when being applied to discriminate ovarian cancer patients from healthy controls. We then conducted a blinded test with our model in the independent validation phase, in which we used the CEA and salivary gene expression levels to predict if a sample was from an ovarian cancer patient. Finally, we compared our predictions with pathological classification to evaluate the clinical performance of our method. Totally 60 ovarian cancer patients and 60 healthy controls were recruited in the validation phase.
Figure 1. Flowchart of the discovery phase and validation phase to detect ovarian cancer.
Analysis of gene expression levels and CEA levels
First, we measured five mRNAs biomarkers, i.e. AGPAT1, B2M, BASP1, IER3 and IL1β, in saliva samples of 140 ovarian cancer patients and 140 healthy controls in the discovery phase (). Four biomarkers, namely AGPAT1, BASP1, IER3 and IL1β, were significantly down-regulated in ovarian cancer patients (p < .05). Specifically, BASP1, and IER3 demonstrated 1.33-fold and 1.47-fold decreased expression in ovarian cancer patients (p < .001). No significant difference was observed for B2M expression between ovarian cancer patients and healthy controls (p = .07).
Figure 2. Comparison of RNA expression levels of five candiate genes in saliva samples and CEA levels in blood samples between healthy control group (blue) and ovarian cancer patient group (red) in the discovery phase. The healthy control group included 140 normal people; the ovarian cancer patient group included 140 patients. *indicates p < .05; **indicates p < .01; ***indicates p < .001; ns indicates p > .05.
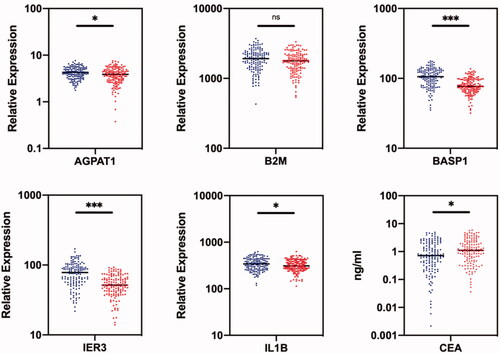
Next, the CEA levels of 140 ovarian cancer patients and 140 healthy controls were measured in the blood samples in the discovery phase. The mean CEA level was 1.17 ng/mL for healthy controls and 1.54 ng/mL for ovarian cancer patients (). The difference of the CEA level between healthy controls and ovarian cancer patients was significantly different (p < .05), indicating that CEA can act as a candidate biomarker to discriminate ovarian cancer patients from healthy controls.
Machine-learning model building and evaluation
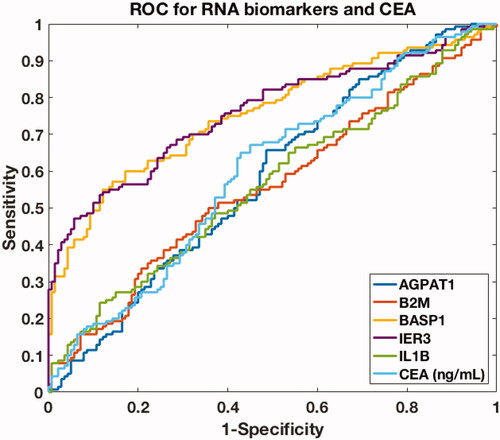
We then used a machine-learning model to predict ovarian cancer occurrence from clinical characteristics. We plotted receiver operating characteristic (ROC) curve for each candidate biomarker and calculated the area under curve (AUC) value (). In general, an AUC value that is larger than 0.70 suggests a decent performance for segregating clinical positives from negatives. BASP1 and IER3 were ranked as the top two biomarkers, with both AUC values reaching 0.76. The AUC value of CEA as well as the rest biomarkers in saliva was below 0.70, indicating unsatisfactory clinical performance when using these biomarkers alone for discriminating ovarian cancer patients and healthy controls.
Figure 3. ROC curves of single biomarkers (AGPAT1, B2M, BASP1, IER3, IL1β) in saliva and CEA level in blood in the discovery phase.
Next, we chose two biomarkers, BASP1 and IER3 as our design parameters. We used the pairwise data of the design parameters and the corresponding ovarian cancer occurrence to train a decision-tree algorithm. The model was constructed by following a toolkit developed in MATLABTM (i.e. “fitctree” and “predict” in Statistics and Machine Learning Toolbox), which automatically adjusted the nodes and connections of the decision tree to optimize the fitting [Citation19]. We found that our model could indeed discriminate ovarian cancer patients and healthy controls. The sensitivity and specificity for the combination of BASP1 and IER3 was 82.9% and 74.3% for ovarian cancer prediction ().
Finally, we added CEA in the machine-learning model to see if the prediction performance could be further improved (). We included CEA because it was commonly use in clinical applications, in spite of its low AUC value (0.60). We determined the mean accuracies by 10 iterations of 10-fold cross-validations for each case. We found that by including CEA, the sensitivity and specificity could be further improved to 89.3% and 82.9%. Considering the high sensitivity (89.3%) and high specificity (82.9%) of this three-biomarker panel, we decided to use these design parameters, i.e. CEA level in blood, and BASP1 and IER3 expression levels in saliva, in the machine-learning model for the subsequent clinical validation phase.
Validation with independent datasets
To find out if our machine-learning algorithm could be generally applied for ovarian cancer detection, we performed a validation study in an independent dataset. In this independent validation phase, we performed a blinded study of 60 ovarian cancer patients and 60 healthy controls (). We blindly collected the blood and saliva samples from the participants in the independent validation phase. The blood and saliva samples were collected from a total of 120 subjects, blinded, and analyzed for CEA levels and gene expression levels. The samples in the validation phase were stored and measured in a different batch from that of discovery phase.
We next used the machine-learning model that was trained in the discovery phase to predict if a sample from the validation phase was from an ovarian cancer patient. In total, we successfully predicted 53 out of 60 healthy controls, and 51 out of 60 ovarian cancer patients (). Our predictions highly matched with pathological classification, with sensitivity and specificity reaching 85.0% and 88.3% respectively (). Overall, our study discovered that a novel panel of mRNA and CEA could be applied in clinical diagnosis of ovarian cancer as a non-invasive method.
Discussion
We discovered that the combined analysis of gene expressions in saliva and CEA in blood could be complementary to the current use of single type of biomarkers to detect ovarian cancer. By combining mRNA and CEA analysis, we can extract more unique bio-signature of cancers from higher dimensions and thus increase both sensitivity and specificity. Combined analysis of multiple analysts for non-invasive detection of cancers is gradually becoming a consensus among researchers. For example, Cohen et al. recently developed CancerSEEK [Citation20], a blood test that analyzes ctDNA mutations and various protein biomarkers to detect multiple cancers such as ovarian, liver and lung cancer. Their method achieved 98% sensitivity and >99% specificity in detection of ovarian cancer in a group of 54 ovarian cancer patients that are consisted of mainly Caucasian people [Citation20]. In comparison, our combined analysis of RNAs and CEA led to sensitivity of 85.0% and specificity of 88.3% in a Chinese population. Future studies using larger and prospective cohorts of both Caucasian and Chinese Asian will help define the role of this approach in clinical practice.
The key of our method is using a data-driven, machine-learning modeling approach. Machine learning is advantageous than linear model in solving complex problems in two aspects: requiring no a priori knowledge of the system, and capable of resolving complex systems with high non-linearity and multi-dimensionality. Actually, the predictive power of machine learning is now being recognized by biologists, as we have witnessed multiple applications of using machine-learning models to analyze biomarkers from ctDNA [Citation21], ctRNA [Citation22], proteomics [Citation23,Citation24], and metabolomics [Citation25]. Most importantly, in addition of the use of machine-learning, we implemented an independent validation study to evaluate the practical use of our model. Such design is crucial as machine-learning models could face over-fitting problem, i.e. a model could over-fit training datasets but suffers low accuracy in other datasets. In this study, our model achieves equally good predictions between the training datasets and the validation datasets, suggesting no over-fitting during model development.
Several limitations of our study should be acknowledged. First, the patient cohort in our study was composed of subjects from China only. To discover the biomarkers that are universal for people of all ethnicities, we might need to collect samples from other races (e.g. Caucasian) or include data from previous work that are based on other races. Second, we derived our biomarker panel from the biomarkers suggested by Lee et al. (BASP1 and IER3) [Citation10] to detect ovarian cancer in China. Both biomarkers were discovered from a database that is primarily Korean people, rather than Chinese people. As a result, some region-specific biomarkers that are particularly good for Chinese people might be missing. For example, BASP2, BRCA1, BRCA2, BRIP1, EPCAM, MLH1, MSH2, MSH6, PALB2, PMS2, STK11 and TP53 are potential candidates, because they are classical driver genes for ovarian cancer [Citation10,Citation26–35]. We are currently conducting a large-scale clinical test to confirm their discriminatory power of in the Chinese population. It is also worth noticing that the feature selection process used in this study is not entirely data-driven. For example, we included CEA level in our model although its AUC value was low and might not be used as a feature based on machine learning analysis. The reason we included CEA level is that it is commonly used in blood test and has great value in real-world clinical applications. The integration of domain knowledge with machine learning model is important for converting analytical data into clinical insights, which represents an applicable and non-invasive method for lung cancer detection in this study.
In sum, our study proves that combining salivary mRNA biomarkers and serum CEA biomarker can achieve non-invasive detection of ovarian cancer in a Chinese population. In future, we plan to endeavor our efforts into detection of multiple cancers, and also evaluate the clinical utility of our study in a large population. We expect our method, together with other liquid biopsies, will eventually provide early, painless, and affordable test for many cancers.
Acknowledgements
The authors thank Binzhou People's Hospital for funding support.
Disclosure statement
No potential conflict of interest was reported by the author(s).
References
- Bray F, Ferlay J, Soerjomataram I, et al. Global cancer statistics 2018: Globocan estimates of incidence and mortality worldwide for 36 cancers in 185 countries. CA Cancer J Clin. 2018;68(6):394–424.
- Kandalaft LE, Motz GT, Duraiswamy J, et al. Tumor immune surveillance and ovarian cancer: lessons on immune mediated tumor rejection or tolerance. Cancer Metastasis Rev. 2011;30(1):141–151.,
- Fleischer A, Javitt M, Jeffrey R, et al. Clinical gynecologic imaging. Philadelphia: Lippincott Williams & Wilkins; 1997.
- Jacobs I, Bast Jr RC. The CA 125 tumour-associated antigen: a review of the literature. Hum Reprod. 1989;4(1):1–12.
- Bast RC. Early detection of ovarian cancer: new technologies in pursuit of a disease that is neither common nor rare. Trans Am Clin Climatol Assoc. 2004;115:233–248.
- Park NJ, Zhou H, Elashoff D, et al. Salivary microrna: discovery, characterization, and clinical utility for oral cancer detection. Clin Cancer Res. 2009;15(17):5473–5477.
- Li Y, John MAS, Zhou X, et al. Salivary transcriptome diagnostics for oral cancer detection. Clin Cancer Res. 2004;10(24):8442–8450.,
- Gleber-Netto FO, Yakob M, Li F, et al. Salivary biomarkers for detection of oral squamous cell carcinoma in a Taiwanese population. Clin Cancer Res. 2016;22(13):3340–3347.
- Brinkmann O, Kastratovic DA, Dimitrijevic MV, et al. Oral squamous cell carcinoma detection by salivary biomarkers in a serbian population. Oral Oncol. 2011;47(1):51–55.
- Lee Y-H, Kim JH, Zhou H, et al. Salivary transcriptomic biomarkers for detection of ovarian cancer: for serous papillary adenocarcinoma. J Mol Med (Berl). 2012;90(4):427–434.
- Zhang L, Xiao H, Karlan S, et al. Discovery and preclinical validation of salivary transcriptomic and proteomic biomarkers for the non-invasive detection of breast cancer. PLoS One. 2010;5(12):e15573.
- Zhang L, Xiao H, Zhou H, et al. Development of transcriptomic biomarker signature in human saliva to detect lung cancer. Cell Mol Life Sci. 2012;69(19):3341–3350.
- Li F, Yoshizawa JM, Kim K-M, et al. Discovery and validation of salivary extracellular rna biomarkers for noninvasive detection of gastric cancer. Clin Chem. 2018;64(10):1513–1521.
- Zhang L, Farrell JJ, Zhou H, et al. Salivary transcriptomic biomarkers for detection of resectable pancreatic cancer. Gastroenterology. 2010;138(3):949.e1-7–957.e1-7.
- Henry NL, Hayes DF. Cancer biomarkers. Mol Oncol. 2012;6(2):140–146.
- Wielders J, Bartels C, Bank C, et al. The diagnostic value of neuron-specific enolase and carcino-embryonic antigen analyses in patients with carcinoma of the lung. J Clin Chem Clin Biochem. 1990;28(4):225–231.
- Litvak A, Cercek A, Segal N, et al. False-positive elevations of carcinoembryonic antigen in patients with a history of resected colorectal cancer. J Natl Compr Canc Netw. 2014;12(6):907–913.
- Ishiba T, Hoffmann A-C, Usher J, et al. Frequencies and expression levels of programmed death ligand 1 (pd-l1) in circulating tumor rna (ctrna) in various cancer types. Biochem Biophys Res Commun. 2018;500(3):621–625.
- Documentation M. Matlab r2014b fitctree; 2015. Available from: http://es.mathworks.com/help/stats/fitctree.html.
- Cohen JD, Li L, Wang Y, et al. Detection and localization of surgically resectable cancers with a multi-analyte blood test. Science. 2018;359:eaar3247.
- Chen X, Wang X, He H, et al. Combination of circulating tumor cells with serum carcinoembryonic antigen enhances clinical prediction of non-small cell lung cancer. PLoS One. 2015;10(5):e0126276.
- Danaee P, Ghaeini R, DA H. A deep learning approach for cancer detection and relevant gene identification. Pac Symp Biocomput. 2016;22:219–229.
- Kourou K, Exarchos TP, Exarchos KP, et al. Machine learning applications in cancer prognosis and prediction. Comput Struct Biotechnol J. 2015;13:8–17.
- Saghapour E, Kermani S, Sehhati M. A novel feature ranking method for prediction of cancer stages using proteomics data. PLoS One. 2017;12(9):e0184203
- Alakwaa FM, Chaudhary K, Garmire LX. Deep learning accurately predicts estrogen receptor status in breast cancer metabolomics data. J Proteome Res. 2018;17(1):337–347.
- Lakhani SR, Manek S, Penault-Llorca F, et al. Pathology of ovarian cancers in brca1 and brca2 carriers. Clin Cancer Res. 2004;10(7):2473–2481.
- Ramus SJ, Gayther SA. The contribution of brca1 and brca2 to ovarian cancer. Mol Oncol. 2009;3(2):138–150.
- Rafnar T, Gudbjartsson DF, Sulem P, et al. Mutations in brip1 confer high risk of ovarian cancer. Nat Genet. 2011;43(11):1104–1107.,
- Taylor DD, Gercel-Taylor C. Microrna signatures of tumor-derived exosomes as diagnostic biomarkers of ovarian cancer. Gynecol Oncol. 2008;110(1):13–21.
- Samimi G, Fink D, Varki NM, et al. Analysis of mlh1 and msh2 expression in ovarian cancer before and after platinum drug-based chemotherapy. Clin Cancer Res. 2000;6(4):1415–1421.
- Bonadona V, Bonaïti B, Olschwang S, et al. Cancer risks associated with germline mutations in mlh1, msh2, and msh6 genes in lynch syndrome. JAMA. 2011;305(22):2304–2310.
- Lum CT, Sun RW-Y, Zou T, et al. Gold (iii) complexes inhibit growth of cisplatin-resistant ovarian cancer in association with upregulation of proapoptotic pms2 gene. Chem Sci. 2014;5(4):1579–1584.,
- Wang Z, Churchman M, Campbell I, et al. Allele loss and mutation screen at the peutz-jeghers (lkb1) locus (19p13.3) in sporadic ovarian tumours. Br J Cancer. 1999;80(1–2):70–72.
- Perets R, Wyant GA, Muto KW, et al. Transformation of the fallopian tube secretory epithelium leads to high-grade serous ovarian cancer in brca;tp53;pten models. Cancer Cell. 2013;24(6):751–765.
- Ahmed AA, Etemadmoghadam D, Temple J, et al. Driver mutations in tp53 are ubiquitous in high grade serous carcinoma of the ovary. J Pathol. 2010;221(1):49–56.