
Abstract
All immunological methods are vulnerable to different kinds of interference. The purpose of this work was to study the cause and frequency of method-dependent interference in the Roche thyroid immunoassays. Serum samples with discordant thyroid function tests (TFT) were selected from samples sent to the Hormone Laboratory, Oslo University Hospital from June 2013 to September 2018. We identified 93 patients with discordant pathological TFT when analysed with the Roche methods and normal results when analysed with alternative methods. 42 of these samples were sent to Roche Diagnostics (Germany) for investigation of the interfering substance. Roche found interference to be caused by the presence of endogenous anti-streptavidin antibodies (ASA) (34 of 42 patients), ruthenium or the idiotype of the ruthenium labelled antibody (3 of 42 patients) and mouse antigens (1 of 42 patients). Method-dependent interference was estimated to affect 0.37% of the patients investigated in our laboratory. Interference due to the presence of endogenous ASA were further explored in other (non-thyroid) immunoassays by comparing analyte levels before and after pre-adsorption of the patients’ sera with streptavidin-coated paramagnetic beads. An underestimation of hormone levels was observed in sandwich immunoassays, while an overestimation was found in competitive assays. Method-dependent interference in Roche thyroid immunoassays is caused mainly by ASA and is not a very rare phenomenon. Misleading results may lead to misdiagnosis and inappropriate medical treatment. The supplier of the assay should be alerted when the available alternative methodology reveals method-dependent errors.
Introduction
Immunological methods are widely used to diagnose thyroid malfunction. However, they are vulnerable to different kinds of interference with falsely increased or decreased results [Citation1,Citation2].
Streptavidin and Biotin (Vitamin B7, also termed Vitamin B8) are the main assay components in many immunoassay platforms [Citation3]. In all the Roche immunoassays, streptavidin and biotin are used to connect the immunocomplex to a solid phase, while ruthenium is used as a signal substance. The presence of anti-streptavidin antibodies (ASA) in a patient's serum and/or recent biotin-treatment may give falsely elevated hormone levels in competitive assays, free thyroxine (FT4), free triiodothyronine (FT3), thyrotropin receptor antibody (TRAb) and anti-thyroid peroxidase antibodies (anti-TPO) and falsely decreased levels in thyroid-stimulating hormone (TSH), a sandwich assay [Citation4,Citation5]. The sandwich assay is theoretically less vulnerable because antibody reagents are in excess, which is not the case in the competitive assay format [Citation3]. Other well-known interferences include antibodies against ruthenium and human anti-mouse antibodies (HAMA) [Citation6–9].
The protein streptavidin is extracted from the soil-bacterium Streptomyces avidinii. The circumstances that lead to immunisation against streptavidin in humans are unknown [Citation10]. A continuum of ASA IgM reactivity is found in the general population. It is hypothesized that since many people are exposed to these soil bacteria in their outdoor activities they may develop an immunological reaction to it [Citation11].
Biotin may interfere if the daily intake exceeds five milligrams and, depending on the dosage if the time interval between medication and sampling is too short [Citation4,Citation5,Citation12]. Biotin tablets in doses up to 10 mg per tablet are recommended by health food promoters against dry skin and nails and for better hair growth. Biotin doses from 5–10 mg/kg a day are used to treat inborn metabolic diseases. High-dose biotin, 100–300 mg a day, is tentatively used to improve the quality of life and delay the progression of multiple sclerosis [Citation3,Citation12–14]. Ruthenium, a rare transition metal element, is used in alloys, as an oxidant in the dying process of clothes, and to produce wear-resistant electrical contacts and thick film resistors [Citation15,Citation16].
Despite the knowledge of method-dependent interfering substances, the extent of this problem is still unknown. We performed this study to compare discordant results from the Roche thyroid assays with alternative methods and to investigate the causes of the interference in these samples. We also studied how ASA would affect the results from other streptavidin-utilizing assays.
Material and methods
Study population
The Hormone Laboratory, Oslo University Hospital performs about 16,000 TSH, 16,000 FT4, 11,000 FT3, 9000 Anti-TPO and 12,000 TRAb tests each year. The samples are received from the thyroid outpatient clinic at Oslo University Hospital and from general practitioners in the Oslo area. We also receive samples for alternative method re-testing of discordant thyroid function tests (TFT) from other regions in Norway comprising four million inhabitants. Interference was suspected either because of discordance between TFT in a patient sample or because of disagreement between biochemical results and the symptoms of the patient. Serum samples with discordant TFT were collected from samples sent to the Hormone Laboratory from June 2013 to September 2018. Through searches in our laboratory data system from February 2016 to September 2018 we also gathered data on samples which on the same day had elevated FT3 values with the Roche method but normal FT4 and TSH with the DELFIA method, which is used at the Hormone laboratory. Data on TSH (v1) and FT4 II – concentrations analysed on the same day with the Roche method were collected by contacting the local hospital laboratories.
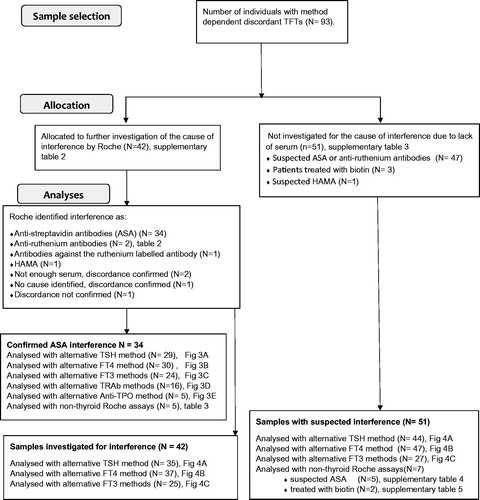
Samples with discordant TFT when analysed with the Roche method, but with normal results when analysed with alternative methods, were successively stored at −20 °C. If enough serum was available, samples were sent to the Roche Laboratories, Penzberg, Germany to elucidate the cause of the interference. Details on sample and analysis flow are presented in .
Figure 1. Flowchart showing included samples, number of samples allocated for investigation of cause of interference and number of samples analysed with alternative methods. TFT: thyroid function tests; HAMA: human anti-mouse antibodies; ASA: anti-streptavidin antibodies.
Laboratory methods
Routine hormone measurements were performed in our laboratory using commercially available immunoassays. Dissociation enhanced lanthanide fluorescence immunoassay (DELFIA, Perkin Elmer) was used for the determination of serum TSH (reference range, RR: 0.5–3.6 mIU/L), FT4 (RR: 8.0–21.0 pmol/L) and until February 2016 for determination of FT3 (RR: 3.5–8.3 pmol/L). Anti-TPO (RR: <35 kIU/L) was assayed by IMMULITE 2000 XPI chemiluminescent immunoassay (Siemens Healthineers). Electrochemiluminescence (ECLIA) immunoassay (Modular E170 and Cobas e601, Roche Diagnostics) was used for the determination of TRAb until September 2018, (RR: <1.8 IU/L), and for FT3 from February 2016 (RR: 2.8–7.0 pmol/L). The laboratory had available IMMULITE 2000 XPI as an alternative method for measurement of TSH (RR: 0.4–4.0 mIU/L), FT4 (RR: 11.4–22.7 pmol/L) and FT3 (RR: 2.8–6.5 pmol/L). Brahms TRAb radio-immunoassay (RIA, Thermo Fisher Scientific, RR: <1.5 IU/L) was used as an alternative to Roche’s TRAb method until February 2016, when we changed to IMMULITE thyroid-stimulating immunoglobulin (TSI, RR: <0.55 IU/L). The Hormone laboratory has established that the Roche method gave on average 19.4% higher concentrations of TSH than the DELFIA method. For elevated concentrations of FT4, the Roche method measured approximately 20–25% higher FT4 concentrations than the DELFIA method. For FT3 the Roche method measured 12% lower than the DELFIA and 11.9% higher than the Immulite method. Method comparison data between immunoassay platforms for TSH, FT4 and FT3, is presented in .
Table 1. Comparison of Roche TFT immunoassays with alternative methodology.
Forty (60%) of the hospital-laboratories in Norway use Roche Diagnostics analysers for thyroid assay measurements. None of the hospitals use the Cobas e411platform for TFT, a platform that previously has been reported to be less susceptible to ASA [Citation17]. The Roche TSH, FT4 and Anti-TPO assay results referred to in this study were measured with the Roche ECLIA methods at local hospitals. Most of the Roche FT3 and TRAb results were measured at the Hormone Laboratory. The Roche assay reference ranges referred to in the tables in this study are defined by Roche Diagnostics as the expected serum values [Citation18].
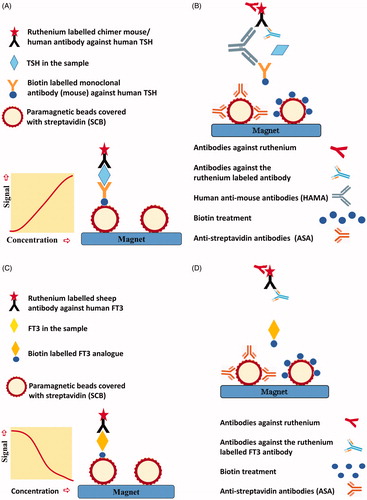
depicts the Roche TSH ECLIA sandwich method and the sites of possible method dependent interference. The Roche FT4, FT3, Anti-TPO and TRAb are competitive assays. depicts the Roche FT3 method and the sites of possible method-dependent interference [Citation3].
Figure 2. (A) Roche TSH sandwich assay, simplified. Biotin labelled monoclonal antibody from mouse against human TSH and ruthenium-labelled chimer mouse/human antibody against human TSH form an immune complex with TSH in the patient sample. Streptavidin coated paramagnetic beads (SCB) bind the biotinylated immune complex and attach to a magnet. After a washing procedure, tripropylamine (TPA) is added. TPA emits electrons. Ruthenium is excited and emits photons. The chemiluminescence signal will be proportional to the TSH level in the serum sample. (B) Possible method-dependent interference in the TSH assay. Antibodies against ruthenium or the ruthenium labelled antibody may either decrease or enhance chemiluminescent signal and lead to a false decreased or elevated TSH result. Human antibodies against mice (HAMA) may make a bridge between the two mouse-derived antibodies in the assay and thereby enhance the chemiluminescent signal and lead to a false elevated TSH result. HAMA in high titers may block the formation of an immune complex with TSH, and lead to a false reduced TSH result. Biotin treatment or endogenous antibodies against streptavidin (ASA) in the sample may prevent the binding of the biotinylated immune complex to the streptavidin coated paramagnetic beads. The decreased chemiluminescent signal will lead to a falsely reduced TSH result. (C) Roche competitive FT3 method, simplified. FT3 in the patient sample and biotin labelled FT3 analog compete for ruthenium labelled sheep antibody against human FT3. SCB bind biotin labelled FT3 analog and attach to a magnet. After a washing procedure, tripropylamine (TPA) is added. TPA emits electrons. Ruthenium is excited and emits photons. The chemiluminescence signal will be inversely proportional to the FT3 level in the serum sample. (D) Possible method-dependent interference in the FT3 assay. Antibodies against ruthenium or the ruthenium labelled antibody may either decrease or enhance chemiluminescent signal and lead to a false elevated or decreased FT3 result. Biotin treatment or endogenous ASA in the sample may prevent the binding of biotin labelled FT3 analogue to SCB. The decreased chemiluminescent signal will lead to a false elevated FT3 result.
Incubation of patient sera with streptavidin-coated paramagnetic beads (SCB) was performed as described previously [19–21]. 500 µL of patient sera was spiked with 10 µL of serum sample containing high concentrations of troponin T and 10 µL of serum sample containing a high concentration of N-terminal pro-brain natriuretic peptide (NTproBNP). Modular E170, Cobas e601 and Cobas e602 platforms, Roche Diagnostics were used to analyse the samples before and after pre-adsorption to SCB. According to the investigation of three control sera (Supplementary Table 1), interference was considered present if a difference of ≥20% from initial concentration was observed after incubation with SCB.
Statistics
Values obtained by the Roche method were adjusted for method-dependent differences according to the Passing–Bablok regression equations listed in . Concentrations outside the measuring range were set to the measuring limit value. The normality of distributions was assessed using D’Agostino–Pearson test. Pearson correlation, Passing–Bablok regression, Bland–Altman plot and Wilcoxon test for paired samples was performed using MedCalc Version 18.11.3 (MedCalc Software, Ltd., Belgium) and the medians were used to compare measured concentrations between methods. A difference between the median results was considered significant if p < .05.
Ethics
The study protocol was approved by the Data Protection Officer at Oslo University Hospital. Regional Committees for Medical and Health Research Ethics (REK) were consulted regarding the ethical permission for this study. No such approval was deemed necessary. Concerning the three case presentations, patient consent was obtained for publication.
Results
The first sample with falsely elevated FT4, FT3, Anti TPO and TRAb analysed with the Roche method was detected by the Hormone laboratory in June 2013. Until September 2018 a total of 93 samples with probable method-dependent errors were registered. Of these, 33 cases were found before 2017, 38 cases were found in 2017 and from January to September 2018 we discovered 22 additional samples from different patients with possible method-dependent interference.
Cause of interference in 42 samples sent for further investigation
Among the 93 samples with suspected assay interference in the Roche thyroid methods, 42 samples were sent to Roche Diagnostics for further testing (Supplementary Table 2). In the 42 investigated samples, the cause of interference was found to be ASA in 34 samples (80%) while one sample had HAMA giving falsely elevated TRAb and three samples had antibodies against ruthenium or the ruthenium labelled FT3 antibody (). Two samples were confirmed discordant but did not have enough serum for further investigation, one was not confirmed discordant and in one no specific interfering substance was identified. The 34 ASA positive samples were analysed for different TFT with alternative methods. In the 34 ASA positive samples TSH, which is analysed by a non-competitive assay format (sandwich assay), the Roche method showed decreased levels in 27 of 29 samples compared to the DELFIA method. Three results were erroneously normal with the Roche method but above the TSH reference range with the DELFIA method. The difference between the median TSH concentration measured by the DELFIA and the Roche method was 0.88 mIU/L (95% confidence interval (CI) 0.57–1.33, p < .0001. n = 29). For the competitive assays (FT4, FT3, TRAb and Anti-TPO) the Roche method showed consistently increased levels compared to the alternative methods in the ASA positive samples ().
Figure 3. Individual patient concentrations from the 34 samples with confirmed endogenous anti-streptavidin antibodies. Both the Roche method and alternative methods were used in 29 TSH, 30 FT4 and 24 FT3, 15 TRAb and five Anti-TPO samples. Concentrations above and below the measuring limits were given the measuring limit values. TSH, FT4 and FT3 values obtained by the Roche method were adjusted for method dependent differences according to the equations listed in . (A) Median TSH in the 29 samples was 1.03 mIU/L (range 0.07–64.20) with the Roche method and 1.84 mIU/L (range <0.03 to >100) with the DELFIA method. (B) Median FT4 in the 30 samples was 30.8 pmol/L (range 13.4 to >78.8) with the Roche method and 13.9 pmol/L (range 6.2–26.0) with the DELFIA method. (C) Median FT3 in the 24 samples was 10.5 pmol/L (range 6.5–18.2) with the Roche method and 6.0 pmol/L (range 3.5–9.6) with the alternative methods. (D, E) Fifteen TRab results and five Anti-TPO results analysed to be positive with the Roche method, were negative when analysed with alternative methods. RR: reference range; *results above or below the measuring limit.
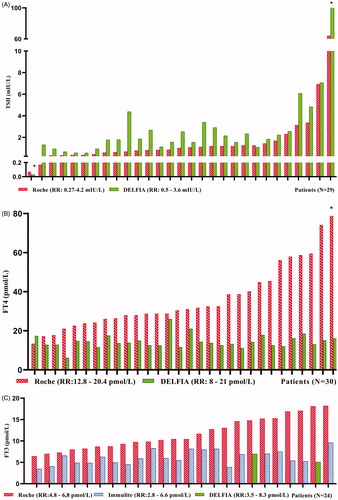
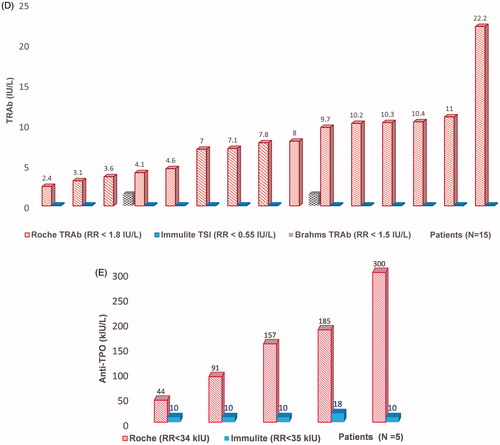
Table 2. Sera with confirmed interference to ruthenium or the ruthenium labeled FT3 antibody.
The difference in concentrations between the median FT4 result measured by the Roche and the DELFIA method was 19.5 pmol/L (95% CI 14.3–27.3, p < .0001. n = 30). For FT3 measured by the Roche and the alternative methods (DELFIA and Immulite) the difference between medians was 5.5 pmol/L (95% CI 3.8–7.0, p < .0001. n = 24). In the ASA positive samples, analyses with alternative methods were performed in 15 positive TRAb samples and five positive Anti-TPO samples with a negative result.
Comparison of TFT in samples with investigated and suspected interference
Due to a lack of specimens, 51 samples were not sent to Roche Diagnostics for further testing (Supplementary Table 3). In one sample falsely elevated TSH was probably caused by HAMA, and three patients had used biotin prior to sampling. In the remaining 47 samples, we had no clinical information to elucidate the cause of the method-dependent interference. We wanted to investigate whether the 51 samples with suspected method dependent interference showed similar altered results as the 42 investigated samples did when analysed with the alternative methods. We, therefore, compared differences in median concentrations for TSH, FT4, and FT3 between the 42 and the 51 sample-set and found similar median differences between the Roche method and alternative methods in both sample sets ().
Figure 4. Comparison of results from the Roche method and alternative methods in the 42-sample set sent to Roche Diagnostics for further investigation and in the 51-sample set not investigated for the source of interference. Concentrations above and below the detection limit were given the detection limit values. Values obtained by the Roche method were adjusted for method dependent differences according to the equations listed in . Median, 25 and 75 percentiles and 95% confidence intervals are shown. (A) TSH. 42-sample set: 35 TSH samples measured with Roche and DELFIA method, median TSH Roche concentration was 1.03 mIU/L (range 0.07–64.20), median TSH DELFIA concentration was 1.86 mIU/L (range <0.03 to >100). 51-sample set: 44 TSH samples measured with both methods, median Roche concentration was 1.12 (range 0.08–78.46), median DELFIA concentration was 1.86 mIU/L (range 0.32–10.70). Y-axis uses logarithmic scale. (B) FT4. 42-sample-set: 37 FT4 samples measured with Roche and DELFIA method, median FT4 Roche concentration was 28.8 pmol/L (range 5.7 to >78.8), median FT4 DELFIA concentration was 14.1 pmol/L (range 6.2–26.0). 51-sample set: 47 FT4 measured with both methods, median FT4 Roche concentration was 28.0 pmol/L (range 14.9 to >78.8), median FT4 DELFIA concentration was 14.6 pmol/L (range 10.6–33.4). (C) FT3. 42-sample set: 25 FT3 samples measured with Roche and alternative method, median FT3 Roche concentration was 10.5 pmol/L (range <1.9 to >39.2), median FT3 concentration with alternative methods was 6.3 pmol/L (range 3.9–9.6). 51-sample set: 27 FT3 measured with two methods, median FT3 Roche concentration was 8.4 pmol/L (range 5.4–14.9), median FT3 with alternative methods was 5.9 pmol/L (range 2.5–7.5).
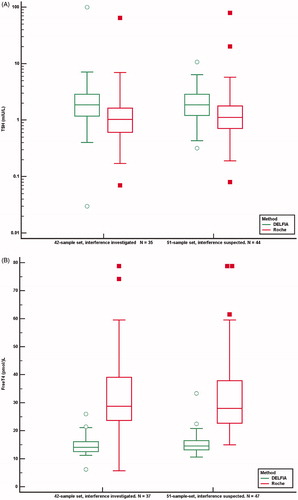
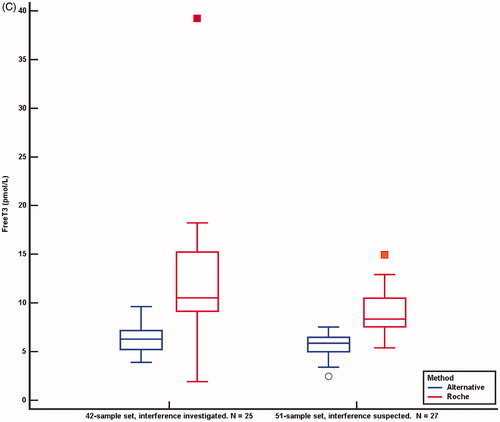
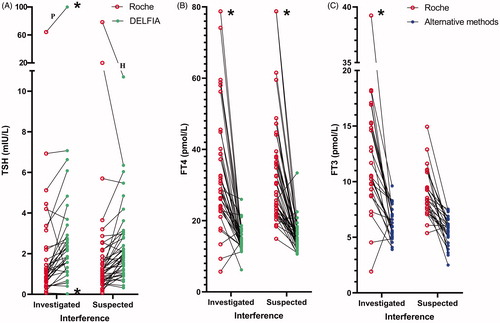
The difference between the TSH median concentrations measured by the two methods for the 42-sample set was 0.85 mIU/L (95% CI 0.57–1.21, p < .0001. n = 35) and for the 51-sample set it was 0.57 mIU/L (95% CI 0.34–0.84, p = .0001. n = 44). The difference between the FT4 median concentrations measured by the two methods for 42-sample set was 16.6 pmol/L (95% CI 12.1–23.0, p < .0001. n = 37) and for the 51-sample set it was 15.3 pmol/L (95% CI 11.9–19.8, p < .0001. n = 47). The difference between FT3 median concentrations measured by the Roche method and alternative methods for the 42-sample set was 5.7 pmol/L (95% CI 3.7–7.8, p = .0001. n = 25) and in the 51-sample set, it was 3.2 pmol/L (95% CI 2.3–4.4 p < .0001. n = 27). shows paired comparisons of concentrations of TSH, FT4 and FT3 by the Roche method and alternative methods for the 42 and the 51-sample set.
Figure 5. TSH (A), FT4 (B) and FT3 (C) concentrations analysed by the Roche method and alternative methods in 42 samples investigated for the cause of interference and in 51 samples suspected of method dependent interference. Concentrations above and below the measuring limits were given the measuring limit values. Values obtained by the Roche method were adjusted for method dependent differences according to the equations listed in . *Results above and below the measuring limit. P: patient treated with carbimazol; H: interference probably due to HAMA.
Incubation with SCB
We studied how pre-adsorption with SCB affected the results in other Roche assays in five samples with confirmed ASA. Competitive assays, estradiol, cortisol and progesterone showed reduced concentrations after pre-adsorption with SCB in the presence of ASA in the patients’ sera. In sandwich assays, anti-Müllerian hormone, c-peptide, n-terminal propeptide of type 1 collagen, parathyroid hormone and troponin T showed the opposite trend (). A similar trend was also observed when sera from five patients with suspected ASA interference were subject to the same pre-treatment. After incubation with SCB, we found reduced concentrations of cortisol and testosterone and increased concentrations of c-peptide, follicle-stimulating hormone, luteinizing hormone, parathyroid hormone and troponin T (Supplementary Table 4). Sera from two patients treated with high dose biotin prior to sampling showed reduced concentrations of FT4, FT3, cortisol and 25(OH)VitD and increased concentrations of anti-Müllerian hormone, follicle-stimulating hormone, luteinizing hormone, prolactin, parathyroid hormone and N-terminal propeptide of type 1 collagen after pre-adsorption with SCB (Supplementary Table 5).
Table 3. Sera with confirmed ASA before and after incubation with SCB.
Cases
A 3-year-old girl with recurrent episodes of fever and listlessness was diagnosed with hyperthyroidism. Analysis with the Roche method at the local hospital disclosed TSH: 0.55 mIU/L, FT4: 34 pmol/L, FT3: 12.6 pmol/L and TRAb: 12 IU/L. (RR: children 1–6 years: TSH: 0.70–5.97 mIU/L, FT4: 12.3–22.8 pmol/L, FT3: 3.69–8.46 pmol/L, TRAb < 1.8 IU/L) [Citation18]. The girl was treated with carbimazole but TSH and FT4 levels were volatile with spikes in concentrations above the detection limit. TFT after 2 years of treatment showed TSH: 77 mIU/L, FT4: 25 pmol/L, FT3: 21.1 pmol/L and TRAb: 7.1 IU/L. Confirmatory tests in the same sample with alternative methods revealed TSH > 100 (RR: 0.70–6.00) mIU/L, FT4: 6.2 (RR: 11–19) pmol/L, FT3: 8.2 (RR: 5.7–10.1) pmol/L and TSI < 0.10 (RR: <0.55) IU/L. Roche diagnostics investigated the sample and identified ASA. The treatment was stopped, and the girl did not develop symptoms of thyroid disease.
A 39-year old woman was overtreated with thyroxine to suppress the thyrotrophic effect of TSH on her metastatic thyroid cancer. Medication with 125 µg levothyroxine daily had kept TSH suppressed and FT4 slightly above the reference limit for some years. Unexpectedly she presented with elevated FT4: 54 pmol/L and her oncologists lowered her levothyroxine-medication. A repeat assay after three months showed discordant TFT with normal TSH: 1.2 mIU/L and elevated FT4: 30 pmol/L. The DELFIA method disclosed normal FT4:16.4 pmol/L in the same sample. Her serum was investigated by Roche Diagnostics and contained ASA.
The case of an 86-year old woman was presented at a meeting with the nuclear medical ward. She had a small colloid goiter and hyperthyroidism and had been treated three times with radioiodine at 6-month intervals with 300 MBq, 350 MBq and 700 MBq 131 Iodine, respectively. Measured with the Roche method her TFT values were still aberrant with normal TSH: 2.4 mIU/L but with elevated FT4: 33 pmol/L, FT3: 11.7 pmol/L and TRAb: 3.1 IU/L. Interference was suspected, and a new sample measured with alternative methods showed normal FT4, FT3 and TSI concentrations. By checking her previous blood test results in our laboratory data system, we discovered that her general practitioner, one month prior to her first radioiodine treatment, had sent a sample for confirmatory testing to the Hormone laboratory. This sample revealed normal TFT with the DELFIA method but elevated FT4: 53 pmol/L measured with the Roche method. Unfortunately, these results were not registered by the treating hospital clinician. The woman has later developed hypothyroidism and is being treated with levothyroxine.
A serum sample from the patient was incubated with residual SCB used in the Roche immunoassays [Citation19–21]. Assays were performed before and after the incubation and FT3 fell from 8.62 to 4.4 pmol/L (49%). The patient did not use biotin. We assume that the most probable interfering agent, anti-Streptavidin antibodies, was removed via adsorption to the SCB.
Discussion
This study has identified ASA as the main source of method-dependent interference in the thyroid function tests analysed by the Roche assays in the Norwegian population. Biotin interference has gained much attention [Citation12,Citation13,Citation22–25], while interference caused by anti-streptavidin antibodies may be under-communicated. ASA are more difficult to detect as the patient’s medication cannot reveal the nature of the interference. Making an exact estimate of the frequency of method-dependent interference in the general population is not possible based on results from a laboratory used as a second opinion laboratory. The frequency of biotin interference among the 93 discordant samples was as low as 3.2%. Among the 93 discordant samples, we found 39 erroneous FT3 results from January 2017 until September 2018. In the same period, we analysed 17,947 FT3 tests from 10,516 patients. It seems likely that method dependent interference occurs in about 0.37% of the patients tested. Since we found ASA in about 80% of the 42 investigated samples it is reasonable to assume an approximately similar proportion of ASA in the 39 erroneous FT3 samples.
According to the kit insert; ‘In rare cases, interference due to extremely high titers of antibodies to analyte-specific antibodies, streptavidin or ruthenium can occur’ [Citation4]. Contrary to this we found that ASA are not a very rare phenomenon.
To our knowledge, nine reports describing twelve cases with ASA interference in the Roche thyroid immunoassays have previously been published [Citation11,Citation17,Citation26–32]. IgM anti-streptavidin antibodies have been previously described to affect TFT in four patients [Citation11,Citation29] while IgG anti-streptavidin antibody interference in anti-cyclic citrullinated peptide has been reported in eight of 1375 samples (0.6%) [Citation10].
In the data presented here the median differences for TSH, FT4 and FT3-concentrations between the Roche method and the alternative methods were significant both in the investigated 42-sample set and in the 51-sample set of suspected method-dependent interference. Based on the similarities between the data from investigated samples and the samples suspected of method-dependent interference () it is reasonable to assume that the causes of interference have an approximately similar proportional distribution.
Our experiences suggest that interference due to ASA occurs more frequently than expected in assays from Roche Diagnostics on Modular and Cobas analysers, which are the most used assay platforms in Norway.
Roche Diagnostics’ kit insert claims that interference only occurs with extremely high titers of ASA. However, a report that elucidates the relation between interference and anti-streptavidin antibody titers is not available. ASA interference may not be determined by antibody titers alone but also by antibody type (IgM, IgG), avidity in the case of IgM, affinity and binding kinetics. The ASA tested by the Roche Diagnostics laboratory may have had other properties than those we have discovered. According to our experience, ASA from different persons have a variable potential to falsely change a thyroid parameter.
The erroneous concentrations varied widely both in the same parameter between patients and between different TFT in the same patient. In some patients, ASA affected all the thyroid parameters tested but in others only some. Investigation of non-TFT before and after incubation with SCB also revealed a pattern of variability in the ability of the ASA to falsely change the results. High dose biotin treatment, in contrast, appears to give false elevated or decreased concentrations in all parameters tested (see Supplementary Table 5).
The prevalence of interference against ruthenium has been estimated to range from <0.1% to 0.24% [Citation6,Citation33]. It was assumed that Roche overcame the ruthenium interference problem in the FT3 assay in 2006 using a new blocking protein in the reagents [Citation33]. However, ruthenium interference has later been reported several times, affecting TSH, FT4 and FT3. Antibodies against ruthenium may decrease the ruthenium signal leading to falsely decreased results in the sandwich assay and falsely elevated results in the competitive assay [Citation15,Citation16,Citation33–36]. Agglutinates of ruthenium-IgG antibodies have been reported to mimic macro TSH, enhance the ruthenium signal and give falsely increased TSH [Citation37]. In this study, antibodies against ruthenium seem to give either falsely high or falsely low results in competitive thyroid assays. To our knowledge, this study is the first to report a case where ruthenium antibodies lead to falsely decreased FT4 and FT3 (see ). Ruthenium interference represents only 7% (3 of 42) of the cases of interference in the present study.
The strength of this study is that it – to the best of our knowledge – is the first attempt to consecutively and systematically register method-dependent erroneous TFT measured with the Roche method. The limitations include the possibility that some discordant results might have been missed, and that more than 50% of discordant samples did not have sufficient material for the investigation of interference by Roche Diagnostics. Following the first registered case with method-dependent erroneous results in the Roche thyroid immunoassay in 2013, the number of falsely elevated FT4, FT3 and TRAb results identified in our laboratory increased year by year. The attention given to the problem of interference at our laboratory, at other laboratories and among endocrinologists in Norway has gradually increased since 2013. Despite this, several falsely elevated thyroid results might have been overlooked, especially during the initial years of the observation period. Some discordant samples sent directly from the local hospitals to Roche Diagnostics are not included in our study.
Method-dependent interference was found in the TFT because these tests often are requested and evaluated together. The tests showed discordance with normal TSH, an elevated FT4 and/or FT3 when evaluated in conjunction. Contrary to the TFT, assay-parameters such as cortisol, progesterone, anti-Müllerian hormone, c-peptide and parathyroid hormone often are requested and evaluated by the physician as single tests, and therefore interference is almost impossible to detect. If interference is suspected, the sample should be reanalysed with an alternative method. If routine methods are used that utilize streptavidin, biotin, ruthenium or antibodies from mice, the sample should be analysed with a method that does not contain these substances.
An improved FT4 III assay from Roche Diagnostics was implemented in Norwegian laboratories in September 2018. Roche Diagnostics demonstrated by retesting 27 of the 34 ASA positive samples that the problem with ASA interference in the FT4 II assay was corrected by the FT4 III assay. In 2019 improved assays for TSH, TRAb and troponin T were introduced.
According to the April 2020 product update from Roche Diagnostics, additional 67 improved assays will be introduced within the spring of 2023. In the new assay generations, biotin interference will be addressed while there is no information on whether ASA interference will be corrected. Unless the assays are utterly improved there is a risk of misdiagnoses due to method-dependent interference.
In conclusion, it is crucial for the detection of interference that laboratories utilize alternative methods. The provider of an assay should be informed when method-dependent errors occur and be encouraged to find the source of the error. If the error is of a certain magnitude, the method deficiency should be promptly improved. Interference by ASA in commercially available immunoassays is more common than anticipated.
Supplemental Material
Download PDF (361.9 KB)Acknowledgments
We wish to thank the method specialists, Biomedical Laboratory Scientists; Inger Svendsen, Liv Sandnes and Guro Clementz for analysing and organising the freezing of the discordant samples. We also acknowledge the collaboration with the endocrinologists at our hospital’s out-patient thyroid clinic. We, thank Kristin Lilleholt at Sørlandet Hospital who sent the first three samples with confirmed ASA to Roche Diagnostics, Roche Diagnostics for their contribution to this study and Robin Holtedahl for help with the statistics and revision of the manuscript.
Disclosure statement
LK Dahll reports lecture fee and travel expenses from Roche Diagnostics. Roche Diagnostics have had the opportunity to read and give comments on the manuscript before submission. The remaining authors report no potential conflict of interest.
References
- Faix JD. Principles and pitfalls of free hormone measurements. Best Pract Res Clin Endocrinol Metab. 2013;27(5):631–645.
- Koulouri O, Moran C, Halsall D, et al. Pitfalls in the measurement and interpretation of thyroid function tests. Best Pract Res Clin Endocrinol Metab. 2013;27(6):745–762.
- Piketty ML, Polak M, Flechtner I, et al. False biochemical diagnosis of hyperthyroidism in streptavidin-biotin-based immunoassays: the problem of biotin intake and related interferences. Clin Chem Lab Med. 2017;55(6):780–788.
- Package Insert, Elecsys FT3 III Immunoassay [cited 2020 July 12]. http://labogids.sintmaria.be/sites/default/files/files/ft3_iii_2017-03_v2.pdf
- Trambas C, Lu Z, Yen T, et al. Characterization of the scope and magnitude of biotin interference in susceptible Roche Elecsys competitive and sandwich immunoassays. Ann Clin Biochem. 2018;55(2):205–215.
- Ando T, Yasui J, Inokuchi N, et al. Non-specific activities against ruthenium crosslinker as a new cause of assay interference in an electrochemilluminescent immunoassay. Intern Med. 2007;46(15):1225–1229.
- Bolstad N, Warren DJ, Bjerner J, et al. Heterophilic antibody interference in commercial immunoassays; a screening study using paired native and pre-blocked sera. Clin Chem Lab Med. 2011;49(12):2001–2006.
- Favresse J, Burlacu MC, Maiter D, et al. Interferences with thyroid function immunoassays: clinical implications and detection algorithm. Endocr Rev. 2018;39(5):830–850.
- Ismail AA. Interference from endogenous antibodies in automated immunoassays: what laboratorians need to know. J Clin Pathol. 2009;62(8):673–678.
- Berth M, Willaert S, De Ridder C. Anti-streptavidin IgG antibody interference in anti-cyclic citrullinated peptide (CCP) IgG antibody assays is a rare but important cause of false-positive anti-CCP results. Clin Chem Lab Med. 2018;56(8):1263–1268.
- Verougstraete N, Berth M, Vaneechoutte M, et al. Interference of anti-streptavidin antibodies in immunoassays: a very rare phenomenon or a more common finding? Clin Chem Lab Med. 2020;58(10):1673–1680.
- Minkovsky A, Lee MN, Dowlatshahi M, et al. High-dose biotin treatment for secondary progressive multiple sclerosis may interfere with thyroid assays. AACE Clin Case Rep. 2016;2:370–373.
- Elston MS, Sehgal S, Du Toit S, et al. Factitious Graves’ disease due to biotin immunoassay interference-A case and review of the literature. J Clin Endocrinol Metab. 2016;101(9):3251–3255.
- Tabarki B, Al-Hashem A, Alfadhel M, et al. Biotin-thiamineresponsive basal ganglia disease. In: Adam MP, Ardinger HH, Pagon RA, editors. GeneReviews®. Seattle (WA): University of Washington; 2013, p. 1–12.
- Buijs MM, Gorgels JP, Endert E. Interference by antiruthenium antibodies in the Roche thyroid-stimulating hormone assay. Ann Clin Biochem. 2011;48(3):276–281.
- Ohba K, Noh JY, Unno T, et al. Falsely elevated thyroid hormone levels caused by anti-ruthenium interference in the Elecsys assay resembling the syndrome of inappropriate secretion of thyrotropin. Endocr J. 2012;59(8):663–667.
- Rodriguez-Borja E, Barba-Serrano E, Alfayate-Guerra R, et al. The unfinished story of interference in thyroid hormones with Roche immunoassays: when prewashing procedures matter. Clin Chem Lab Med. 2017;55:175–177.
- Heil WEV. Reference ranges for adults and children: pre-analytical considerations [Internet]. Mannheim (Germany): Roche Diagnostics GmbH; 2008 [cited 2020 June 11]. https://diagnostics.roche.com/cz/cs/home.html#selectProfile
- Lam L, Kyle CV. A simple method to detect biotin interference on immunoassays. Clin Chem Lab Med. 2017;55:104–106.
- Piketty ML, Prie D, Sedel F, et al. High-dose biotin therapy leading to false biochemical endocrine profiles: validation of a simple method to overcome biotin interference. Clin Chem Lab Med. 2017;55(6):817–825.
- Trambas C, Lu Z, Yen T, et al. Depletion of biotin using streptavidin-coated microparticles: a validated solution to the problem of biotin interference in streptavidin-biotin immunoassays. Ann Clin Biochem. 2018;55(2):216–226.
- Frame IJ, Joshi PH, Mwangi C, et al. Susceptibility of cardiac troponin assays to biotin interference. Am J Clin Pathol. 2019;151(5):486–493.
- Li D, Radulescu A, Shrestha RT, et al. Association of biotin ingestion with performance of hormone and nonhormone assays in healthy adults. JAMA. 2017;318(12):1150–1160.
- Mrosewski I, Urbank M, Stauch T, et al. Interference from high-dose biotin intake in immunoassays for potentially time-critical analytes by Roche: evaluation of a countermeasure for worst-case scenarios. Arch Pathol Lab Med. 2020;144(9):1108–1117.
- Nguyen KQN, Langevin R, Fankhauser K, et al. Assessment of risk for interference by circulating biotin in samples received for high sensitivity troponin-T, thyrotropin, and for prostate specific antigen testing by immunoassays. Clin Lab. 2020;66:149–153.
- Bayart JL, Favresse J, Melnik E, et al. Erroneous thyroid and steroid hormones profile due to anti-streptavidin antibodies. Clin Chem Lab Med. 2019;57:255–258.
- Favresse J, Lardinois B, Nassogne MC, et al. Anti-streptavidin antibodies mimicking heterophilic antibodies in thyroid function tests. Clin Chem Lab Med. 2018;56:160–163.
- Harsch IA, Konturek PC, Boer K, et al. Implausible elevation of peripheral thyroid hormones during therapy with a protein supplement. Clin Chem Lab Med. 2017;55:197–198.
- Lam L, Bagg W, Smith G, et al. Apparent hyperthyroidism caused by biotin-like interference from IgM anti-streptavidin antibodies. Thyroid. 2018;28(8):1063–1067.
- Peltier L, Massart C, Moineau MP, et al. Anti-streptavidin interferences in Roche thyroid immunoassays: a case report. Clin Chem Lab Med. 2016;54:11–14.
- Rulander NJ, Cardamone D, Senior M, et al. Interference from anti-streptavidin antibody. Arch Pathol Lab Med. 2013;137(8):1141–1146.
- Wouters Y, Oosterbos J, Reynaert N, et al. Alarmed by misleading interference in free T3 and free T4 assays: a new case of anti-streptavidin antibodies. Clin Chem Lab Med. 2020;58:69–71.
- Sapin R, Agin A, Gasser F. Efficacy of a new blocker against anti-ruthenium antibody interference in the Elecsys free triiodothyronine assay. Clin Chem Lab Med. 2007;45(3):416–418.
- Heijboer AC, Ijzerman RG, Bouman AA, et al. Two cases of antiruthenium antibody interference in modular free thyroxine assay. Ann Clin Biochem. 2009;46(3):263–264.
- Suarez Rivero R, Ponce Lorenzo F, Diaz Torres J, et al. Falsely elevated thyroid-stimulating hormone value due to anti-ruthenium antibodies in a patient with primary hypothyroidism: a case report. Clin Chem Lab Med. 2017;55:273–275.
- Zaninotto M, Tognon C, Venturini R, et al. Interference in thyroid hormones with Roche immunoassays: an unfinished story. Clin Chem Lab Med. 2014;52:269–270.
- Gessl A, Blueml S, Bieglmayer C, et al. Anti-ruthenium antibodies mimic macro-TSH in electrochemiluminescent immunoassay. Clin Chem Lab Med. 2014;52(11):1589–1594.