
 ?Mathematical formulae have been encoded as MathML and are displayed in this HTML version using MathJax in order to improve their display. Uncheck the box to turn MathJax off. This feature requires Javascript. Click on a formula to zoom.
Abstract
The mean of GFR-estimates based on serum creatinine (eGFRcrea) and cystatin C (eGFRcys) has superior accuracy than each estimate alone. Recent studies have shown that agreement between eGFRcrea and eGFRcys is an indicator for the accuracy of the mean of the two estimates. As long as the difference between the two (|ΔeGFR|) is below 40%, a high P30 accuracy rate of more than 90% was documented in research settings using gold-standard GFR measurements. This was the case in approximately 80% of the measurements. The study was set out to explore |ΔeGFR| in a broader pediatric nephrological population and identify factors influencing the discrepancy between eGFRcrea and eGFRcys. We retrospectively analyzed 1596 simultaneous cystatin C and creatinine measurements in 649 unique patients at the pediatric nephrology outpatient clinic of VU university medical center. The FASage equation was used to calculate eGFRcrea, FAScys for eGFRcys. |ΔeGFR| was calculated as 100x(|eGFRcrea-eGFRcys|)/(0.5x(eGFRcrea+eGFRcys). ΔeGFR below 40% was considered high agreement. Patient characteristics like age, diagnosis, glucocorticosteroid use, eGFR, BMI and sex were analyzed for their effect on ΔeGFR below or above 40% using non-parametric tests and a potential explanation for measurements with low agreement was sought. Eighty-seven percent of the population had a |ΔeGFR| lower than 40%. Measurements with |ΔeGFR| above 40% were significantly more frequent from patients with neural tube defects. In 102 out of 208 measurements with low agreement, a potential explanation was found. In a broad pediatric nephrological population, |ΔeGFR| is below 40% in the vast majority of measurements. In this group, the mean of eGFRcrea and eGFRcys can be used as an accurate estimate of GFR.
Introduction
Glomerular filtration rate (GFR) is the most important parameter in the diagnosis and management of renal disease. GFR can be measured with high accuracy using clearance studies with exogenous markers [Citation1]. As these methods are invasive and labor-intensive, usually kidney function is monitored using endogenous markers such as creatinine and cystatin C [Citation2]. International guidelines advise using estimated GFR (eGFR) rather than serum concentrations. To this end eGFR equations have been developed both for adults and for children.
Any endogenous marker is subject to extra-glomerular factors influencing its serum levels [Citation2]. Recent studies in children [Citation3,Citation4] and adults [Citation5] have shown that calculating the mean of a creatinine-based (eGFRcreat) and a cystatin C-based equation (eGFRcys) improves accuracy. Comparing the results of eGFRcreat to eGFRcys gives additional information about the reliability of the estimate. The accuracy of mean eGFR is inversely related to the difference between eGFRcreat and eGFRcys (|Δ eGFR|) - As long as |Δ eGFR| is below 40%, P30 accuracy is high and exceeds 93% [Citation4].
This strategy is only useful in clinical practice if |ΔeGFR| is below 40% in the large majority of patients. We have previously shown this was the case in 83% of 407 measurements performed in a research setting [Citation4]. Still, it is not clear whether these data can be extrapolated to a larger and less selected population. Therefore, the current study was set out to explore |ΔeGFR| in a broader pediatric nephrological population.
Methods
Data collection
This is a retrospective study on all simultaneous measurements of serum of creatinine and cystatin C in children and adolescents ordered by the department of pediatric nephrology of VU university medical center in Amsterdam between January, 2013 and March, 2018. The study was conducted in accordance with the declaration of Helsinki. Informed consent was waived by the institutional review board of VU university medical center.
Serum creatinine was measured by the IDMS traceable creatinase/sarcosine oxidase enzymatic method, cystatin C using a particle-enhanced immunonephelometric assay (Siemens Healthcare, Marburg, Germany), which was calibrated to the IFCC standard.
Equations
To calculate eGFR from creatinine the full age-spectrum FASage equation was used [Citation6]:
For cystatin C the FAScys equation was used [Citation7]:
In order to assess the relative absolute difference between the two equations |ΔeGFR| was calculated
Analysis
|ΔeGFR| values were divided into five tiers of |ΔeGFR|: 0–10%, 10–20%, 20–30%, 30–40% and >40%. The first four tiers were combined to separate the group of high agreement (i.e. |ΔeGFR| ≤40%) from one of low agreement (i.e. |ΔeGFR|>40%). The distribution was also analyzed in a subset of unique patients consisting of the first measurement for each patient to account for a potential selection bias in patients having multiple measurements.
Patient factors such as eGFR, gender, diagnosis, BMI, age and steroid use were analyzed for their influence on high vs. low agreement. BMI was analyzed after transformation into z-scores [Citation8]. Diagnoses were divided into 5 groups: urological, nephritis, single kidney, neural tube defect, and other. Data was analyzed using an independent samples median test or Pearson Chi-squared test as applicable.
In the group with |ΔeGFR|>40% known explanations for low agreement were sought. Due to the structure of the eGFR equations used, any difference in eGFR is mathematically equivalent to a difference in rescaled biomarker. Explanations for low agreement were defined as known factors interfering with the accuracy of either of the two markers, such as low muscle mass as known in patients with neural tube defects [Citation4] or low BMI for creatinine or use of glucocorticosteroids, which are known to influence cystatin C [Citation9]. Additionally, we assessed patient groups in whom a weighted mean has been shown to increase accuracy. [Citation4] In patients with multiple measurements we also sought for outliers indicating an analytical error. Outliers were defined as a single measurement with |ΔeGFR|>40% while in at least three other measurements |ΔeGFR| was below 30%.
Results
Patient characteristics
Between January 2013 and May 2018, 1596 measurements were available in 649 unique patients. 950 measurements (58.9%) were from male patients, mean age was 11.3 years (SD 4.6), mean BMI 18.9 kg/m2 (SD 4.3), mean FAScys 100.9 (SD 30.0) ml/min/1.73m2, mean FASage 95.2 (SD 37.9). The diagnoses were 516 (32.3%) urological disease; 246 (15.4%) neural tube defect; 390 (24.4%) single kidney; 160 (10.0%) nephritis; 284 (17.8%) other. Sixty-seven samples (4.2%) were taken during glucocorticosteroid use.
Distribution of |ΔeGFR|
|ΔeGFR| was 0–10% in 456 (28.6%), 10–20% in 422 (26.4%), 20–30% in 332 (20.8%), 30–40% in 178 (11.2%) and >40% in 208 (13%) measurements. The same distribution was found when the analysis was restricted to the first measurement in each patient: |ΔeGFR| 0–10% in 179 (27.6%), 10–20% in 170 (26.2%), 20–30% in 140 (21.6%), 30–40 in 87 (13.4%) and above 40% in 87 (13.4%) patients.
In the cases with low agreement a majority of 130 (62.5%) were due to higher FAScys compared to FASage. This is visualized in , where the intersection lines represent 40% of the respective axes. We compared eGFR, BMI, sex, age, diagnosis group and glucocorticosteroid use between measurements with high vs. low agreement (). Patients with low agreement were significantly younger than those with high agreement, while BMI z-score and mean eGFR did not differ between the groups. Among the diagnoses only neural tube defects were significantly more frequent in the low agreement group. In this group, low agreement was due to high FASage compared to FAScys as shown in . Agreement was much higher in nephritis patients () and measurements with low agreement were distributed evenly.
Figure 1. FASage (ml/min/1.73 m2) plotted against FAScys (ml/min/1.73m2) with the intersection lines representing 40% of the respective axis.
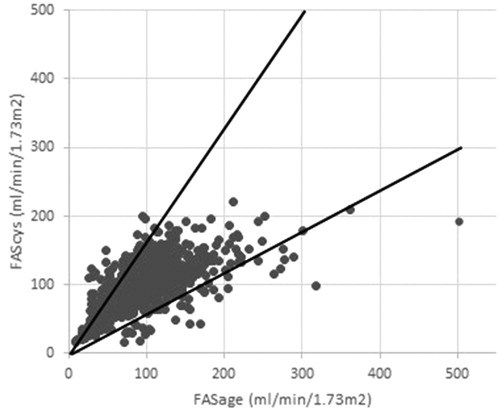
Figure 2. FASage (ml/min/1.73 m2) plotted against FAScys (ml/min/1.73m2) in patients with neural tube defects (a) and patients with nephritis (b) with the intersection lines representing 40% of the respective axis.
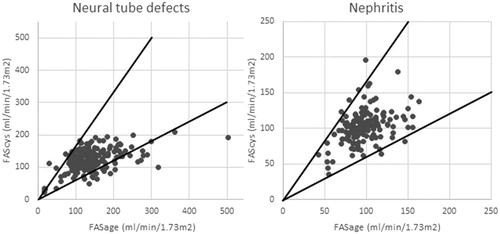
Table 1. Differences in median levels or prevalences of different variables between the high agreement (|ΔeGFR| ≤ 40%) and the low agreement (|ΔeGFR| > 40%) groups.
In the low agreement group an explanation was sought as suggested by Grubb’s Lund approach [Citation10]. Fifty-seven (27.4%) samples were from neural tube defect patients for whom FAScys is more accurate, 16 (7.7%) from nephritis patients for whom a weighted mean favoring FASage has been shown to be more accurate [Citation4]. All of the samples during glucocorticosteroid use in the low agreement group were from nephritis patients. Six patients had a BMI below −1.5 SD, two of whom also had a neural tube defect, leaving four (1.9%) in whom low BMI as a surrogate of low muscle mass might be an explanation. Twenty-five (12.0%) samples met our definition of an outlier. Therefore, a presumptive explanation for the discrepancy was found in 102 (i.e. 49%) of the measurements.
Concordance of a high discrepancy could be studied by multiple measurements in 177 out of 208 measurements. |delta-eGFR| >40% was a single event in 22 out of 25 patients with two measurements, in 15/23 with three, in 13/17 with four, in 12/18 with five, in 7/9 with six, in 2/5 with seven and 4/13 with eight measurements.
Discussion
This study was set out to explore the potential of calculating the mean of a cystatin C- and a creatinine-based eGFR in an outpatient nephrological clinic. The data shows that in 87.0% of the measurements |ΔeGFR| was below 40%. In these measurements, the mean of a creatinine and cystatin C based equation equations gives an accurate estimate of GFR with P30 accuracy exceeding 90% based on clearance studies [Citation4,Citation11,Citation12], which is close to the maximum theoretically attainable in endogenous GFR estimation [Citation4,Citation10]. Our results are in line with results in experimental populations in children [Citation4] and in two studies in adults [Citation11,Citation12], where 89.5%, 81.7% and 83.4% of measurements had |ΔeGFR| below 40%, respectively. Mean GFR in the adult cohorts was 51 ml/min/1.73m2 rather than 91 ml/min/1.73m2 in our pediatric population suggesting that this approach is applicable across a wide range of age and kidney function. This is relevant as interassay variability is higher at low marker concentrations [Citation13], higher delta-eGFR is to be expected in normal compared to reduced GFR.
The diagnosis which was significantly more prevalent in the low agreement group were patients with neural tube defects, in whom cystatin C is superior to creatinine [Citation4]. While low BMI has been associated with decreased muscle mass in adults [Citation14], differences in BMI z-scores were not associated with high |ΔeGFR| in our patients. Schwartz et al observed that heavier weight was the only characteristic associated with high |ΔeGFR| in the CKiD population [Citation15]. Measurements with high |ΔeGFR| were from younger children, a finding which cannot readily be explained.
The advantage of comparing creatinine- and a cystatin C-based eGFR lies in the recognition of extrarenal factors leading to a faulty estimation of GFR by one of the two markers [Citation10]. Potential reasons for lower eGFRcys compared to eGFRcreat are neuromuscular disease and wasting (diminished creatinine production), high-dose glucocorticoid treatment and untreated hyperthyroidism (stimulation of cystatin synthesis [Citation9,Citation16]), the initial phase of acute renal failure (lower volume of distribution of cystatin C [Citation17]), dialysis (elimination of the small creatinine molecule largely exceeds cystatin C elimination [Citation18]), ‘shrunken pore syndrome’ (impaired glomerular filtration of molecules >5kDa [Citation19]) and heterophilic antibodies leading to agglutination in the particle-enhanced immunoassays used for cystatin C measurement. High eGFRcys compared to eGFRcreat is seen in the setting of untreated hypothyroidism (diminished cystatin production [Citation16]), high muscle mass [Citation20], end-stage renal disease without dialysis (stronger impact of hepatic excretion of cystatin C [Citation21]), rapid improvement of kidney function (lower volume of distribution of cystatin C) and urine leakage (re-circulation of filtered creatinine while cystatin C undergoes tubular degradation [Citation22]).
In our population, 49% of the 208 cases with low agreement could be explained. In the majority FASage was higher than FAScys. By contrast, in 89 of the 106 unexplained cases, FAScys was higher than FASage. The only potential explanation would be untreated hypothyroidism, which was not formally excluded but is very unlikely in view of the low prevalence of thyroid disease expected in a general nephrological population.
12% of the discrepant measurements met our strict criteria for an outlier. Still, in the majority of repeated measurements, the discrepancy was not replicated indicating a transient finding. This supports the clinical practice of repeating such tests before initiating more invasive testing.
There are some limitations to this study. (i) We did not use a gold standard GFR measurement to determine whether FASage or FAScys were correct in a given measurement. (ii) We only used one combination of equations and other eGFR equations might have performed differently. Yet, our data match data from two adult studies indicating that our findings can be generalized, indeed [Citation11,Citation12]. (iii) The study was done in an academic setting and may not be representative of a primary care population. We also did not study transplant recipients.
Conclusion
|ΔeGFR| is less than 40% in 87.0% of a broad pediatric nephrology population, which is comparable to research settings. This allows for accurate eGFR reporting in the vast majority of patients.
Disclosure statement
No potential conflict of interest was reported by the authors.
References
- Soveri I, Berg UB, Björk J, et al. Measuring GFR: a systematic review. Am J Kidney Dis. 2014;64(3):411–424.
- den Bakker E, Gemke RJBJ, Bökenkamp A. Endogenous markers for kidney function in children: a review. Crit Rev Clin Lab Sci. 2018;55(3):163–183.
- Leion F, Hegbrant J, den Bakker E, et al. Estimating glomerular filtration rate (GFR) in children. The average between a cystatin C- and a creatinine-based equation improves estimation of GFR in both children and adults and enables diagnosing Shrunken Pore Syndrome. Scand J Clin Lab Invest. 2017;77(5):338–344.
- den Bakker E, Gemke R, van Wijk JAE, et al. Combining GFR estimates from cystatin C and creatinine-what is the optimal mix? Pediatr Nephrol. 2018;33(9):1553–1563.
- Tidman M, Sjöström P, Jones I. A Comparison of GFR estimating formulae based upon s-cystatin C and s-creatinine and a combination of the two. Nephrol Dial Transplant. 2008;23(1):154–160.
- Pottel H, Hoste L, Dubourg L, et al. An estimated glomerular filtration rate equation for the full age spectrum. Nephrol Dial Transplant. 2016;31(5):798–806.
- Pottel H, Delanaye P, Schaeffner E, et al. Estimating glomerular filtration rate for the full age spectrum from serum creatinine and cystatin C. Nephrol Dial Transplant. 2017;32:497–507.
- Fredriks AM, van Buuren S, Wit JM, et al. Body index measurements in 1996-7 compared with 1980. Arch Dis Child. 2000;82(2):107–112.
- Bökenkamp A, Laarman CA, Braam KI, et al. Effect of corticosteroid therapy on low-molecular weight protein markers of kidney function. Clin Chem. 2007;53(12):2219–2221.
- Grubb A. Non-invasive estimation of glomerular filtration rate (GFR). The Lund model: simultaneous use of cystatin C- and creatinine-based GFR-prediction equations, clinical data and an internal quality check. Scand J Clin Lab Invest. 2010;70(2):65–70.
- Björk J, Grubb A, Larsson A, et al. Accuracy of GFR estimating equations combining standardized cystatin C and creatinine assays: a cross-sectional study in Sweden. Clin Chem Lab Med. 2015;53:403–414.
- Grubb A, Nyman U, Björk J. Improved estimation of glomerular filtration rate (GFR) by comparison of eGFRcystatin C and eGFRcreatinine. Scand J Clin Lab Invest. 2012;72(1):73–77.
- Bokenkamp A, Domanetzki M, Zinck R, et al. Cystatin C---A New Marker of Glomerular Filtration Rate in Children Independent of Age and Height. PEDIATRICS. 1998;101(5):875–881. doi:10.1542/peds.101.5.875.
- Graf CE, Pichard C, Herrmann FR, et al. Prevalence of low muscle mass according to body mass index in older adults. Nutrition. 2017;34:124–129.
- Schwartz GJ, Schneider MF, Maier PS, et al. Improved equations estimating GFR in children with chronic kidney disease using an immunonephelometric determination of cystatin C. Kidney Int. 2012;82(4):445–453.
- Fricker M, Wiesli P, Brändle M, et al. Impact of thyroid dysfunction on serum cystatin C. Kidney Int. 2003;63(5):1944–1947.
- Slort PR, Ozden N, Pape L, et al. Comparing cystatin C and creatinine in the diagnosis of pediatric acute renal allograft dysfunction. Pediatr Nephrol. 2012;27(5):843–849.
- Hoek FJ, Korevaar JC, Dekker FW, et al. Estimation of residual glomerular filtration rate in dialysis patients from the plasma cystatin C level. Nephrol Dial Transplant. 2007;22(6):1633–1638.
- Grubb A. Shrunken pore syndrome – a common kidney disorder with high mortality. Diagnosis, prevalence, pathophysiology and treatment options. Clin Biochem. 2020;83:12–20.
- Baxmann AC, Ahmed MS, Marques NC, et al. Influence of muscle mass and physical activity on serum and urinary creatinine and serum cystatin C. Clin J Am Soc Nephrol. 2008;3(2):348–354.
- Sjöström P, Tidman M, Jones I. Determination of the production rate and non-renal clearance of cystatin C and estimation of the glomerular filtration rate from the serum concentration of cystatin C in humans. Scand J Clin Lab Invest. 2005;65(2):111–124.
- van Roij KG, van der Horst HJ, Hubeek I, et al. Discrepant results of serum creatinine and cystatin C in a urological patient. Clin Chem. 2017;63(4):812–814.