
Abstract
Counting numbers of blood neutrophils is one of the most common laboratory tests in modern clinical medicine. In this report, we have tested the idea that immunoassay of major constituents of mature neutrophils might serve as proxy of cell counting and allow the development of rapid and simple point-of-care tests. The procedure may also allow for the estimate of the state of maturity of the circulating blood cells. Immunoassays for myeloperoxidase (MPO) and lactoferrin (LF) were used to measure the respective protein in whole blood extracts of 275 unselected hospitalized patient and in 51 healthy controls and leukemia patients of which eight were followed before, during and after remission treatment. MPO was correlated to neutrophil counts in the unselected hospitalized population (r = 0.95, p <.0001). Huge variations were seen in whole blood extracts of patients with AML with very high MPO/LF ratios in half of the AML patients and in all three patients with APL. In extracts from patients with ALL no difference was found in the ratio as compared to healthy persons. The monitoring of AML patients during remission treatment showed intriguing patterns one of which suggested the possibility to monitor the myelopoietic activity in the bone marrow during the recovery phase. We show a novel and easy technology to count mature neutrophils in blood and also to monitor myeloid cell maturity in the blood as well as myelopoietic activity in the bone marrow. The technology lends itself to the development of a rapid and simple point-of-care test.
Introduction
Counting numbers of blood neutrophils is one of the most common procedures and laboratory tests in modern clinical medicine. The indications for counting the numbers of blood neutrophils are many, but above all for the judgment of infectious and other inflammatory diseases. In an unpublished survey performed at the turn of the millennium in collaboration with Pharmacia Diagnostics in Uppsala, Sweden, physicians in England, Spain, Sweden and USA were asked which information in a blood differential count that was most important to them. The answer was very clear since 96% of all physicians, both pediatricians and others, responded that the numbers of neutrophils were the most important information in a blood cell differential count. The remaining 4% ranked the numbers of eosinophils but very few of the physicians ranked monocytes, lymphocytes and basophils as important. The number of neutrophils is counted manually under the microscope or by automated cell counters depending on the setting of the health care provider. Common to these settings though is the request of results with a short turnaround time, that is, time from blood sampling to the report to the doctor.
In rare cases, blood neutrophil numbers are greatly altered or show signs of immaturity, which prompt further examination of the blood cells and/or bone marrow examinations. In patients with the diagnosis AML (acute myeloid leukemia) the numbers of circulating immature cells and the proportion of immature cells, that is, myeloblast in the bone marrow are increased and closely monitored during treatment. In many cases this requires repeated and frequent bone marrow aspirations which is an unpleasant experience of the patient.
In this report, we show a novel procedure of accurate, rapid and simplified counting of the numbers of neutrophils by means of the measurements of one of the major granule constituents in extracted whole blood, Myeloperoxidase ((MPO). MPO is produced in the bone marrow by the very early stages of neutrophil development, that is, the myeloblasts [Citation1]. We also show that the simultaneous measurement in whole blood extracts of Lactoferrin (LF) and the formation of a ratio between MPO and LF may reflect the maturity of the circulating myeloid cells and/or the activity of the bone marrow, since LF is produced in the bone marrow by the later stages of neutrophil development, that is, myelocytes [Citation1].
Methods
Peripheral blood was obtained from venepuncture and anticoagulated with EDTA or heparin. Blood was obtained from two different populations. One was from left-over EDTA blood of 275 unselected hospitalized patients and the other was heparinized blood from 36 patients with different forms of acute leukemia and 13 healthy persons as indicated in the figures below. Blood cell counts were performed by either Coulter STKS (Beckman Coulter Inc, USA) or Sysmex blood cell counter (Sysmex corporation, Kobe, Japan). The study was approved by the local research ethics committee of Uppsala.
Whole blood was extracted by a dilution of 100 times in CTAB 0.05% for 30 min after which cell debris was eliminated by centrifugation at 1000×g for 15 min. MPO and LF in extracted EDTA blood from hospitalized patients were measured by radioimmunoassays (Pharmacia Diagnostics, Uppsala, Sweden) and MPO and LF in the supernatants of extracted heparinised blood were measured by double monoclonal-based ELISA for MPO and LF developed and provided by Diagnostics Development, Uppsala, Sweden. The lower level of quantification of MPO was 50 ng/L and the lower level of quantification of LF was 0.5 µg/L. In calculations of ratios, concentrations of LF <0.5 µg/L were set to 0.5 µg/L. The intra- and inter CVs of duplicates were <10% for all three assays. The comparisons of the RIA and ELISA assays for LF and MPO showed highly linear correlations, r > 0.97 (unpublished).
Statistics
Non-parametric statistics were applied for comparison between groups (Mann–Whitney’s test) and between paired samples (Wilcoxon’s test). Linear correlations were applied for the comparison between cell counts and biomarker concentrations. The slope was used for the estimation of the cellular content of the respective granular protein. Passing–Bablok regression analysis was also used for this latter purpose. The statistics program Medcalc was used (MedCalc® Statistical Software version 19.6, MedCalc Software Ltd, Ostend, Belgium).
Results
Myeloperoxidase and lactoferrin in whole blood extracts from an unselected hospitalized population
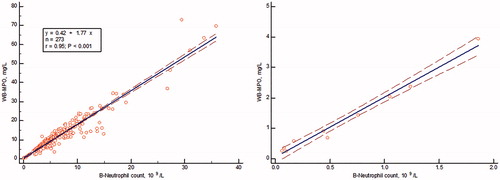
Whole blood from 275 unselected hospitalized patients was extracted for the measurement of MPO and LF by their respective RIA. The concentrations in the extracts were correlated to numbers of blood neutrophils. As seen in , MPO was significantly and linearly correlated to numbers of blood neutrophils (r = 0.95, p <.0001). When looking at patients with blood neutrophils <2 × 10⁹/L, that is, with neutropenia, the correlation to MPO was even higher, r = 0.99. The slope was 1.90 which means an extracted content of 1.90 mg/109 neutrophils. The correlation between LF in the extracted blood and blood neutrophils was also highly significant, r = 0.85, p < .0001. By Passing–Bablok regression analysis, a slope of 1.71 was obtained meaning the recovery of 1.71 mg LF/109 neutrophils. A ratio between MPO and LF in the whole blood extracts showed a median of 1.09 and a 5–95% range of 0.66–1.94. The seven samples with the highest ratios, that is, >3 were all obtained from patients with myeloid leukemia.
Figure 1. The correlation between blood neutrophil counts and Myeloperoxidase in extracted whole blood in an unselected hospitalized group of patients. The left panel shows all patient data (r = 0.95) and the right panel only results of patients with neutropenia i.e. blood neutrophils <2 × 10⁹/L (r = 0.99).
Myeloperoxidase and lactoferrin in whole blood extracts from patients with acute leukemia
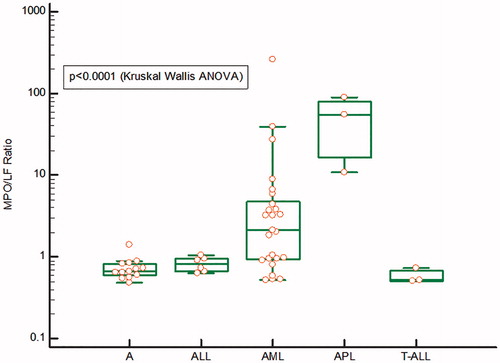
In , the concentrations in extracted whole blood of MPO and LF, as measured by their respective ELISA, as well as the ratio between MPO/LF () are shown in patients with acute myeloid and lymphocytic leukemia before start of treatment as compared to a group of healthy persons. The concentrations of MPO varied >100-fold in patients with AML and with very high concentrations in the two patients with acute promyelocytic leukemia. In patients with acute lymphocytic leukemia, the concentrations were closer to those found in healthy persons. The concentrations of LF varied about 100-fold in AML and with average levels significantly lower than the concentrations seen in acute lymphocytic leukemia and healthy persons. Also, in the extracts from the three patients with APL, the concentrations were much lower than in healthy persons. The ratios between MPO/LF are shown in and show a widespread distribution in AML from normal to extremely high ratios. The latter was also seen in APL, whereas the ratios in acute lymphocytic leukemia were similar to the ratios of healthy persons.
Figure 2. The concentrations in extracts of whole-blood (a) Myeloperoxidase (right panel), (b) Lactoferrin (left panel) in samples from patients with ALL (Acute lymphocytic leukemia), AML (Acute myeloid leukemia), APL (Acute promyelocytic leukemia), T-ALL (T-cell Acute lymphocytic leukemia) and A (Adult controls). The results are represented by a logarithmic y-axis. The statistics is shown on the figure.
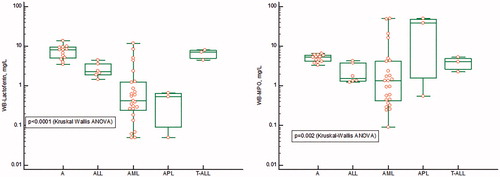
Figure 3. The MPO/LF ratio in samples from patients with ALL (Acute lymphocytic leukemia), AML (Acute myeloid leukemia), APL (acute promyelocytic leukemia), T-ALL (T-cell acute lymphocytic leukemia) and A (adult controls). The results are represented by a logarithmic y-axis. The statistics is shown on the figure.
The monitoring of myeloperoxidase and lactoferrin and MPO/LF ratios in whole blood extracts of AML patients during remission treatment
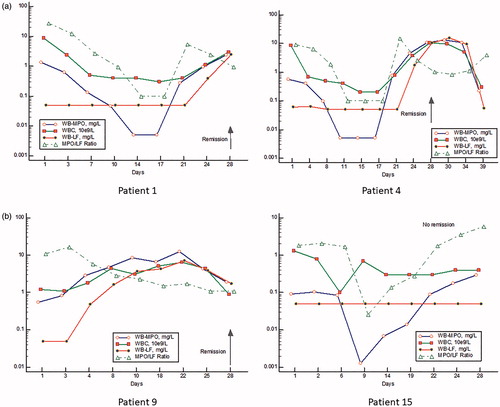
In , we show examples of four patients with AML during treatment with intensive chemotherapy (day 1-5) for remission. As seen the numbers of neutrophils as judged by MPO go down dramatically after start of treatment in most whereas LF is low or unmeasurable from start and during treatment. The MPO/LF ratio followed by and large changes in MPO. After 3–4 weeks MPO and the MPO/LF ratio started to rise to supernormal levels followed by normalization in all patients experiencing remission. Thus, the MPO/LF ratios at admission were significantly lower at discharge, median 3.23 vs 1.3 (p = .01, Wilcoxon). In all patients experiencing remission LF started to rise in the recovery phase 4–7 days later than the rise in MPO. Of note is the fact that the initial rise in the recovery phase of MPO after treatment occurred without signs of any substantial increase in cell numbers. In patient 15 with no remission (i.e. refractory to the first course of chemotherapy), we saw a dramatic fall and rise of MPO and MPO/LF ratio but no change in LF. In this patient, the MPO/LF ratio remained high with no change in cell numbers.
Figure 4. (a, b) The monitoring of whole-blood MPO and LF, the MPO/LF ratio and WBC before, during and after remission treatment in four patients of which three experienced a morphological remission and one patient (no 15) showed no remission. The results are represented by a logarithmic y-axis.
Discussion
We show in this report an alternative way of counting the number of blood neutrophils. We also show by the application of two different major constituents of myeloid cells representing different maturation stages of neutrophils, that we can get an estimate of the maturity of the circulating pool of myeloid cells as well as an estimate of the bone marrow myelopoietic activity. The technology is based on the immunoassay of the two proteins Myeloperoxidase and Lactoferrin and therefore lends itself to the development of simple and rapid point-of-care assays.
Myeloperoxidase is primarily contained in the primary, azurophil granules of neutrophils but also in monocytes [Citation2,Citation3]. The content in monocytes has been estimated to be about 50% of what is found in neutrophils. Thus, in rare cases with monocythemia the numbers of neutrophils may be overestimated by our novel technology. MPO deficiency is a rare genetic abnormality in which neutrophil counts may be underestimated [Citation4]. Lactoferrin is not present in any other blood cell but neutrophils. However, as the name implies lactoferrin is found abundantly in breast milk and serves as an anti-bacterial principle in the milk [Citation5]. Lactoferrin is present in the secondary, specific granules of neutrophils. The differences in the degree of correlations to neutrophil numbers with a much closer correlation for MPO than for Lactoferrin is probably a sign of two conditions. One is the fact that Lactoferrin is produced late in the myeloid cell development and subject to variable marrow transit times depending on the demand from the body [Citation6]. Thus, in diseases such as bacterial infections, the transit time is shortened and the time to produce Lactoferrin goes down [Citation7]. Myeloperoxidase on the other hand is produced already early during the myeloid development and much less affected by changes in marrow transit time. The second condition is the fact that secondary granules are secretory granules, meaning that mobilization of proteins from this class of granules is more responsive to external stimuli than from Myeloperoxidase containing primary granules [Citation3].
Our findings of high MPO/LF ratios in AML are in keeping with our hypothesis that this ratio reflects circulating immature cells and the higher ratio the more immature are the cells. It was, however, also obvious from our findings that the ratio was normal in some patients diagnosed as AML meaning that the circulating cells had the same relative content of the two proteins. This was more often seen in patients with neutropenia and indicates that the cells released from the bone marrow in these patients are few, but mature.
The monitoring of our patients with AML following remission induction treatment showed some intriguing patterns. Most consistently the numbers of myeloid cells were low at start and declined gradually after treatment. The MPO/LF ratio was very high at start but reduced in parallel to MPO since the concentrations of LF were consistently unmeasurable in most cases. This first phase of changes in MPO and MPO/LF ratio are expected and support our hypothesis. In the recovery phase MPO and the MPO/LF ratio rose to supernormal levels after which they normalized as did the lactoferrin concentrations. However, it is noticeable that the MPO concentrations and MPO/LF ratio rose in spite of low WBC counts and the absence of any circulating immature cell. So where does MPO come from? Our speculation is that the high concentrations of MPO reflect the contribution from the activity of the myelopoiesis in the bone marrow, which is regenerating from a period of chemotherapy induced myelosuppression. It has to be remembered that we measure all MPO in our blood extracts, both what is extracted from the blood cells and what is present in plasma. A high degree of inefficient myelopoiesis could result in a major contribution to the plasma levels, which has indeed been implied in earlier work [Citation8–10]. Thus, the ratio in the recovery phase should tell us about the activity and quality of the myelopoiesis in the bone marrow. In the patient with no remission, this notion was further emphasized with no changes in blood cell counts but a dramatic change in MPO and the MPO/LF ratio reflecting expansion, but no maturation of the myeloid cells.
We conclude from our study that our idea of measuring major neutrophil constituents in extracted whole blood as proxies of neutrophil counts has gained strong support. A rapid and simple point-of-care test taking advantage of this idea should be useful in the many clinical situations in which neutrophil counts are essential knowledge such as in inflammatory disease, neutropenia of different causes and other blood disorders. The knowledge of the state of maturity of the myeloid cell population adds further to the usefulness of our technology and not the least in patients with blood disorders such as myeloid leukemia. Whether this knowledge will help and reduce the number of bone-marrow aspirations in these patients is our hope but needs to be shown by further studies of leukemia patients with consecutive blood sampling.
Disclosure statement
Per Venge holds a world wide patent “Method for estimation of the amount of specific cell types.”
References
- Cramer EM, Beesley JE, Pulford KAF, et al. Colocalization of elastase and myeloperoxidase in human blood and bone marrow neutrophils using a monoclonal antibody and immunogold. Am J Pathol. 1989;134(6):1275–1284.
- Nichols BA, Bainton DF, Farquhar MG. Differentiation of monocytes. Origin, nature, and fate of their azurophil granules. J Cell Biol. 1971;50(2):498–515.
- Borregaard N, Lollike K, Kjeldsen L, et al. Human neutrophil granules and secretory vesicles. Eur J Haematol. 1993;51(4):187–198.
- Salmon SE, Cline MJ, Schultz J, et al. Myeloperoxidase deficiency immunologic study of a genetic leukocyte defect. N Engl J Med. 1970;282(5):250–253.
- Bullen JJ, Rogers HJ, Leigh L. Iron-binding proteins in milk and resistance to Escherichia coli infection in infants. Br Med J. 1972;1(5792):69–75.
- Schmitz S, Franke H, Brusis J, et al. Quantification of the cell kinetic effects of G-CSF using a model of human granulopoiesis. Exp Hematol. 1993;21(6):755–760.
- Venge P, Strömberg A, Braconier JH, et al. Neutrophil and eosinophil granulocytes in bacterial infection: Sequential studies of cellular and serum levels of granule proteins. Br J Haematol. 1978;38(4):475–483.
- Öberg G, Simonsson B, Smedmyr B, et al. Myeloid regeneration after bone-marrow transplantation monitored by serum measurements of myeloperoxidase, lysozyme and lactoferrin. Eur J Haematol. 1987;38(4):356–362.
- Öberg G, Venge P. Bone-marrow regeneration after therapy-induced hypoplasia monitored by serum measurements of lactoferrin, lysozyme and myeloperoxidase. Scand J Haematol. 1986;37(2):130–136.
- Emmertsen F, Glenthoj A, Sonderskov J, et al. ProHNPs are specific markers of normal myelopoiesis. Blood Cancer J. 2014;4:e193.