
 ?Mathematical formulae have been encoded as MathML and are displayed in this HTML version using MathJax in order to improve their display. Uncheck the box to turn MathJax off. This feature requires Javascript. Click on a formula to zoom.
Abstract
Several diseases have a deleterious fibrosis component. Biomarkers indicating potential clinical utility that reliably reflect the degree of fibrosis have been introduced, one of them being soluble suppression of tumorigenicity 2 (sST2). The aim of our study was to explore the association of cardiometabolic risk factors, different diseases and total mortality with biomarker sST2 and see, how fibrosis is portrayed in these conditions. In addition, we were interested to see if sST2 levels could predict fibrosis in the long-term (21 years). The Oulu Project Elucidating Risk of Atherosclerosis (OPERA) survey collected data on the same individuals in years 1991–1993 (baseline, n = 1045), 2013–2014 (follow-up, n = 600) and mortality data until year 2019. Smoking at baseline retained a significant association with sST2 levels reflecting fibrosis development 20 years later. In the multivariate model male gender, diabetes, quick-index, levels of alanine aminotransferase (ALAT), high-density lipoprotein (HDL) cholesterol and high-sensitivity C-reactive protein (hsCRP) were associated with elevated sST2 levels at the examination 2013–2014. sST2 levels were higher among subjects suffering from cardiovascular disease (p = .031), cancer (p = .021), mild cognitive decline (p = .046) and diabetes (p < .001). Total mortality was assessed by using the Cox proportional hazard survival model analysis. sST2 (log-transformed) was an independent predictor of total mortality (HR 9.4; 95% CI 2.8–31.4, p<.001) when age, gender, diabetes, smoking, quick-index, levels of ALAT, HDL-cholesterol and hsCRP were added as covariates. In addition, elevated levels indicated worse prognosis and predicted mortality.
Introduction
Fibrosis is a reactive process, where components of the extracellular matrix (ECM) are excessively produced and accumulated in or around tissues or organs. This leads to progressive architectural remodeling, permanent scarring, organ dysfunction and ultimately death. Fibrosis is a consequence of various pathophysiological events and it can occur in almost every tissue in the body. Moreover, the destruction of parenchymal cells initiates fibrosis, where cell death is driven by multiple factors and mechanisms such as genetic dysfunction, chronic inflammation, toxins, smoke and irritation. In addition, factors such as high cholesterol levels, obesity, hypertension and diabetes can provoke the initiation of fibrosis [Citation1].
Biomarkers indicating potential clinical utility that reliably reflect the degree of fibrosis have been introduced. One of these biomarkers is the suppression of tumorigenicity 2 (ST2), also called interleukin 1 receptor-like-1 (ILR1L1). The marker belongs to the interleukin 1 receptor family and the gene is located on chromosome 2. The protein has four isoforms, from which two are significant; a transmembrane receptor ST2L and a truncated, soluble receptor soluble suppression of tumorigenicity 2 (sST2) found from the blood. Both main isoforms can be synthesized from the same messenger RNA through alternative splicing and 3′ processing [Citation2,Citation3]. sST2 expression and secretion occurs mainly in endothelial cells throughout the body [Citation4]. In addition, the lungs, heart, kidney and small intestine as well as CD8 and CD4 T-cells and mast cells have been reported to produce sST2. Production is stimulated by inflammation and tissue damage [Citation5].
Interleukin 33 (IL-33), which is also a part of the IL-1 family, functions as a ligand for the ST2L receptor. It is released and stored in the nucleus of endothelial and epithelial cells and is secreted due to tissue damage caused by pathogen exposure, injury or death by necrosis with inflammation further stimulating secretion. In addition, immune cells as well as cardiac fibroblasts and myocytes can secrete IL-33 [Citation6,Citation7]. IL-33 functions as an alarming by signaling the occurrence of tissue damage to local immune cells. Binding to ST2L, the IL-33/ST2 signaling pathway results in an immune response through transcription of inflammatory genes and the production of cytokines and chemokines. On the other hand, when sST2 binds to IL-33, the interaction between ST2L and IL-33 terminates, thus sST2 acts as a decoy receptor for IL-33 [Citation7]. The IL33/ST2 signaling pathway and sST2 production is linked to several inflammatory diseases such as cardiac diseases and diabetes. The pathway takes part in the loss of balance between tissue regeneration and inflammation leading to tissue remodeling, which is the hallmark of fibrosis [Citation6].
Increased sST2 levels have previously been linked to multiple pathophysiological states such as cardiac diseases, immunological diseases and diabetes [Citation8]. Our aim was to explore cardiometabolic risk factors, diseases and mortality associated with sST2 levels reflecting fibrosis. In addition, we were interested in factors that predict fibrosis in the long-term (21 years).
Subjects and methods
Study cohort
The study was approved by the Ethics Committee of the Medical Department of the University of Oulu (48/2009). Written informed consent was given by participants for their clinical records to be used in this study.
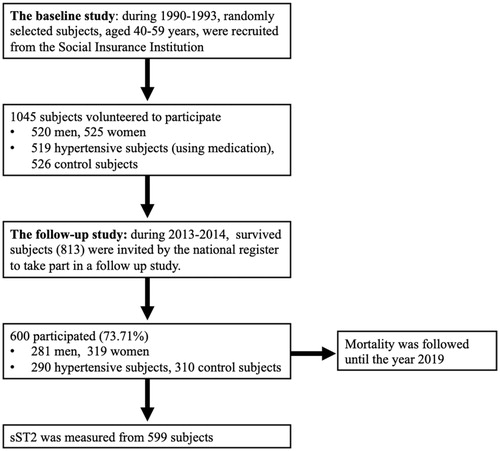
The study was executed as a part of the Oulu Project Elucidating Risk of Atherosclerosis (OPERA) project, in which the impact of genetic and environmental risk factors on cardiovascular (CV) diseases and diabetes were studied. The first phase of the study was conducted during the years 1991–1993 and 1045 subjects aged 40–59 years participated. The second phase of the study was carried out in 2013–2014 where 600 of the 813 survivors, aged 63–68 years, attended a follow-up visit. Hypertensive subjects were given age- and sex-matched controls in both stages of the study. Mortality was followed and complete information was updated from the hospital data from the follow-up (years 2013–2014) visit until 31 December 2019. The outline of the study and study selection process is portrayed in .
Figure 1. OPERA – Oulu Project Elucidating Risk of Atherosclerosis study outline.
Examinations
Thorough examinations were carried out during both first and second phases of the study. Alcohol consumption, smoking, physical activity, the use of hypertensive medication and past medical history were inquired through questionnaires. The consumption of alcohol was measured in grams of absolute alcohol consumed per week and smoking was measured in the number of cigarettes consumed per day. The lifetime smoking burden was calculated as pack years (1 pack year = 20 cigarettes smoked/day in one year). Body mass index (BMI) was measured by dividing weight (kg) by height squared (m2). Waist circumference was measured in cm.
WHO criteria were used to determine prediabetes including impaired glucose tolerance (IGT), impaired fasting glucose (IFG) and type 2 diabetes (T2D) [Citation9]. The degree of insulin sensitivity was analyzed by using the quantitative insulin sensitivity check-index (QUICKI) following the formula QUICKI = 1/(log (fasting insulin) ( IU/L) + log (fasting glucose) (mg/dL)). A low reading indicated high insulin resistance [Citation10]. Blood pressure was measured according to the recommendations of the American Society of Hypertension in a sitting position from the right arm with an oscillometric device (Dinamap® model 18465X, Criticon Ltd., Ascot, UK) after an overnight fast and a 10–15-minute rest. Three measurements were made at one-minute intervals and the means of the last two were used in the analysis. Subjects were considered hypertensive if their blood pressure value was over 140/90 mmHg or if they used antihypertensive medication.
Hepatosteatosis was diagnosed with liver-kidney contrast assessed ultrasonography at the baseline of the study. These subjects were classified as non-alcoholic fatty liver disease (NAFLD) patients in the follow-up, if they did not have excessive alcohol use (men ≥210 g/week, women ≥140 g/week) or another liver disease excluding NAFLD. The NAFLD fibrosis score (NFS) value was used to evaluate the probability of liver fibrosis within NAFLD patients using the following variables: age in years, BMI (kg/m2), IFG or diabetes status (no = 0, yes= 1), aspartate aminotransferase (ASAT) (U/L), alanine aminotransferase (ALAT) (U/L), plasma albumin (g/dL) and blood thrombocyte count (×109/L). The score was calculated by using the following formula: NFS= −1.675 + 0.037 + age (years)+0.094 + BMI (kg/m2)+1.13 × IFG or diabetes + 0.99 × ASAT/ALAT – 0.013 × blood thrombocyte count (×109/L) 0.66 × plasma albumin (g/L). The variable data were collected during the follow-up visit and the score was calculated with the help of an Internet calculator (www.nafldscore.com) [Citation11]. Liver transient elastography (TE) was reliably measured from 86 subjects in the follow up phase of the OPERA study.
Cognition was assessed by the Mini-Mental State Exam (MMSE) score in the follow-up stage of the study. To measure MMSE scores, a standardized test described by Folstein et al. [Citation12] was used. The examination was divided into two parts: the first part was used to cover attention, memory and orientation, the second part was used to cover following of verbal and written commands. The overall score in this evaluation is 30. Subjects were divided into two groups depending on the MMSE score; subjects with <24 points (44 subjects, 7.4%) and subjects with >24 points (554 subjects, 92.6%).
Carotid intima media thickness of the common carotid artery was measured by using a duplex ultrasound system in the first phase of the study [Citation13].
Examinations and laboratory tests were performed for 1045 subjects during the baseline and for 598–600 subjects during the follow-up stage of the study.
Laboratory tests
Comprehensive laboratory tests were taken in both baseline and follow-up stages of the study. Glucose, insulin, total cholesterol, triglyceride, high-density lipoprotein (HDL) and low density-lipoprotein (LDL) cholesterol, creatinine, ALAT, ASAT and high-sensitivity C-reactive protein (hsCRP) levels were all evaluated in both baseline and follow-up examinations. In addition, estimated glomerular filtration rate (eGFR) was determined in both phases with the following formula: eGFR (mL/min/1.73 m2) = 186 × (plasma creatinine in mg/dL) – 1.154×(age) – 0.203×(0.742 if female)). sST2 values were analyzed in the second phase of the study from 598 subjects. The concentrations were measured from the plasma with Human ST2/IL1-R4 Quantikine ELISA kit DST200 (intra-assay coefficient of variation 1.8% and inter-assay coefficient of variation 9.0%). The values ranged from 6.7 ng/mL to 250.6 ng/mL with the mean of 23.7 ng/mL with a standard deviation (SD) of 18.2 ng/mL. High-sensitivity C-reactive protein levels were measured by using a commercially available ELISA kit with a detection limit of 0.00031 mg/L (Diagnostic System Laboratories, Webster, TX). Baseline clinical laboratory tests were performed after 12 h of fasting in the central laboratory of the Oulu University Hospital. The follow-up examinations laboratory tests were performed in the join municipal service provider of Northern Finland Laboratory Center, NordLab Oulu (Oulu, Finland). The laboratory examinations and tests are given in more detail in previous articles: for the baseline by Rantala et al. [Citation14] and for the follow-up by Leinonen et al. [Citation15].
Statistical analysis
The statistical analysis was performed by using IBM SPSS (Armonk, NY). sST2 values were log-transformed due to skewed distribution. The data were analyzed with logistic regression in univariate and multivariate models. Values with p<.05 were considered statistically significant. Differences between groups were tested with the analysis of variance (ANOVA) for continuous variables and the chi-square test was used for categorical variables.
Total mortality between the years 2014 and 2019 was assessed as cumulative proportional probability of development of death and analyzed using Kaplan–Meier’s survival curves for sST2 tertiles. Statistical significances of the Kaplan–Meier survival curves were calculated by using the log-rank test. The association between the sST2 tertile groups and risk of death during the follow-up time was estimated with the Cox proportional hazards models.
Results
Characteristics of the study population
The main characteristics of both baseline and follow-up study populations are presented in . Metabolic syndrome was defined by criteria presented by the International Diabetes Federation (IDF) [Citation15].
Table 1. Main characteristics of the baseline and follow-up study population.
From the baseline subject group (n = 1045), 11.3% suffered from coronary artery disease, 51.7% were hypertensive, 26.6% had a BMI of 30 or over and 10.1% had diagnosed diabetes. In addition, 37.2% had metabolic syndrome, 31.0% of the subjects fulfilled IDF triglyceride criteria (>1.7 mmol/L) and 30.2% had low HDL levels according to IDF criteria.
In the follow-up study population (n = 600), 31.7% suffered from CV disease, 75.0% were hypertensive, 37.5% had a BMI of 30 or more and 36.0% had diagnosed diabetes. In addition, 62.0% had metabolic syndrome, 20.0% of the subjects fulfilled IDF triglyceride criteria (>1.7 mmol/L) and 19.2% had low HDL levels according to IDF criteria.
Cancer status was evaluated in the follow-up stage of the study, where all in all 20.7% of the study population had diagnosed cancer. Skin cancer was the most prevailing cancer type with breast- and prostate cancer coming in second.
Association of baseline factors with sST2 in the follow-up
Several variables measured at baseline (years 1991–1993) were associated with plasma levels of ST2 measured in the follow-up examination (years 2013–2014). In the linear regression analysis, male gender (p < .001), diabetes (p = .024), QUICKI (p < .001), BMI (p < .001), waist circumference (p < .001), hepatosteatosis (p < .001), smoking (p < .001), alcohol consumption (p = .018), systolic- (p < .001) and diastolic blood pressure (p < .001), levels of creatinine (p = .001), total- (p = .033), HDL- (p = .002) and LDL cholesterol (p = .020), triglycerides (p < .001), hsCRP (p = .003), fasting glucose (p = .001) and insulin (p < .001), ALAT (p < .001) and use of antihypertensive medication (p = .003), were significantly associated with sST2 levels (). Including all baseline parameters that were significant in the univariate analysis, smoking alone retained a significant association with the risk of developing fibrosis in the multivariate linear regression analysis model. In addition, baseline atrial natriuretic peptide (ANP) values were not associated with elevated sST2 concentrations in the follow-up.
Table 2. Baseline classical and metabolic risk predictors of follow-up plasma ST2 levels in univariate and multivariate regression models.
Association of parameters determined at the follow-up visit (years 2013–2014) with sST2 levels
Parameters that showed association with sST2 levels included male gender (p < .001), diabetes (p < .001), QUICKI (p < .001), BMI (p = .013), waist circumference (p < .001), ALAT (p < .001), tobacco (p = .001) and alcohol (p = .042) consumption, exercise during free time (p < .001), levels of creatinine (p < .001), total (p = .014) and HDL cholesterol (p = .047), hsCRP (p < .001), plasma glucose (p = .002) and serum insulin (p < .001), eGFR (p = .010) and use of antihypertensive medication (p = .003) (). Including all parameters that were significant in the univariate analysis, in the multivariate linear regression analysis model, male gender, diabetes, quick-index, levels of ALAT, HDL-cholesterol and hsCRP retained a significant association with the risk of fibrosis.
Table 3. Association of classical and metabolic risk factors with plasma ST2 levels at follow-up examination, in univariate and multivariate regression models.
During the 21-year follow-up, 46 subjects continued, 98 had quit and 456 remained as non-smoking. There were no differences in sST2 levels between these groups. There was a positive correlation between follow-up smoking pack years and log transformed sST2 levels (Pearson’s correlation (r) = 0.141, p = .001).
Association of follow-up glucose tolerance groups with fibrosis
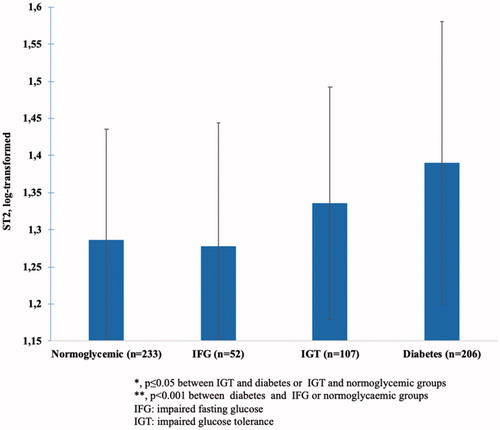
An association between glucose tolerance groups and plasma sST2 levels existed. Elevated sST2 levels in diabetic patients (p < .001 for trend) compared to those with normoglycemia (p < .001) and IGT (p < .05) were observed. Patients with IGT also had higher plasma ST2 levels than normoglycemic patients (p≤.05).
After adjustment for gender, QUICKI, ALAT, HDL-cholesterol and hsCRP levels the significant association between glucose tolerance groups and plasma ST2 levels persisted (p < .001). Further, adjustment for age and waist circumference did not alter the results. These results are portrayed in .
Figure 2. The association of follow-up glucose tolerance groups with plasma levels of sST2.
Association of other follow-up diseases with sST2
All significant parameters (gender, diabetes status, QUICKI, ALAT, HDL-cholesterol and hsCRP levels) that were independently associated with plasma levels of sST2 were taken into account in the association analysis with diseases. Classical risk factors (age, sex, hypertension, LDL-cholesterol, smoking) were added to the model, when CV disease was considered. Plasma (log-transformed) sST2 levels were higher with subjects suffering from coronary artery disease (p = .018), had any evidence of CV disease (p = .031) or cancer (p = .021) in the follow-up stage (). Elevated sST2 levels were associated with a lower ( < 24) score in the MMSE test (p < .03) before adjustments. The association between MMSE class ( < 24 and ≥24) persisted after adjustment for age, sex and hsCRP (p = .046) (). However, after the inclusion of diabetes status, the association became non-significant.
Table 4. Association of plasma sST2 (log-transformed) levels with follow-up diseases in multivariate model.
In addition, we tested the correlation of sST2 levels and liver fibrosis. sST2 levels correlated with the NFS (r = 0.176; p < .001: n = 598), but not the liver TE measurement (r = 0.207; p = .058; n = 86).
sST2 tertile groups and the risk of death
Mortality was followed in the second phase of the study between 2013 and 2014 and again in 2019. In the year 2014, 241 subjects had died, 7.8% due to CV reasons. In 2019, 364 subjects had died.
Kaplan–Meier’s estimate survival analysis
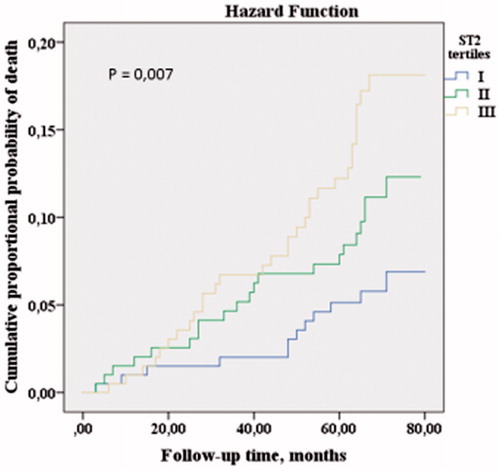
The Kaplan–Meier estimate analysis was used to estimate the cumulative probability of death. During the follow-up time (between the years 2013–2014 and 2019), subjects belonging to the lowest sST2 tertile had lower mortality, while subjects belonging to the highest sST2 tertile, had higher mortality (log-rank p = .007, ).
Figure 3. sST2 tertile groups and the risk of death.
Cox regression model analysis
Total mortality was assessed by the Cox proportional hazard survival model analysis. sST2 (log-transformed) was an independent predictor of total mortality (HR 9.4; 95% CI 2.8–31.4, p < .001) when age, gender, diabetes, smoking, QUICKI, levels of ALAT, HDL-cholesterol and hsCRP were added as covariates.
Discussion
In the present study, we show that several baseline and follow-up variables were associated with plasma levels of sST2. Soluble ST2, a member of the IL-1 superfamily, is a novel biomarker, which has previously shown predictive value in cardiac insufficiency and myocardial infarction-related mortality [Citation16]. Elevated ST2 levels were linked to several CV risk factors such as male gender, overall and abdominal obesity, unhealthy lifestyle (smoking and alcohol consumption), blood pressure and use of antihypertensive medication, renal insufficiency, dyslipidemia, inflammation, insulin resistance and T2D as well as liver adiposity. In addition, sST2 seems to be a sufficient marker for total mortality.
During the 20-year follow-up, life-time smoking burden remained as the only risk factor for predicting the risk of developing fibrosis in the future, when other significant univariate parameters were included in the multivariate model. The increase of sST2 levels does not specify the location of damage; however, the effects of smoking are also vast and seen throughout the body. Therefore, the increase of concentration may predict and suggest more widespread problems.
Previous studies have established a link between elevated sST2 levels and T2D [Citation17], as was observed in our study. In addition, we found that subjects with IGT had higher sST2 levels compared to normoglycemic subjects; however, this association was not equally as strong. As with smoking, sST2 levels have an array of reasons to be elevated in diabetic subjects. Adjustment for insulin sensitivity index, hsCRP and waist did not alter the result, suggesting that T2D is independently associated with elevated sST2 levels. Higher sST2 values could indicate a higher general complication risk or give information on the progression of the disease.
In the follow up examination, elevated sST2 levels correlated moderately with the NFS, but not with the liver TE measurement. This could suggest that sST2 may not be a sufficient indicator of liver fibrosis, although it reflects liver adiposity. However, TE was successfully performed in only 86 patients when NFS was tested from 598 subjects. The lack of significance for TE may be due to lack of power. In addition, since the TE examination was only performed to a small group, while sST2 was measured from 598 subjects, the result may be a false negative. NAFLD has been associated with multiple metabolic complications and comorbidities such as myocardial remodeling, heart failure and kidney disease [Citation18]. Elevated sST2 values in NAFLD could be due to fibrosis caused by pre-existing metabolic factors.sST2 levels were found to be elevated in patients suffering from cancer during the follow-up examination. Skin-, breast- and prostate cancer were the most prevailing cancer types in our study. In previous studies, the IL-33/ST2 pathway has been associated with several types of cancer including glioblastoma, leukemia and breast cancer [Citation19]. The signaling pathway has also been found to have both pro-and anti-tumorigenic effects depending on the site of tumorigenesis [Citation20]. However, it remains unclear, if sST2 levels are elevated due to cancer itself or other systemic pathologies of the subjects.
Previous studies have shown elevated sST2 levels to be associated with worse prognosis within patients suffering from different CV diseases, especially heart failure [Citation2]. In our study, subjects with coronary artery disease or with any evidence of CV disease, were found to have elevated sST2 concentrations. Higher concentrations are linked to pathophysiological processes in CV diseases including fibrosis, myocardial stretch, harmful remodeling, inflammation, impaired hemodynamics and vascular diseases. Thus, as a prognostic marker, elevated plasma values reflect a more adverse phenotype of the disease and a higher risk for complications. This has been seen especially in patients suffering from heart failure. In addition, sST2 has been found to have prognostic value in both short- and long-term outcomes as well as in acute and chronic CV diseases. As a diagnostic marker for CV diseases, sST2 has not been found to be sufficient, since it lacks specificity [Citation16]. In addition, baseline ANP values did not predict elevation of sST2 concentrations in the follow-up. Other CV biomarkers such as troponin were not measured or included in our study, which is a limitation.
In the follow-up examination, we identified a cross-sectional connection between elevated sST2 concentrations and cognitive impairment characterized by a mini mental score of ≤24 points. In the central nervous system, sST2 is expressed by endothelial cells, microglia and astrocytes [Citation21]. Mild cognitive impairment (MCI) is described as a stage of pre-dementia and is symptomatic. Some diagnostic biomarkers for MCI have been presented in literature, although they are not in widespread clinical use yet. Patients diagnosed with MCI at any point have a higher risk of developing dementia than healthy subjects. This could suggest that MCI patients already have pathophysiological brain alterations, that cannot be portrayed otherwise [Citation22]. sST2 could act as a prognostic factor for the development of MCI into dementia or for example Alzheimer’s disease (AD). The IL-33/ST2 pathway has been found to be present in AD with more IL-33 and ST2 positive cells in AD brains compared to healthy subjects [Citation23]. However, in the present study, the association between elevated sST2 levels and cognitive decline became a non-significant trend after the inclusion of T2D status. It is possible, that T2D has a more effect on sST2 values than MCI. On the other hand, a connection between T2D and MCI has been previously established with T2D subjects having poorer cognitive performance than healthy controls. In addition, T2D subjects had an increased risk for developing dementia [Citation24]. However, the mechanisms linking the conditions are unclear; insulin signaling as well as low-grade inflammation have been suggested [Citation25].
Even if traditional risk factors that increase mortality were included in the analysis sST2 maintained its position as a marker for all-cause mortality and therefore can be considered an independent marker for total mortality. An individual could possess various risk factors or suffer from a pre-stage disease without being diagnosed with a specific illness. In this case, sST2 could give us prognostic information on the mortality of the individual before any particular disease is diagnosed. Similar data on the association of sST2 and mortality has been published by Chen et al. [Citation26].
Conclusions
In conclusion, sST2 is too unspecific to function as a diagnostic marker for individual diseases. However, since the concentrations are elevated due to multiple reasons, it could give us information on the overall systemic condition of the patient and therefore may serve as a prognostic biomarker, giving information on the possible complications and progression of the disease. Plasma ST2 levels seem to correspond to several metabolic factors and states, which are very much intertwined and appear to serve as risk factors for each other. sST2 could be used as a marker for widespread damage due to metabolic syndrome; its complications and comorbidities that can ultimately be fatal. Indeed, we found sST2 to be an independent predictor of total mortality. All in all, as a biomarker, sST2 could be used to analyze the overall health, complication risk and ultimately the death of an individual.
Disclosure statement
No potential conflict of interest was reported by the author(s).
References
- Wynn TA, Ramalingam TR. Mechanisms of fibrosis: therapeutic translation for fibrotic disease. Nat Med. 2012;18(7):1028–1040.
- Dattagupta A, Immaneni S. ST2: current status. Indian Heart J. 2018;70:S96–S101.
- Pascual-Figal DA, Januzzi JL. The biology of ST2: the international ST2 consensus panel. Am J Cardiol. 2015;115(7 Suppl.):3B–7B.
- Aimo A, Migliorini P, Vergaro G, et al. The IL-33/ST2 pathway, inflammation and atherosclerosis: trigger and target? Int J Cardiol. 2018;267:188–192.
- Pusceddu I, Dieplinger B, Mueller T. ST2 and the ST2/IL-33 signalling pathway-biochemistry and pathophysiology in animal models and humans. Clin Chim Acta. 2019;495:493–500.
- Kotsiou OS, Gourgoulianis KI, Zarogiannis SG. IL-33/ST2 axis in organ fibrosis. Front Immunol. 2018;9:2432.
- Mueller T, Jaffe AS. Soluble ST2 – analytical considerations. Am J Cardiol. 2015;115(7):8B–21B.
- Lin YH, Zhang RC, Hou LB, et al. Distribution and clinical association of plasma soluble ST2 during the development of type 2 diabetes. Diabetes Res Clin Pract. 2016;118:140–145.
- Alberti KG, Zimmet PZ. Definition, diagnosis and classification of diabetes mellitus and its complications. Part 1: diagnosis and classification of diabetes mellitus provisional report of a WHO consultation. Diabetes Med. 1998;15(7):539–553.
- Katz A, Nambi SS, Mather K, et al. Quantitative insulin sensitivity check index: a simple, accurate method for assessing insulin sensitivity in humans. J Clin Endocrinol Metab. 2000;85(7):2402–2410.
- Angulo P, Hui JM, Marchesini G, et al. The NAFLD fibrosis score: a noninvasive system that identifies liver fibrosis in patients with NAFLD. Hepatology. 2007;45(4):846–854.
- Folstein MF, Folstein SE, McHugh PR. “Mini-mental state”. A practical method for grading the cognitive state of patients for the clinician. J Psychiatr Res. 1975;12(3):189–198.
- Vasunta R-L, Kesäniemi YA, Ylitalo A, et al. Nondipping patter and carotid atherosclerosis in a middle-aged population: OPERA study. Am J Hypertens. 2012;25(1):60–66.
- Rantala AO, Kauma H, Lilja M, et al. Prevalence of the metabolic syndrome in drug-treated hypertensive patients and control subjects. J Intern Med. 1999;245(2):163–174.
- Leinonen T, Kesäniemi YA, Hedberg P, et al. Serum ghrelin and prediction of metabolic parameters in over 20-year follow-up. Peptides. 2016;76:51–56.
- Pascual-Figal DA, Lax A, Perez-Martinez MT, et al. Clinical relevance of sST2 in cardiac diseases. Clin Chem Lab Med. 2016;54(1):29–35.
- Fousteris E, Melidonis A, Panoutsopoulos G, et al. Toll/interleukin-1 receptor member ST2 exhibits higher soluble levels in type 2 diabetes, especially when accompanied with left ventricular diastolic dysfunction. Cardiovasc Diabetol. 2011;10(1):101.
- Friedman SL, Neuschwander-Tetri BA, Rinella M, et al. Mechanisms of NAFLD development and therapeutic strategies. Nat Med. 2018;24(7):908–922.
- Bai F, Ba F, You Y, et al. Decreased ST2 expression is associated with gastric cancer progression and pathogenesis. Oncol Lett. 2019;17:5761–5767.
- Larsen KM, Minaya MK, Vaish V, et al. The role of IL-33/ST2 pathway in tumorigenesis. Int J Mol Sci. 2018;19(9):2676.
- De la Fuente M, MacDonald TT, Hermoso MM. The IL-33/ST2 axis: role in health and disease. Cytokine Growth Factor Rev. 2015;26(6):615–623.
- Roberts R, Knopman DS. Classification and epidemiology of MCI. Clin Geriatr Med. 2013;29(4):753–772.
- Xiong Z, Thangavel R, Kempuraj D, et al. Alzheimer's disease: evidence for the expression of interleukin-33 and its receptor ST2 in the brain. J Alzheimers Dis. 2014;40(2):297–308.
- Moheet A, Mangia S, Seaquist ER. Impact of diabetes on cognitive function and brain structure. Ann N Y Acad Sci. 2015;1353:60–71.
- Vieira MNN, Lima-Filho RAS, De Felice FG. Connecting Alzheimer's disease to diabetes: underlying mechanisms and potential therapeutic targets. Neuropharmacology. 2018;136(Pt B):160–171.
- Chen LQ, de Lemos JA, Das SR, et al. Soluble ST2 is associated with all-cause and cardiovascular mortality in a population-based cohort: the Dallas Heart Study. Clin Chem. 2013;59(3):536–546.