
Abstract
A few studies have examined biomarkers in patients with myocardial infarction (MI) and peripheral artery disease (PAD), i.e. multisite artery disease (MSAD). The aim of the study was firstly, to associate biomarkers with the occurrence of PAD/MSAD and secondly, if those can, in addition to clinical characteristics, identify MI patients with MSAD.In two prospectively observational studies including unselected patients with recent MI, PAD was defined as an abnormal ankle–brachial index (ABI) score (<0.9 or >1.4). The proximity extension assay (PEA) technique was used, simultaneously analyzing 92 biomarkers with association to cardiovascular disease. Biomarkers were tested for univariate associations with PAD. Random forest was used to identify biomarkers with a higher association to PAD. The additional discriminatory accuracy of adding biomarkers to clinical characteristics was analyzed by the c-statistics. Nine biomarkers were identified as significantly associated with MSAD/PAD in the primary patient cohort, analyzed early after the MI. In the prediction analysis, six biomarkers were identified associated with PAD. Three of these; Tumor necrosis factor receptor (TNFR-1), Tumor necrosis factor receptor 2 (TNFR-2) and Growth Differentiation Factor 15 (GDF-15) improved c-statistics when added to clinical characteristics from 0.683 (95% CI 0.610–0.756) to 0.715 (95% CI 0.645–0.784) in the primary patient cohort with a similar result, 0.729 (95% CI 0.687–0.770) to 0.752 (95% CI 0.771–0.792) in the secondary patient cohort. Biomarkers associated with inflammatory pathways are associated with MSAD in MI patients. Three biomarkers of 92; TNFR-1, TNFR-2 and GDF-15, in this exploratory added information in the prediction of MSAD and emphasis the importance of further studies.
Introduction
Atherosclerosis is a systemic disease that often occurs in more than one location, i.e. multisite artery disease (MSAD). In patients with coronary artery disease (CAD), those with more widespread atherosclerosis have worse cardiovascular (CV) outcomes than patients with CAD alone [Citation1]. Peripheral artery disease (PAD) is common in patients with CAD with a varying prevalence (12–29%) and associated with a worse outcome than CAD alone [Citation2–6]. A difference in pathophysiology in different locations of atherosclerosis may be of importance [Citation7]. Moreover, biomarkers reflecting different pathophysiologic mechanisms may be associated with PAD [Citation8,Citation9]. For example, some data suggest that inflammatory activity is higher in patients with PAD compared to CAD [Citation10], but the overall importance of biomarkers is not well described.
In patients with the acute coronary syndrome (ACS) the ability to verify diagnosis with measurement of biomarkers, and their rise and fall, is well known [Citation11]. The primary aim of this exploratory study was to evaluate whether biomarkers are associated with the occurrence of PAD, as a measure of MSAD when evaluated early after a myocardial infarction (MI). The second aim was to evaluate if those biomarkers, in addition to clinical characteristics, could identify MI patients with MSAD.
Patients and methods
Subjects
REBUS study
Three-hundred and ninety out of 421 consecutive patients with non-ST-elevation myocardial infarction (NSTEMI) or ST-elevation myocardial infarction (STEMI) included in the REBUS study (relevance of biomarkers for future risk of thromboembolic events in unselected post-myocardial infarction patients) with the examination of coronary and peripheral arteries were included in the present study. REBUS was a single-center observational study carried out at the Department of Cardiology at Uppsala University Hospital, Sweden [Citation12]. MI was diagnosed according to the third universal definition [Citation13]. The patients were included 3–5 days after the index MI and followed up for two years. An early follow-up visit was performed at 2–3 weeks after inclusion in the study, and subsequent follow-up visits were at 3, 12, and 24 months after the index event. Information of baseline demographics, including co-morbidities and blood samples, were collected at inclusion. The study was approved by the local ethical committee and conducted in accordance with the ethical principles of the Declaration of Helsinki (Dnr 2009/210).
VaMIS study
The cohort for validation of the biomarker data in the REBUS study was 766 out of 1008 participants in the VaMIS (Västmanland Myocardial Infarction Study) [Citation1]. All patients ≥18 years of age, diagnosed with an acute MI, and admitted to the coronary care unit of Västmanland County Hospital, Västerås Sweden, were eligible for inclusion [Citation1]. MI was diagnosed according to the criteria by electrocardiogram and troponin I level as the biomarker criterion [Citation13]. The patient’s medical history and lifestyle were assessed through a standard questionnaire during the index hospitalization. The self-reported data was confirmed from medical records. Blood samples were obtained at admission to the hospital. The study complied with the Declaration of Helsinki. The study was approved by the local ethical committee (Dnr 2005/169).
Evaluation of atherosclerosis
Atherosclerosis in the vascular beds was categorized as previously described in detail [Citation1,Citation2]. In summary, coronary artery disease was classified from coronary angiography findings as normal (0–29%), non-significant stenosis (30–50%), or significant stenosis (>50%), and/or occlusion. The patients in the REBUS cohort were then categorized into two groups: normal findings or abnormal findings including non-significant and significant stenosis or occlusion. In the VaMIS cohort irregularities between 0–20% were classified as normal. PAD was evaluated in all patients by measuring the ankle–brachial index (ABI) at rest, 2–3 weeks after the index event in REBUS and within 25 days of enrollment in VaMIS. ABI was calculated by dividing the highest ankle systolic blood pressure in each leg by the highest brachial systolic pressure and PAD was defined as an abnormal ABI score (<0.9 or >1.4) in at least one leg [Citation14]. MSAD was defined as patients with the simultaneous presence of clinically relevant atherosclerotic lesions in at least two major vascular territories. In the present study where all patients had an MI and had PAD, these patients were defined as having MSAD.
Blood sampling
Rebus
Blood samples were collected in EDTA plasma tubes by direct puncture with no stasis at inclusion in the study, 3–5 days after index MI and at a follow-up 3 months after the index event. The tubes were centrifuged at 2000 g for 10 min and the plasma was stored within 2 h in −80 °C until further analysis.
VaMIS
Blood samples were collected at admission to the hospital in 5 ml lithium heparin-coated vacuum tubes. The tubes were centrifuged at 2000 g for 10 min. Plasma was frozen and stored at −70 °C within 2 h until further analysis.
Proteomics
Measurement of protein biomarkers in plasma in the REBUS cohort was performed using the Target 96 Multiplex CVD III 96˟96 proximity extension assay (PEA), and in VaMIS the Target 96 Multiplex CVD I 96˟96 kit (both Olink Proteomics, Uppsala, Sweden; www.olink.com/products/cvd-I and cvd-III-panel), both described earlier [Citation15–17], at the Clinical Biomarkers Facility, Science for Life Laboratory, Uppsala University, Uppsala, Sweden. The CVD III and CVD I assay measures together 184 proteins related to cardiovascular disease; however, 34 of these proteins are overlapping between the two panels. The plasma tubes differ in the two populations, with lithium heparin plasma in the VaMIS cohort and EDTA plasma in the Rebus study. In the PEA technique heparin is diluted to a minimal concentration in the first steps of the assay and thus the influence of the heparin does not affect the results in the analyses. Therefore, the results from the EDTA and lithium heparin samples are comparable. The PEA technology uses pairs of antibodies that are equipped with DNA reporter molecules. Target binding of both antibodies in pair generates double-stranded DNA amplicons which are quantified using a Fluidigm Biomark HD real-time PCR platform. The PEA technique has a major advantage in that only correctly matched antibody pairs give rise to a signal, yielding an exceptionally high specificity and sensitivity [Citation18,Citation19]. This platform provides normalized protein expression (NPX) data where a high protein value corresponds to a high protein concentration but not an absolute quantification. The method has reproducibility and repeatability with mean intra-assay and inter-assay coefficients of variation of 8% and 12% [Citation18].
Statistics
For the primary analyses, the REBUS study was used as the discovery sample and the VaMIS was used only for the validation analyses. Differences in baseline characteristics are presented as median and range for continuous variables, and frequency and percentage for categorical values. A total of 92 biomarkers (CVD III panel) were included in the statistical analyses. The very few missing values (two for elafin and cathepsin D) were filled by single imputation [Citation20] using chained equations, with age, gender and all biomarkers as predictors. Biomarkers were tested for univariate association with PAD using Mann–Whitney tests. To correct for multiplicity, we used permutation [Citation21] methods.
In the prediction model, we used all biomarkers simultaneously, to identify patients with PAD, as a measure of patients with MSAD. Taken into consideration that there are few patients for the number of predictors, standard logistic regression is likely to lead to severe overfitting. Instead, we used random forest, a flexible machine learning technique that builds prediction models by averaging over a large number of classification trees, built by the recursive binary splitting of the biomarkers. Heterogeneity between trees is induced by a combination of bootstrap and random selection of biomarker split candidates. This statistical method also corrects for multiplicity, for details, see reference [Citation22]. The Random forest also gives a variable importance plot, ranking the predictors according to how valuable they have been in predicting the outcome, i.e. patients with PAD as a measure of MSAD. As a performance measure of the Random forest, we computed the c-statistics. From the plot of variable importance, a number of biomarkers with a higher discriminatory accuracy (i.e. the ones nearest 100%) were chosen and validated in the VaMIS cohort. In CVD I (VaMIS cohort) the values of the biomarkers were standardized within the OLINK panels. The purpose of the validation was to assess if the predictive ability, adding the selected biomarker to the clinical characteristics, as measured by the c-statistics, had a similar increase in both cohorts. In the validation step, three levels of adjustment were calculated using logistic regression; Model I with age, sex, smoking, hypertension, diabetes as clinical characteristics. Model II included the above-mentioned characteristics and a biomarker one by one. Model III included the risk factors and the group of three biomarkers. Odds ratios (ORs) for clinical characteristics from these validation models were compared to assess potential differences between the two cohorts. All statistical analyses were performed in R, cf. Section 13.
Results
Baseline characteristics of the patient cohorts
The clinical characteristics of the REBUS and VaMIS cohorts are shown in . In the REBUS cohort, the median age was 66.8 years with no difference between the sexes. Twenty-seven (31.0%) of the women were smokers and 25 (28.7%) had an abnormal ABI compared to men 72 (23.8%) and 53 (17.5%) respectively. Compared to the REBUS cohort the patients in VaMIS, especially women, were older. There were fewer patients with hypertension and fewer smokers and a larger proportion of NSTEMI.
Table 1. Clinical characteristic in the REBUS and the VaMIS cohort.
Biomarkers associated with multisite artery disease
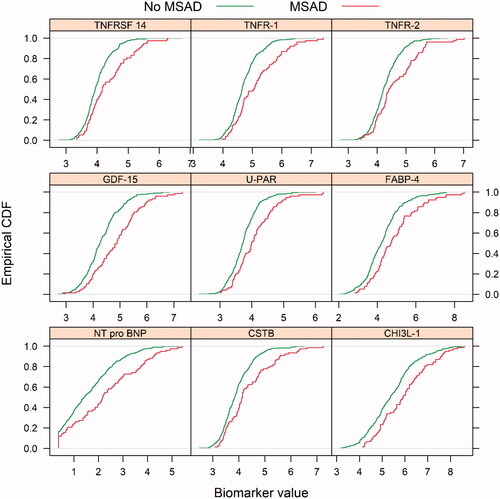
The biomarkers associated with MSAD were identified in the REBUS cohort. In the univariate analyses comparing the profile of all the 92 biomarkers in the CVD III chip in the samples collected in inclusion (3–5 days after the index MI) in the REBUS cohort, there was a significant difference overall (p < .001) between the patients with and without MSAD. The following individual biomarkers were highly significant; Tumor necrosis factor superfamily member 14 (TNFRSF-14), Tumor necrosis factor receptor 1 (TNFR-1), Tumor necrosis factor receptor 2 (TNFR-2), Growth differentiation factor 15 (GDF-15), Urokinase plasminogen activator surface receptor (UPAR), Fatty acid-binding protein adipocyte (FABP-4), NT-pro BNP, Cystatin B (CSTB), Chitinase-3-like protein 1(CHI3L-1) (Supplement Figure 1). The estimator of the Cumulative Distribution Function (ECDF) plots for each biomarker are presented in . When biomarkers were analyzed after 3 months there was less difference between patients with and without MSAD, but the biomarkers described above were still at the top of the biomarkers with most differences (Supplement Figure 2).
Figure 1. Empirical cumulative density function (ECDF) plots of the significant biomarkers: TNFRSF-14: tumor necrosis factor receptor superfamily member 14; TNFR-1: tumor necrosis factor receptor 1; TNFR-2: tumor necrosis factor receptor 2; GDF-15: growth differentiation factor 15; UPAR: urokinase plasminogen activator surface receptor; FABP-4: fatty acid-binding protein adipocyte; Nt-pro BNP, CSTB, Cystatin B, CHI3L, chitinase-3-like protein 1, in the univariate analysis in patients with and without multisite artery disease (MSAD), as measured by peripheral artery disease. Patients with MSAD showed a red dotted line and patients without MSAD with a green dotted line.
Biomarkers for prediction of MSAD
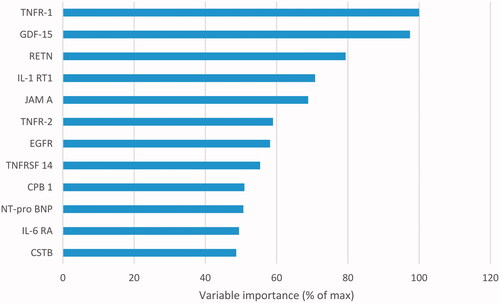
In blood samples collected at inclusion, we identified six biomarkers in REBUS with a higher association to predict MSAD, and these were also available for validation in the VaMIS cohort; TNFRSF-14, TNFR-1, TNFR-2, GDF-15, Interleukin-6 receptor subunit alpha (IL-6 RA), Cathepsin D (CTSD). Results of the Random Forest analyses of the biomarkers in the prediction model are shown in .
Figure 2. Prediction model with random forest for prediction of patients with multisite artery disease, as measured by peripheral artery disease in the REBUS cohort. The biomarkers presented with the highest variable importance: TNFR-1: tumor necrosis factor receptor 1; GDF-15: growth differentiation factor 15; RETN: resistin; IL-1 RT1: interleukin-1 receptor type 1; JAM A: junctional adhesion molecule A; TNFR-2: tumor necrosis factor receptor 2; EGFR: epidermal growth factor receptor; TNFRSF-14: tumor necrosis factor receptor superfamily member 14; CPB 1: carboxypeptidase B; Nt-pro BNP; IL-6 RA: interleukin-6 receptor subunit alpha Nt-pro BNP; CSTB: cystatin B.
The discriminatory accuracy of adding one biomarker at a time to the clinical characteristics as analyzed by the c-statistics is shown in . TNFRSF-14, TNFR-1, TNFR-2 and GDF-15 appeared to have an additive value with slightly higher c-statistics (). When adding the three biomarkers, TNFR-1, TNFR-2 and GDF-15, to clinical characteristics, the c-statistics improved from 0.683 (95% CI, 0.610, 0.756) to 0.715 (95% CI, 0.645, 0.784)
Table 2. Additional predictive value of the biomarkers compared to the performance of the model with clinical characteristics, as measured by the c-statistic.
Biomarker validation in the VaMIS cohort
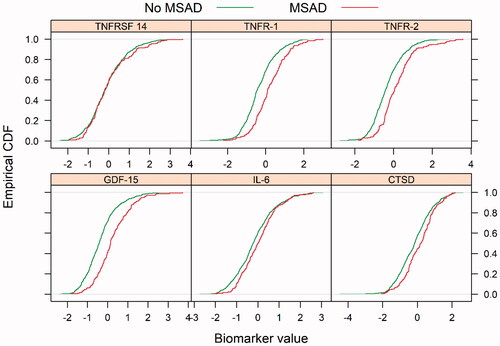
The ECDF plots for the six selected biomarkers, collected at the admission of the patients (TNFRSF-14, TNFR-1, TNFR-2, GDF-15, IL 6-RA, CTSD), are presented in .
Figure 3. Empirical cumulative density function (ECDF) plots for biomarkers; TNFRSF-14: tumor necrosis factor receptor superfamily member 14; TNFR-1: tumor necrosis factor receptor 1; TNFR-2: tumor necrosis factor receptor 2; GDF-15: growth differentiation factor 15; IL-6 RA: interleukin-6 receptor subunit alpha; CTSD: cathepsin D, in patients with and without multisite artery disease (MSAD), measured by peripheral artery disease in the VaMIS cohort. Patients with MSAD showed a red dotted line and patients without MSAD with a green dotted line.
The discriminatory accuracy of adding one biomarker (selected as described) at a time to the clinical characteristics in the VaMIS cohort, as analyzed by the c-statistics is shown in . Of the six biomarkers identified in the REBUS cohort, three could be validated in the VaMIS cohort with a similar pattern with an improvement in c-statistics in both the REBUS and the VaMIS cohort; TNFR-1, TNFR-2 and GDF 15 (). When adding these three biomarkers c-statistics increased from 0.729 (95% CI, 0.867, 0.770) to 0.752 (95% CI, 0.711, 0.792), with a similar pattern in VaMIS, as in the REBUS cohort ().
Discussion
In the present study, using PAD as a measurement of MSAD, we found a significant difference in the profile of biomarkers in MI patients with and without MSAD, both when analyzed early after the MI and after 3 months. Six biomarkers linked to atherosclerosis and inflammation were identified to predict MSAD in MI patients and three of these biomarkers (TNFR-1, TNFR-2, GDF-15) seem to have an additional value to clinical characteristics to better predict MSAD as an outcome when validated in a similar patient cohort. Adding the three biomarkers, as a group, to clinical characteristics increased the c-statistics more compared to a single biomarker.
Clinical characteristics
In clinical characteristics at baseline, there was a difference in the contribution of comorbidities to the prediction of MSAD in our MI cohorts. Although there were fewer patients with hypertension and fewer smokers in the VaMIS cohort, both conditions seemed more important to the outcome compared to the REBUS cohort. The most important explanation was a higher age in the VaMIS cohort, especially among women, and age with the development of less compliant vessels is a well-known risk factor for cardiovascular complications [Citation23]. There is some evidence that even if patients with MSAD are well treated with secondary prevention the risk for new CV events in these patients is not attenuated, part of the explanation could be an increased inflammatory burden [Citation9,Citation10].
Biomarkers
To identify patients with CAD and PAD with their many common risk factors and future risk for CV events, measuring ABI is a simple and highly available method in daily clinical life. Despite this possibility, it is important to further understand all aspects of the role of inflammation in atherosclerotic disease, as in this exploratory study.
With increasing evidence that the immune system participates in atherosclerosis [Citation24,Citation25] with inflammation as an emerging risk factor, many biochemical biomarkers are under investigation. Patients with acute MI have high levels of systemic inflammation, with pro-inflammatory changes in the atherosclerotic plaques, promoting the identification of several biomarkers [Citation26].
A number of biomarkers have been associated with PAD in population-based studies and with different pathways [Citation27], although many of these are also elevated in CAD and other vascular disorders. There is robust data to support that an association of inflammation and thrombosis in patients with PAD exists [Citation8], although there are a few studies with patients with MSAD, i.e. both CAD and PAD assessing biomarkers [Citation9,Citation10]. A central pro-inflammatory biomarker is interleukin 6 (IL-6), which is produced in various tissues by immune-competent cells in response to infection, but also in the atherosclerotic plaques and adipose tissue [Citation28,Citation29]. IL-6 is elevated in patients with MI, and also in patients with PAD [Citation8,Citation30].
Several of the biomarkers found to be stronger associated with MSAD in this study were members of the tumor necrosis factor “family”. TNF alpha (α), is a prototypic member of TNFSF and acts through two transmembrane receptors; TNFR-1 and TNFR-2. TNFR-1 stimulates apoptosis and is responsible for most cellular responses to TNFα including cytotoxicity, cell growth, upregulation of adhesion and cytokine genes [Citation31,Citation32], whereas the TNFR-2 signaling and consequent biological functions are less well characterized [Citation31,Citation33]. In this study, both these receptors were significantly associated with MSAD in the MI patients and the results remained, although less pronounced, after 3 months even though the MI patients already have high levels of inflammatory activity in the acute setting [Citation26]. This may reflect a higher atherosclerotic burden ina patient with MSAD and is to our knowledge not previously described. With the result that the largest difference in biomarkers was seen early after the MI, one can possible argue that it is better to analyze the biomarkers early after the MI, although the difference when the biomarker samples were collected (after 3–5 days and at admission) may have influenced the results.
TNFα augments the expression of chemokines and adhesion molecules necessary to recruit pro-inflammatory monocytes and affect them to migrate to the vessel intima, stimulate differentiation of monocytes into foam cell macrophages and increase oxidized-LDL uptake by macrophages with increased scavenger receptor expression [Citation31,Citation32], processes important in the development of atherosclerosis. TNFα is also associated with cellular apoptosis, resulting in vascular damage and vascular calcification with an unstable atherosclerotic plaque phenotype [Citation32], but also with findings of bone formation in PAD [Citation34]. In the clinical setting, the elevation of TNFα above baseline is associated with a higher risk of CAD, acute MI and heart failure by enhancing inflammation in patients initially healthy, as well as in patients with CAD [Citation32,Citation35,Citation36]. Our results that TNFs was associated with MSAD in the MI cohort might be explained by the different effect of TNFs related to vascular beds and may suggest a possible pathophysiological role of TNFs in patients with MSAD, even though further research is needed. [Citation37]
GDF-15 is a protein belonging to the transforming growth factor-beta (TGF-β) cytokine superfamily. The function of GDF-15 is not fully clear but it seems to have a role among others in regulating inflammatory pathways and apoptosis [Citation38–40], processes observed in cardiovascular disorders. Little is known about the tissues that produce GDF-15 in patients with CV disease, but GDF-15 is expressed in atherosclerotic plaque in the carotid and coronary arteries [Citation39,Citation40]. A high level in patients with both PAD and CAD has previously been significantly associated with an increase in amputation and all-cause mortality [Citation41,Citation42]. In these studies, the higher levels of GDF-15 have been used to predict events whereas in our study the levels of GDF-15 predicted patients with MSAD, i.e. PAD and CAD. GDF-15 has shown to be associated with cardiovascular comorbidities and is a strong prognostic protein in patients with CAD with an association with future CV events [Citation43], but also all-cause mortality and cancer [Citation39,Citation44]. This has been confirmed in a previous study of the VaMIS cohort, where GDF-15 and TRAIL-R2, another TNFSF ligand, were shown to be independent predictors of all-cause mortality [Citation45] .
Conclusion
When screening for biomarkers associated with patients with PAD and recent MI, i.e. patients with MSAD, there was a significant difference in biomarkers overall between patients with and without PAD, with nine biomarkers highly significant. Three biomarkers out of a panel of 92; TNFR-1, TNFR-2 and GDF-15 were identified associated with PAD and may improve prediction of MSAD in addition to clinical characteristics.
When validating our findings in a similar cohort, VaMIS, we found the same pattern with improved c-statistics in the three biomarkers. Explorative screening studies with biomarkers are important and can help us get new information to identify high-risk subgroups of patients, such as patients with MSAD with a particularly high risk of CV events. The findings in this study may suggest a possible pathologic role of these biomarkers (TNFR-1, TNFR-2 and GDF-15), collected early after the MI, to consider in our practice of the atherosclerotic diseases, although further investigation is needed.
Limitations
The present study has several limitations. Firstly, the sample size of the REBUS cohort is limited and the study sample was limited to Caucasian patients with an acute MI, and care should be used in drawing conclusions concerning other age and ethnic groups. Despite this, our findings could be verified in the VaMIS cohort, another MI cohort from a different region of Sweden. However, larger prospective studies with biomarkers as a primary endpoint are needed to confirm our findings. Secondly, the PEA technique does not permit an absolute quantification of the target proteins, so translation into clinically relevant cut-off values is not possible.
Authors’ contribution
BJ and CC contributed equally. BJ, CC, PH, JL, BL, LL, JO and AS contributed to the conception or design of the work. All authors contributed to the acquisition, analysis or interpretation of the data. BJ drafted the manuscript; all other authors critically revised the manuscript. All authors gave final approval and agree to be accountable for all aspects of work ensuring integrity and accuracy.
Supplemental Material
Download PDF (343.9 KB)Disclosure statement
AS had consulting fees from Olink Proteomics, Uppsala, Sweden. The Olink Proteomics had no input on the study design, analyses, interpretation or manuscript preparation. All other authors declared no potential conflicts of interest with respect to the research, authorship, and/or publication of this article.
References
- Calais F, Eriksson Ostman M, Hedberg P, et al. Incremental prognostic value of coronary and systemic atherosclerosis after myocardial infarction. Int J Cardiol. 2018;261:6–11.
- Jonelid B, Johnston N, Berglund L, et al. Ankle brachial index most important to identify polyvascular disease in patients with non-ST elevation or ST-elevation myocardial infarction. Eur J Intern Med. 2016;30:55–60.
- Mukherjee D, Eagle KA, Kline-Rogers E, et al. Impact of prior peripheral arterial disease and stroke on outcomes of acute coronary syndromes and effect of evidence-based therapies (from the Global Registry of Acute Coronary Events). Am J Cardiol. 2007;100(1):1–6.
- Agnelli G, Cimminiello C, Meneghetti G, et al. Low ankle-brachial index predicts an adverse 1-year outcome after acute coronary and cerebrovascular events. J Thromb Haemost. 2006;4:2599–2606.
- Steg PG, Bhatt DL, Wilson PW, et al. One-year cardiovascular event rates in outpatients with atherothrombosis. JAMA. 2007;297(11):1197–1206.
- Berger JS, Abramson BL, Lopes RD, et al. Ticagrelor versus clopidogrel in patients with symptomatic peripheral artery disease and prior coronary artery disease: insights from the EUCLID trial. Vasc Med. 2018;23:523–530.
- Poredos P, Poredos P, Jezovnik MK. Structure of atherosclerotic plaques in different vascular territories: clinical relevance. Curr Vasc Pharmacol. 2018;16:125–129.
- Khawaja FJ, Kullo IJ. Novel markers of peripheral arterial disease. Vasc Med. 2009;14:381–392.
- Grenon SM, Vittinghoff E, Owens CD, et al. Peripheral artery disease and risk of cardiovascular events in patients with coronary artery disease: insights from the heart and soul study. Vasc Med. 2013;18:176–184.
- Rein P, Saely CH, Silbernagel G, et al. Systemic inflammation is higher in peripheral artery disease than in stable coronary artery disease. Atherosclerosis. 2015;239(2):299–303.
- Bob-Manuel T, Ifedili I, Reed G, et al. Non-ST elevation acute coronary syndromes: a comprehensive review. Curr Probl Cardiol. 2017;42:266–305.
- Christersson C, Lindahl B, Berglund L, et al. The utility of coagulation activity for prediction of risk of mortality and cardiovascular events in guideline-treated myocardial infarction patients. Ups J Med Sci. 2017;122(4):224–233.
- Thygesen K, Alpert JS, Jaffe AS, et al. Third universal definition of myocardial infarction. Eur Heart J. 2012;33:2551–2567.
- Schroder F, Diehm N, Kareem S, et al. A modified calculation of ankle-brachial pressure index is far more sensitive in the detection of peripheral arterial disease. J Vasc Surg. 2006;44(3):531–536.
- Lind L, Arnlov J, Lindahl B, et al. Use of a proximity extension assay proteomics chip to discover new biomarkers for human atherosclerosis. Atherosclerosis. 2015;242:205–210.
- Santema BT, Kloosterman M, Van Gelder IC, et al. Comparing biomarker profiles of patients with heart failure: atrial fibrillation vs. sinus rhythm and reduced vs. preserved ejection fraction. Eur Heart J. 2018;39(43):3867–3875.
- Kulasingam A, Hvas AM, Grove EL, et al. Detection of biomarkers using a novel proximity extension assay in patients with ST-elevation myocardial infarction. Thromb Res. 2018;172:21–28.
- Assarsson E, Lundberg M, Holmquist G, et al. Homogenous 96-plex PEA immunoassay exhibiting high sensitivity, specificity, and excellent scalability. PLOS One. 2014;9(4):e95192.
- Lundberg M, Eriksson A, Tran B, et al. Homogeneous antibody-based proximity extension assays provide sensitive and specific detection of low-abundant proteins in human blood. Nucleic Acids Res. 2011;39:e102.
- White IR, Royston P, Wood AM. Multiple imputation using chained equations: issues and guidance for practice. Stat Med. 2011;30:377–399.
- Westfall PH, Young SS. Resampling-based multiple testing: examples and methods for p-value adjustment. United States: John Wiley and Sons; 1993.
- Breiman L. Random forests. Mach Learn. 2001;45(1):5–32.
- Hoefer IE, den Adel B, Daemen MJ. Biomechanical factors as triggers of vascular growth. Cardiovasc Res. 2013;99:276–283.
- Libby P. Inflammation in atherosclerosis. Nature. 2002;420:868–874.
- Kottoor SJ, Arora RR. The utility of anti-inflammatory agents in cardiovascular disease: a novel perspective on the treatment of atherosclerosis. J Cardiovasc Pharmacol Ther. 2018;23:483–493.
- Dutta P, Courties G, Wei Y, et al. Myocardial infarction accelerates atherosclerosis. Nature. 2012;487:325–329.
- Cooke JP, Wilson AM. Biomarkers of peripheral arterial disease. J Am Coll Cardiol. 2010; 55:2017–2023.
- Fanola CL, Morrow DA, Cannon CP, et al. Interleukin-6 and the risk of adverse outcomes in patients after an acute coronary syndrome: observations from the SOLID-TIMI 52 (stabilization of plaque using darapladib-thrombolysis in myocardial infarction 52). Trial J Am Heart Assoc. 2017;6(10):e005637
- Hansson GK. Inflammation, atherosclerosis, and coronary artery disease. N Engl J Med. 2005;352:1685–1695.
- Lindahl B, Toss H, Siegbahn A, et al. Markers of myocardial damage and inflammation in relation to long-term mortality in unstable coronary artery disease. FRISC study group. Fragmin during instability in coronary artery disease. N Engl J Med. 2000;343:1139–1147.
- Parameswaran N, Patial S. Tumor necrosis factor-alpha signaling in macrophages. Crit Rev Eukaryot Gene Expr. 2010;20:87–103.
- Nash M, McGrath JP, Cartland SP, et al. Tumour necrosis factor superfamily members in ischaemic vascular diseases. Cardiovasc Res. 2019;115:713–720.
- Mehta AK, Gracias DT, Croft M. TNF activity and T cells. Cytokine. 2018;101:14–18.
- Han KH, Hennigar RA, O’Neill WC. The association of bone and osteoclasts with vascular calcification. Vasc Med. 2015;20:527–533.
- Kaptoge S, Seshasai SR, Gao P, et al. Inflammatory cytokines and risk of coronary heart disease: new prospective study and updated meta-analysis. Eur Heart J. 2014;35:578–589.
- Safranow K, Dziedziejko V, Rzeuski R, et al. Plasma concentrations of TNF-alpha and its soluble receptors sTNFR1 and sTNFR2 in patients with coronary artery disease. Tissue Antigens. 2009;74:386–392.
- Aboyans V, Criqui MH, Abraham P, et al. Measurement and interpretation of the ankle-brachial index: a scientific statement from the American Heart Association. Circulation. 2012;126:2890–2909.
- Desmedt S, Desmedt V, De VL, et al. Growth differentiation factor 15: a novel biomarker with high clinical potential. Crit Rev Clin Lab Sci. 2019;;56(5):333–350.
- Wollert KC, Kempf T, Wallentin L. Growth differentiation factor 15 as a biomarker in cardiovascular disease. Clin Chem. 2017;63:140–151.
- Kempf T, Bjorklund E, Olofsson S, et al. Growth-differentiation factor-15 improves risk stratification in ST-segment elevation myocardial infarction. Eur Heart J. 2007;28(23):2858–2865.
- Hsu LA, Wu S, Juang JJ, et al. Growth differentiation factor 15 may predict mortality of peripheral and coronary artery diseases and correlate with their risk factors. Mediators Inflamm. 2017;2017:1–13.
- De Haan JJ, Haitjema S, den Ruijter HM, et al. Growth differentiation factor 15 is associated with major amputation and mortality in patients with peripheral artery disease. J Am Heart Assoc. 2017;6:1–10.
- Farhan S, Freynhofer MK, Brozovic I, et al. Determinants of growth differentiation factor 15 in patients with stable and acute coronary artery disease. A prospective observational study. Cardiovasc Diabetol. 2016;15(1):60.
- Wallentin L, Zethelius B, Berglund L, et al. GDF-15 for prognostication of cardiovascular and cancer morbidity and mortality in men. PLOS One. 2013;8(12):e78797.
- Skau E, Henriksen E, Wagner P, et al. GDF-15 and TRAIL-R2 are powerful predictors of long-term mortality in patients with acute myocardial infarction. Eur J Prev Cardiol. 2017;24:1576–1583.