
Abstract
We explored glucometabolic and renal function after engraftment in all 159 consecutive patients with type 1 diabetes who received pancreas transplantation alone (PTA, n = 80) or simultaneous pancreas and kidney transplantation (SPK, n = 79) in Norway from 2012 until 2017. We report fasting levels of plasma glucose (FPG), C-peptide, eGFR and the homeostasis model assessment of insulin sensitivity (HOMA2(%S)) and beta-cell function (HOMA2(%B)) measured one to three times weekly during the first 8 and at 52 weeks after transplantation. One year after engraftment, in the PTA and SPK groups 52 and 64 were normoglycaemic without exogenous insulin, and two and zero patients were dead. Data at the 52-week visit were missing for 5 and 6 patients in the respective groups. During the first 8 weeks, FPG was lower, C-peptide and HOMA2(%S) were higher and eGFR was lower in the SPK group as compared with the PTA group (all p < .05). 30 out of 157 living patients needed insulin treatment 52 weeks after transplantation, 9/79 in the SPK group and 21/78 in the PTA group (p = .02). In conclusion, patients who underwent SPK showed lower insulin sensitivity, but higher insulin secretory capacity and lower mean blood glucose levels the first 8 weeks after transplantation. Also, a higher proportion of patients in the SPK group were insulin-free after 1 year, compared with the PTA group.
Introduction
Simultaneous pancreas and kidney (SPK) transplantation is an established treatment for patients with type 1 diabetes (T1D) suffering from end-stage kidney disease [Citation1–3]. When all conventional treatment options for hyperglycaemia have failed, some transplant centers, offer pancreas transplantation alone (PTA) to patients with life-threatening brittle diabetes with preserved kidney function [Citation4,Citation5]. Successful pancreas transplantation has several advantages both in a short- and long-term perspective, including restoration of normal blood glucose levels without the need for insulin therapy and a reduced risk of developing long-term diabetic complications like retinopathy, neuropathy and nephropathy [Citation6]. Advances in surgical technique and immunosuppressive therapy have improved outcomes after pancreas transplantation during later years, but these procedures still have more postoperative complications and graft failure than other solid abdominal organ transplantations [Citation7,Citation8]. Previous studies have shown that pancreas graft survival is superior following SPK than after PTA [Citation5,Citation9].
The causes of graft failure following PTA are mainly surgical complications during the first weeks after engraftment, followed by acute or chronic rejections or circulatory failure later on [Citation5]. Rejections may be treated by intensified immunosuppressive therapy, however, often the process has emerged too far when rejection is detected [Citation10]. To monitor endocrine graft function for the early detection of failing insulin secretion, different biomarkers, indices and physiological tests are used. Early signs of beta-cell failure or advanced insulin resistance may indicate a poor prognosis for the transplanted endocrine organ.
The aim of the present study was to describe and compare a number of routinely measured biomarkers and derived indices for insulin secretion and action in patients after SPK and PTA. Specifically, we compared fasting plasma glucose (FPG), C-peptide, and the derived measures C-peptide/glucose x creatinine ratio (CPGCR), Homeostasis model assessment of beta-cell function HOMA2(%B), or insulin sensitivity HOMA2(%S) during the first 8 weeks and after 1 year in all patients that underwent either SPK or PTA at our center during a 5 year period. While HOMA-indices are commonly used as indirect measures of insulin secretion and action in a wide variety of settings [Citation11], CPGCR has mainly been used to assess beta-cell function after islet transplantation [Citation12]. It is therefore of interest to examine these parameters in an unselected group of patients that received pancreas transplantation at our national center.
Subjects and methods
All 159 patients who underwent SPK or PTA at Oslo University Hospital, Rikshospitalet, Oslo, Norway, from 1 January 2012 until 31 December 2017 were included in this study. Patients with T1D and measured GFR (mGFR) below 20 mL/min/1.73m2 had been listed as SPK candidates while patients with T1D and ‘brittle-diabetes’ and mGFR >30mL/min/1.73m2 had been listed as candidates for PTA. From September 2012, all recipients received pancreas transplants with duodeno-duodenal exocrine drainage and systemic venous drainage to the inferior cava vein by an iliac allograft vein as an elongation of the portal vein. Both recipient groups were given similar anti-thrombotic and immunosuppressive therapy, including induction therapy with ATG (Thymoglobulin®) and standard maintenance tacrolimus treatment (tacrolimus trough levels of 10–12 tapered to 6–10 µg/L by 8 weeks), mycophenolate mofetil (MMF) 1 g twice daily and steroids (tapered to 10 mg/day by week four and five mg/day by week 26 [Citation5]. Rejection was suspected using clinical parameters and diagnosed by pancreas (or if kidney) biopsy, and treated with i.v. methylprednisolone followed by increased doses of oral corticosteroids, or with ATG as previously described by Nordheim et al. [Citation13]. Patients who lost their pancreas graft, died or were transferred to another hospital were monitored as long as data were obtainable. Data were retrieved from patients’ records and analyses were performed on anonymized data. All patients provided written informed consent before inclusion into the study. The study was approved by the hospital’s Data Protection Officer.
Graft loss was defined as either total (surgical graftectomy or patient death) or partial (insulin treatment with C-peptide concentrations >300 pmol/L at week 52 after transplantation).
Fasting plasma levels of creatinine (P-creatinine) and glucose (FPG) were measured with routine methods, and serum levels of C-peptide with an immunometric assay (Roche Diagnostics), coefficient of variation was 5%. Blood samples for these analyses were collected one to three times weekly during the first eight weeks of follow-up and at the routinely scheduled 1-year follow-up assessment in our department. The following parameters were calculated based on these measured biomarkers: Estimated glomerular filtration rate (eGFR) (CKD-EPI), the quotient of fasting C-peptide/FPG x P-creatinine (CPGCR). CPGCR was calculated since C-peptide levels are affected by kidney function [Citation12]. Homeostasis model assessment of insulin sensitivity (HOMA2(%S)) and beta-cell function (HOMA2(%B)) was calculated by the web-based HOMA 2 calculator [Citation14]. C-peptide was used in these calculations as it is less confounded than insulin following the loss of the missing first-pass effect of the liver in pancreas grafts with caval venous drainage [Citation10]. We recorded prednisolone dose, tacrolimus dose, and tacrolimus through concentrations 8 weeks and 1 year after surgery.
Statistical analyses
Data analyses were performed using SPSS (version 25; IBM, Armonk, NY, USA), Microsoft Excel (version 16.16.5) and R version 4.0.2. Time-course data were analyzed using mixed regression with the lme4 and car R packages. The models were constructed with a random intercept for subjects and random slope for groups. Model fit was assessed using the Akaike and Bayesian information criteria (AIC and BIC). Post-hoc tests were performed using the emmeans R package with Dunnett’s correction for multiple testing. Areas under the curve were calculated from weeks 1 to 8 postoperatively using the trapezoid rule. Figures were constructed and assembled using the GGplot2 and Patchwork R packages, and p < .05 were considered statistically significant.
Results
Baseline characteristics of the two groups are given in . Out of 159 patients who received a pancreas transplant during the study period, 79 underwent SPK and 80 PTA. There were more men than women in the SPK group, while the gender balance was equal in the PTA group. The mean (SD) age for recipients was 42.4 (7.1) years in the SPK and 40.2 (9.8) years in the PTA groups, respectively. The mean BMI (kg/m2) was significantly lower in the SPK group, 23.7 (3.3) compared with 25.5 (3.3) in the PTA group, p < .005. Mean donor BMI did not differ between the two groups, neither did the HLA-mismatch. Only one patient in the SPK group and two in the PTA group had panel-reactive antibodies. The mean cold ischemia time did not differ between the groups.
Table 1. Mean (SD) or percentage of baseline characteristics in patients who underwent pancreas and kidney transplantation (SPK) or pancreas transplantation alone (PTA).
shows the patients’ clinical status during the first year after transplantation. Two patients died (after 12 and 30 weeks) and 11 had an acute surgical complication resulting in graftectomy, all during the first 5 weeks after transplantation (Supplementary Table 1). Further 19 patients needed to re-start insulin treatment for glucose control during the first year. Hence, 116 patients lived with a functioning graft without the need for exogenous insulin at the 1-year follow-up examination. Of the 30 out of 157 living patients who needed insulin treatment, 9/79 were in the SPK group and 21/78 were in the PTA group (p = .02).
Table 2. Clinical status in 159 patients 52 weeks after simultaneous pancreas and kidney transplantation (SPK) or pancreas transplantation alone (PTA).
shows metabolic parameters and immunosuppressive drugs eight and 52 weeks after transplantation in patients without the need for insulin treatment. The mean dose of prednisolone and the mean through concentration of tacrolimus were significantly lower at 52 compared with 8 weeks, reflecting our treatment protocol, and there were no significant differences between the groups. Insulin sensitivity estimated by HOMA2(%S) improved during the same period of time in both groups and the apparent compensatory hypersecretion of insulin was reduced, as signified by a reduction in CPGCR and HOMA2(%B) (not significant in the PTA group).
Table 3. Mean (SD) of glucometabolic parameters and immunosuppressive therapy eight and 52 weeks after transplantation in patients in the SPK and PTA groups.
The PTA group included five patients that received pancreas after a kidney, five that received pancreas after islets, two that received a new pancreas after previous SPK and one that received a new pancreas after previous PTA. The SPK group included three patients that received SPK after a previous kidney transplant. The results were principally unchanged when these 16 patients were removed from the analyses (Supplementary Table 2).
C-peptide levels increased in the PTA group but decreased in the SPK group through 8 weeks post-transplantation (). These time responses were significantly different between the groups. Average C-peptide concentration and area under the curve were higher in the SPK than in the PTA group (). Post-hoc group comparisons revealed significantly higher C-peptide concentration in the SPK versus the PTA group in weeks 1–3, after correction for multiple testing.
Figure 1. Time courses for (A) C-peptide, (B) eGFR and (C) fasting glucose after organ transplantation. Time courses within each group (‘PTA’ and ‘SPK’), the average group difference (‘Group’) and the time by group effect (‘Int’) are annotated on the panels as effect size (Beta = B) with 95% confidence intervals and a corresponding p-value. The right indents represent areas under the curve (AUC) for each group. SPK = Simultaneous pancreas and kidney transplantation, PTA: pancreas transplantation alone. *p < .05, **p < .01 and p < .001. The box-and-whiskers depict median, inter quartile range (IQR) and min and max values (no further than 1.5 × IQR). The thick lines connect the medians. The thin lines represent data from each individual.
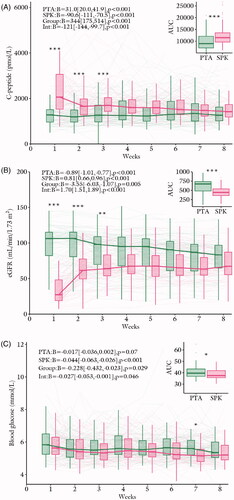
eGFR decreased in the PTA group and increased in the SPK group through the 8 weeks post-transplantation (). These time responses were significantly different between the groups. Average eGFR and area under the curve were lower in the SPK versus the PTA group (). Post-hoc group comparisons revealed significantly lower eGFR in the SPK group compared to the PTA group in weeks 1–3, after correction for multiple testing.
Blood glucose concentrations tended to decrease in the PTA group and decreased in the SPK group through the 8 weeks post-transplantation (). These time responses were significantly different between the groups. Average blood glucose concentration and area under the curve were lower in the SPK versus the PTA group (). Post-hoc group comparisons revealed significantly lower blood glucose concentration in the SPK group versus the PTA group in week 7, after correction for multiple testing ().
CPGCR decreased in the PTA group and increased in the SPK group through the 8 weeks post-transplantation (). These time responses were significantly different between the groups. Average CPGCR and area under the curve did not differ between the groups (). Post-hoc group comparisons revealed significantly lower CPGCR in SPK vs. PTA in week 1, after correction for multiple testing ().
Figure 2. Time courses for (A) CPGCR, (B) HOMA2-%B and (C) HOMA2-%S after organ transplantation. Time courses within each group (‘PTA’ and ‘SPK’), the average group difference (‘Group’) and the time by group effect (‘Int’) are annotated on the panels as effect size (Beta = B) with 95% confidence intervals and a corresponding p-value. The right indents represents areas under the curve (AUC) for each group. SPK = Simultaneous pancreas and kidney transplantation, PTA: pancreas transplantation alone. *p < .05, **p < .01 and p < .001. The box-and-whiskers depict median, inter quartile range (IQR) and min and max values (no further than 1.5 × IQR). The thick lines connect the medians. The thin lines represent data from each individual.
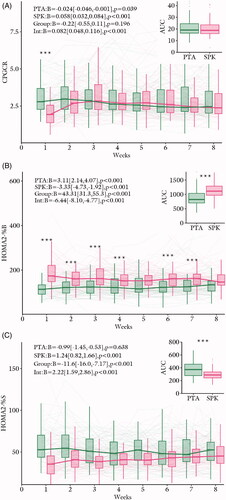
HOMA2(%B) increased in the PTA group and decreased in the SPK group through eight weeks post-transplantation (). These time responses were significantly different between the groups. Average HOMA2(%B) and area under the curve were higher in the SPK vs. the PTA group (). Post-hoc group comparisons revealed significantly higher HOMA2(%B) in SPK vs. PTA in all weeks, except for weeks 5, 6, and 8, after correction for multiple testing ().
HOMA2(%S) remained unaltered in the PTA group and increased in the SPK group through 8 weeks post-transplantation (). These time responses were significantly different between the groups. Average HOMA2(%S) and area under the curve were lower in the SPK vs. the PTA group (). Post-hoc group comparisons revealed no significant differences after correction for multiple testing ().
Discussion
The present study provides novel data showing the development in neurometabolic parameters and eGFR during the first 8 weeks after pancreas transplantation alone or combined with renal transplantation in patients with type 1 diabetes. Furthermore, we show that 80% of the transplanted patients were normoglycaemic without insulin treatment 1 year after transplantation. The data highlight the important interplay between renal function and insulin secretion and action in the early phase after pancreas transplantation.
The transplantation of a whole pancreas aims at restoring normoglycaemia. However, immunosuppressive-induced insulin resistance [Citation15], impaired renal function, and denervation of the transplanted pancreas [Citation16] may negatively affect beta-cell function after transplantation. SPK patients had, as expected, poorer renal function in the early period, but of note also lower average glucose and higher C-peptide levels. This indicates that they were capable of increasing their insulin secretion sufficiently to control blood glucose, despite the insulin resistance induced by poor renal function and immunosuppressant drugs. It is tempting to speculate, that the reduced renal clearance of insulin and C-peptide may contribute to the lower blood glucose levels in the SPK group.
Further, a larger proportion of PTA patients than SPK patients needed insulin treatment 52 weeks after transplantation. These findings support previous findings indicating that receiving a kidney together with a pancreas could play a possible protective role in graft survival and beta-cell function [Citation5,Citation9].
As expected, eGFR improved rapidly after transplantation in the SPK group and eGFR showed a small, but significant reduction during the first 8 weeks in the PTA group. Successful pancreas transplantation restores blood glucose and will contribute to reducing the progression of diabetes nephropathy [Citation17]. Immunosuppression may on the other hand affect renal function negatively [Citation18]. A decline in renal function 5 years after PTA has been reported in previous studies [Citation19]. All patients in our study used a calcineurin inhibitor as one of three immune suppressant drugs according to the protocol after pancreas transplantation. These drugs may be nephrotoxic, and we propose that the early declining eGFR in the PTA group could be due to this effect.
The strength of this study is the inclusion of all patients in Norway who received a pancreas transplant between 2012 and 2017 and the use of similar procedures for immunosuppression and rejection therapy. Another strength is the rather similar baseline characteristics of the two groups of patients undergoing SPK or PTA, making comparisons between the groups of value. The major limitation is that our data-collection ends at the 1-year follow-up. An extended follow-up examination of insulin secretion and the need for exogeneous insulin therapy, and its relation to insulin secretion during the first weeks after transplantation, would be of value. Further, we used indirect parameters derived from simple measurements in peripheral blood to estimate pancreas and renal function and direct measurements of renal function by GFR and insulin secretion and action by glucose clamp, may have given different results. It is well known that the assessment of β-cell secretory capacity in this setting is confounded by the hyperinsulinemia caused by immunosuppressant-induced insulin resistance and the systemic venous drainage that bypasses first-pass hepatic extraction of insulin secreted from the pancreas graft [Citation20]. In addition, renal clearance of both insulin and C-peptide are reduced in patients with reduced renal function compared to healthy controls because of the decreased functional renal mass present and transient high C-peptide levels in SPK-recipients in the early phase after transplantation have been reported previously [Citation21]. Use of the HOMA index to monitor beta-cell function is far from ideal, and these results should be interpreted with caution [Citation11]. Even though CPGCR was originally used in islet transplanted subjects, the combination of C-peptide and glucose levels is recommended for post-transplant follow-up [Citation22] and as it is important to take eGFR into account when interpreting C-peptide levels in transplanted patients; hence the CPGCR may be of value. Our PTA group included some patients who previously had received a kidney transplant and a few patients that previously had received a pancreas or islet transplant. This may have had an impact on our results. We have limited information about the patients between weeks 8 and 52 when they were followed at their local hospitals, for example, we lack information about inter-current virus infections and weight development that may have influenced our results. We therefore cannot assess the impact of low grade or subclinical rejections and other events that may have had an effect on graft function during this period.
To conclude, patients who underwent SPK showed lower insulin sensitivity, but higher insulin secretory capacity and lower mean blood glucose levels the first 8 weeks after transplantation and a higher proportion were insulin-free after 1 year, compared with patients that underwent PTA.
| Abbreviations | ||
| SPK | = | Simultaneous pancreas and kidney transplantation |
| PTA | = | Pancreas transplantation alone |
| ATG | = | Anti-thymocyte globulin |
| MMF | = | Mycophenolate mofetil |
| HOMA(%B) | = | Homeostasis model assessment of beta cell function |
| HOMA(%S) | = | Homeostasis model assessment of insulin sensitivity |
Supplemental Material
Download MS Word (15.8 KB)Disclosure statement
No potential conflict of interest was reported by the author(s).
References
- Dholakia S, Mittal S, Quiroga I, et al. Pancreas transplantation: past, present, future. Am J Med. 2016;129(7):667–673.
- Esmeijer K, Hoogeveen EK, van den Boog PJM, et al. Superior long-term survival for simultaneous pancreas-kidney transplantation as renal replacement therapy: 30-year follow-up of a nationwide cohort. Diabetes Care. 2020;43(2):321–328.
- Lindahl JP, Hartmann A, Horneland R, et al. Improved patient survival with simultaneous pancreas and kidney transplantation in recipients with diabetic end-stage renal disease. Diabetologia. 2013;56(6):1364–1371.
- Dean PG, Kukla A, Stegall MD, et al. Pancreas transplantation. BMJ. 2017;357:j1321.
- Lindahl JP, Horneland R, Nordheim E, et al. Outcomes in pancreas transplantation with exocrine drainage through a duodenoduodenostomy versus duodenojejunostomy. Am J Transplant. 2018;18(1):154–162.
- Jenssen T, Hartmann A, Birkeland KI. Long-term diabetes complications after pancreas transplantation. Curr Opin Organ Transplant. 2017;22(4):382–388.
- Ahmed Aref TZ, Ravi P, Ajay S, et al. Pancreatic transplantation: brief review of the current evidence. World J Transplant. 2019;9(4):81–93.
- Laftavi MR, Gruessner A, Gruessner R. Surgery of pancreas transplantation. Curr Opin Organ Transplant. 2017;22(4):389–397.
- Rw G, Ac G. Pancreas transplant alone: a procedure coming of age. Diabetes Care. 2013;36(8):2440–2447.
- Nordheim E, Birkeland KI, Asberg A, et al. Preserved insulin secretion and kidney function in recipients with functional pancreas grafts 1 year after transplantation: a single-center prospective observational study. Eur J Endocrinol. 2018;179(4):251–259.
- Wallace TM, Levy JC, Matthews DR. Use and abuse of HOMA modeling. Diabetes Care. 2004;27(6):1487–1495.
- Faradji RN, Monroy K, Messinger S, et al. Simple measures to monitor beta-cell mass and assess islet graft dysfunction. Am J Transplant. 2007;7(2):303–308.
- Nordheim E, Horneland R, Aandahl EM, et al. Pancreas transplant rejection episodes are not revealed by biopsies of the donor duodenum in a prospective study with paired biopsies. Am J Transplant. 2018;18(5):1256–1261.
- Oxford TUo. HOMA Calculator. 2018. https://www.dtu.ox.ac.uk/ homacalculator/download.php. Accessed and downloaded February 14, 2019.
- Midtvedt K, Hjelmesaeth J, Hartmann A, et al. Insulin resistance after renal transplantation: the effect of steroid dose reduction and withdrawal. J Am Soc Nephrol. 2004;15(12):3233–3239.
- Luzi L, Battezzati A, Perseghin G, et al. Lack of feedback inhibition of insulin secretion in denervated human pancreas. Diabetes. 1992;41(12):1632–1639.
- Bilous RW, Mauer SM, Sutherland DE, et al. The effects of pancreas transplantation on the glomerular structure of renal allografts in patients with insulin-dependent diabetes. N Engl J Med. 1989;321(2):80–85.
- Chatzizacharias NA, Vaidya A, Sinha S, et al. Risk analysis for deterioration of renal function after pancreas alone transplant. Clin Transplant. 2012;26(3):387–392.
- Le Dinh H, Deroover A, Coimbra C, et al. Evolution of native kidney function after pancreas transplantation alone. Transplant Proc. 2012;44(9):2829–2833.
- Diem P, Abid M, Redmon JB, et al. Systemic venous drainage of pancreas allografts as independent cause of hyperinsulinemia in type I diabetic recipients. Diabetes. 1990;39(5):534–540.
- Hau HM, Jahn N, Brunotte M, et al. Short and long-term metabolic outcomes in patients with type 1 and type 2 diabetes receiving a simultaneous pancreas kidney allograft. BMC Endocr Disord. 2020;20(1):30.
- Rickels MR, Stock PG, de Koning EJP, et al. Defining outcomes for β-cell replacement therapy in the treatment of diabetes: a consensus report on the Igls criteria from the IPITA/EPITA Opinion Leaders Workshop. Transplantation. 2018;102(9):1479–1486.