
Abstract
Many studies have explored how using a pneumatic tube system (PTS) is related to the hemolysis of blood samples, but their conclusions have been inconsistent. This meta-analysis was to clarify whether using a PTS induces the hemolysis of blood samples. The PubMed, Embase, Scopus, CNKI, CqVip, SinoMed and WanFang databases were searched for studies published between January 1970 and August 2019. The primary outcomes were the hemolysis rate and hemolysis index of blood samples after applying a PTS and manual transportation. We estimated the pooled risk ratio (RR) and the standardized mean difference (SMD), using random-effects models. This meta-analysis included 29 studies covering 3121 blood samples. No significant differences were found between the PTS and manual-transportation groups in the hemolysis rate [RR: 0.99, 95% confidence interval (CI): 0.57 to 1.70], hemolysis index (SMD: 0.19, 95% CI: −0.00 to 0.38), or level of potassium (SMD: 0.05, 95% CI: −0.03 to 0.12), alanine aminotransferase (SMD: 0.00, 95% CI: −0.10 to 0.11), or aspartate aminotransferase (SMD: 0.04, 95% CI: −0.08 to 0.17). However, lactate dehydrogenase (LDH) level was significantly higher in the PTS group than in the manual-transportation group (SMD: 0.20, 95% CI: 0.06 to 0.34). Subgroup analysis revealed that the LDH level was clearly higher in the PTS group than in the manual-transportation group only when the PTS speed was ≥6 m/s or when the PTS distance was ≥250 m. According to this meta-analysis, PTSs were associated with alterations in LDH measurements, so it is sensible that each hospital validates and monitors their PTSs.
Introduction
Pneumatic tube systems (PTSs) originated in the postwar industrialization period during the 1950s and 1960s, when they were mainly used in large-scale industrial production facilities such as for electronics products and automobiles. The emergence of computer technology during the 1970s and 1980s led to PTSs beginning to be applied in hospitals due to their reduced turnaround times and cost efficiency [Citation1]. Nowadays PTSs are indispensable in many hospitals for efficiently transporting medical documents, drugs, samples, and other physical items.
Concerns have been raised that a PTS may cause the hemolysis of blood samples that further results in changes to the levels of potassium (K), lactate dehydrogenase (LDH), alanine aminotransferase (ALT), and aspartate aminotransferase (AST), due to factors such as high pressures, fast transportation speeds, and sudden changes in the transportation direction [Citation2,Citation3]. However, other studies found no relationship between using a PTS and hemolysis [Citation4,Citation5]. These discrepancies have prompted debate about whether using a PTS causes hemolysis, and hospital managers are now hesitating to employ PTSs, instead opting for traditional manual transportation that wastes time and energy. In this context, assessing whether a PTS harms sample quality or not is important for physicians and administrators.
The present meta-analysis systematically investigated the relationship between a PTS and the hemolysis of blood samples by analyzing all available studies. The aim was to strengthen the body of evidence for deciding whether or not to utilize PTSs in clinical applications.
Materials and methods
This study was designed and reported in compliance with the PRISMA (Preferred Reporting Items for Systematic Reviews and Meta-Analyses) statement.
Search strategy
We searched the PubMed, Embase, Scopus, CNKI, CqVip, SinoMed and WanFang databases for studies published between January 1970 and August 2019, since PTSs began to be applied in hospitals during the 1970s and 1980s [Citation1]. No language restriction was applied. The search was based on the following combination of keywords: (“pneumatic tube transport*” OR “pneumatic tube conveyor” OR “pneumatic dispatch” OR “pneumatic tube system*” OR “pneumatic tube transport* system*” OR “pneumatic tube delivery system*” OR “pneumatic transport* system*”) AND (hemolysis OR haemolysis OR hemolyse* OR “hemolysis rate*” OR “hemolysis index” OR potassium OR K OR “lactate dehydrogenase” OR LDH OR “alanine aminotransferase” OR ALT OR “aspartate aminotransferase” OR AST). Reference lists of the identified reviews and included studies were screened to identify further relevant studies.
Study selection
Studies that met all of the following criteria were eligible for inclusion: (1) cross-sectional or cohort design; (2) blood samples taken from veins in adult subjects; (3) study contained both PTS and manual transportation groups (another group could also be present); (4) outcomes related to hemolysis induced by a PTS and manual transportation reported, such as the hemolysis rate, hemolysis index, or K, LDH, ALT, or AST level; (5) samples transported by a PTS and manually during similar periods; and (6) data provided on the outcomes of interest to the present study or other estimates that could also be utilized. Duplicate studies were excluded, with the excluded ones involving smaller samples or being published longer ago.
Data extraction
The following relevant information was extracted from the included studies: general information (authors, publication year, and study country), subject details (population and tube type), research design (PTS type, PTS speed, PTS distance, and protective measures applied to the samples), sample size, outcomes (hemolysis rate, hemolysis index, or K, LDH, ALT, or AST level), and measured data. For studies with multiple sets of findings, we extracted only one using the following criteria in order to reduce bias: the optimal PTS speed was 6 m/s, followed by the closest speed to 6 m/s; the optimal PTS distance was 250 m, followed by the distance nearest to 250 m; for the protection of the blood samples, we chose the results of the protected group versus the unprotected ones; and for the type of tubes, we preferred those using lithium, heparin, or serum tube.
Outcomes
The primary outcomes were the hemolysis rate and hemolysis index, which directly reflect the presence of hemolysis in blood samples. Hemolysis refers to the rupturing of erythrocytes, which results in the release of hemoglobin and other intracellular components into the surrounding fluid. When cell-free hemoglobin was higher than 31 µmol/L, it was considered that hemolysis occurred in the study. We defined the hemolysis rate as the number of hemolytic blood samples after transportation divided by the total number of blood samples transported, multiplied by 100%. The secondary outcomes included the levels of K, LDH, ALT, and AST in serum, which indirectly reflect the presence of hemolysis.
Quality assessment
We evaluated the quality of the eligible studies using the assessment tool for cross-sectional studies recommended by the Agency for Healthcare Research and Quality (AHRQ) [Citation6]. The AHRQ scale consists of 11 items, each of which is answered by either yes (1 point) or no/unclear (0 points). The included studies were divided into those of low, medium, and high quality, corresponding to total scores of 0–3, 4–7, and 8–11, respectively. Cohort studies were assessed the Newcastle-Ottawa Quality Assessment Scale [Citation7], which consists of three aspects: subject selection (4 scores), comparability between groups (2 scores), and outcome assessment (3 scores). Scores of more than 5 points were considered to indicate high quality.
Study selection, data extraction, and quality assessment were performed independently by two authors (X.D. and X.W.), with any disagreements resolved by a third person (X.X.).
Data analysis
This meta-analysis was implemented using STATA software (version 14.0, Stata Corporation, College Station, TX, USA). Random-effects models were used to estimate the effect of a PTS on hemolysis. The risk ratio (RR) with its 95% confidence interval (CI) was used to quantify the effect size for the hemolysis rate, and the standardized mean difference (SMD) with its 95% CI was calculated as the effect size for the continuous outcomes of the hemolysis index and the levels of K, LDH, ALT, and AST. If only median and range (interquartile range or probability) values were reported, mean and standard-deviation values were estimated according to the Cochrane handbook [Citation8]. The existence of heterogeneity was evaluated by the chi-square test and quantified using the I2 statistic. If p ≤ .1 or I2 ≥ 50% it was considered that significant heterogeneity existed among the studies.
Studies [Citation9,Citation10] have shown that the amount of hemolysis induced by a PTS is related to its speed and distance and the absence of protection. Therefore, in our meta-analysis, subgroup analyses were also performed for all parameters based on the PTS speed, PTS distance, and the protection of the blood samples. Since there is no uniform classification standard for PTS speed and distance in the literature, we performed subgroup analysis according to the median speed and distance values for the included studies.
Sensitivity analyses tested the robustness of the results by sequentially removing each qualifying study. We assessed publication bias (using funnel plots) when more than seven studies were eligible. When all studies were distributed relatively symmetrically at the bottom of a funnel plot, we considered that no significant publication bias was present. Egger’s tests were performed to quantify the symmetry of the funnel plot. The criterion for statistical significance was set at a probability value of p < .05.
Results
Results selection and study characteristics
A flow chart of the study selection process is shown in . The literature search retrieved 1016 papers: 1011 from various databases and 5 from references. After performing screening, we finally included 29 studies (involving 3121 blood samples) published between 1971 and 2019 in the meta-analysis. Five of the studies were reported in Chinese [Citation11–15], one in Hungarian [Citation16], one in Dutch [Citation17], and the remaining in English [Citation3,Citation5,Citation10,Citation18–36]. Two of the reports were conference proceedings [Citation27,Citation31] while all of the others were journal articles. lists the characteristics of the included studies.
Figure 1. Flowchart of study selection process.
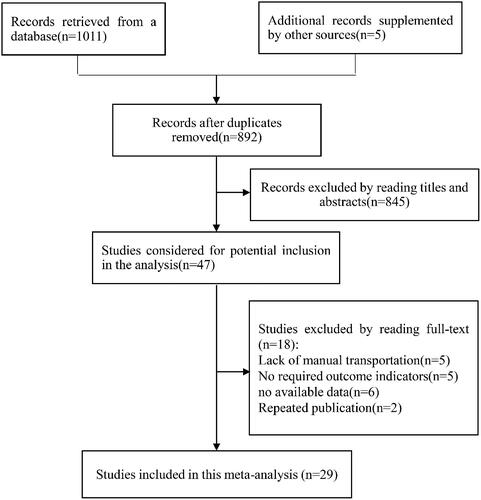
Table 1. The characteristics of the included studies.
Risk-of-bias assessment
Since only cross-sectional studies were included in the analysis, we assessed the risk of bias based on the scale recommended by the AHRQ [Citation6]. The bias scores ranged from 2 to 9 in the 29 studies, with a low risk of bias for 1 study [Citation18], a high risk of bias for 4 studies [Citation14,Citation21,Citation27,Citation31], and a moderate risk for the other 24 studies ().
Meta-analysis of the effect of a PTS on primary outcomes compared with manual transportation
For assessing the hemolysis rate, our meta-analysis enrolled 6 studies [Citation3,Citation10,Citation14,Citation21–23], involving 529 blood samples in the PTS group and 593 in the manual-transportation group. The heterogeneity test produced values of I2 = 43.10% and p = .12, indicating that no significant heterogeneity was present. The results also showed that there was no significant difference between the two groups (RR = 0.99, 95% CI = 0.57 to 1.70, p =0.97) (). Based on the median values for the PTS speed and distance in the included articles, we defined a slow speed as <6 m/s and a short distance as <250 m. Subgroup analysis showed that the hemolysis rate did not differ significantly between the two groups among all of the subgroups based on the PTS speed, PTS distance, and the protection of the blood samples. presents the results of the subgroup analyses of the hemolysis rate, hemolysis index, and K, LDH, ALT, and AST levels for the PTS group vs the manual-transportation group.
Figure 2. Forest plot of primary outcomes for a PTS vs manual transportation.
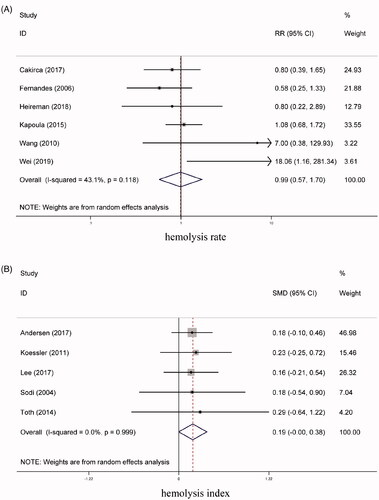
Table 2. Subgroup analyses of hemolysis rate, hemolysis index, and K, LDH, ALT, and AST levels for a PTS vs manual transportation.
0.31 (0.04, 0.58)
Five studies [Citation16,Citation18,Citation24,Citation26,Citation36] investigated the effects of a PTS on the hemolysis index of blood samples. Our meta-analysis showed that the hemolysis index did not differ significantly between the PTS group (213 blood samples) and the manual-transportation group (213 blood samples) (SMD = 0.19, 95% CI = −0.00 to 0.38, p = .06, I2 = 0.00%) (). Subgroup analysis showed that the PTS and manual-transportation did not differ significantly among the PTS speed and protection of blood sample subgroups (all p > .05).
Meta-analysis of the effect of a PTS on secondary outcomes compared with the manual-transportation group
We conducted a comprehensive analysis of the serum level of K for 24 of the studies [Citation5,Citation10–20,Citation23–31,Citation33–35]. The results demonstrated that the samples transported by a PTS (1329 samples) did not differ significantly from those transported manually (1329 samples) (SMD = 0.05, 95% CI = −0.03 to 0.12, p = .24, I2 = 0.00%) (). Furthermore, we found no subgroup effects for the PTS speed, PTS distance, or the protection of the blood samples (all p > 0.05).
Figure 3. Forest plot of secondary outcomes (K and LDH) for a PTS vs manual transportation.
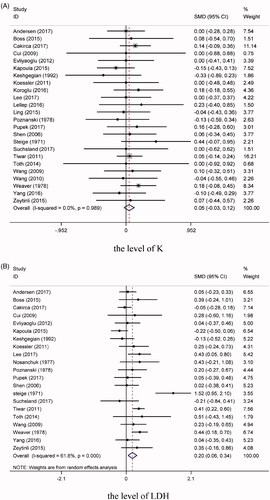
21 articles [Citation5,Citation10,Citation11,Citation13,Citation15–20,Citation23,Citation24,Citation26,Citation28–35] involving 1219 samples in the PTS group and 1219 samples in manual-transportation group reported the LDH levels. The heterogeneity test revealed the presence of significant heterogeneity among these studies (I2 = 61.8%, p < .001). Our meta-analysis found that the level of LDH in the blood samples was higher for those transported via a PTS than for those transported manually (SMD = 0.20, 95% CI = 0.06 to 0.34, p = .01) (). Subgroup analysis showed that the LDH level was clearly higher in the PTS group than in the manual-transportation group when the PTS speed was ≥6 m/s (SMD = 0.31, 95% CI = 0.04 to 0.58, p = .02, I2 = 70.70%), while no difference was observed between the two groups when the speed was <6 m/s (SMD = 0.13, 95% CI = −0.09 to 0.35, p = .25, I2 = 66.90%). Meanwhile, for long transportation distances (≥250 m) there was a significant difference between the PTS and manual-transportation groups (SMD = 0.30, 95% CI = 0.04 to 0.56, p = .03, I2 = 64.80%), whereas no difference was identified for short distances (<250 m) (SMD = 0.10, 95% CI = −0.11 to 0.31, p = 0.34, I2 = 71.60%). The PTS and manual-transportation groups differed significantly regardless of whether or not the blood samples were protected (all p < .05).
The levels of ALT were reported for 10 studies [Citation10,Citation11,Citation13–15,Citation18,Citation25,Citation26,Citation28,Citation29], comprising 699 samples in the PTS group and 699 samples in the manual-transportation group. The ALT level was not higher in PTS group than in the manual-transportation group, and there was no significant heterogeneity among the included studies (SMD = 0.00, 95% CI = −0.10 to 0.11, p = .96, I2 = 0.00%) (). Subgroup analysis showed that there were no clear differences between the PTS and manual-transportation groups among all of the subgroups (all p > 0.05).
Figure 4. Forest plot of secondary outcomes (ALT and AST) for a PTS vs manual transportation.
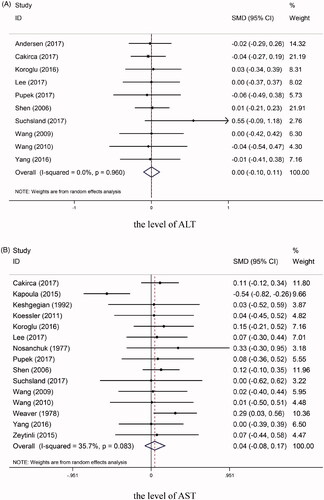
Our study included 15 studies [Citation5,Citation10,Citation11,Citation13–15,Citation23–26,Citation28,Citation29,Citation31,Citation32,Citation35] for which AST levels were available, which involved 919 samples in the PTS group and 919 samples in the manual-transportation group. Heterogeneity testing showed that I2 = 35.70% and p = 0.08, suggesting the absence of significant heterogeneity. The AST level did not differ significantly between the two groups (SMD = 0.04, 95% CI = −0.08 to 0.17, p = .48) (). Subgroup analysis revealed that when the distance was less than 250 m, the AST level did not differ significantly between the PTS and manual-transportation groups (SMD = −0.04, 95% CI = −0.29 to 0.21, p = .77, I2 = 67.10%), while there was a significant difference for longer distances (SMD = 0.18, 95% CI = 0.28 to 0.33, p = .02, I2 = 0.00%). In the protected group, the AST level was significantly higher for blood samples transported by a PTS than for those transported manually (SMD = 0.05, 95% CI = −0.18 to 0.27, p = .70, I2 = 67.20%). However, no significant intergroup difference was observed in the AST level in the unprotected groups (SMD = 0.14, 95% CI = 0.01 to 0.26, p = .03, I2 = 0.00%). No clear differences were identified between two groups according to the PTS speed (all p > .05).
Sensitivity analysis and publication bias
Sensitivity analyses found that removing one any of the included studies did not significantly change the results obtained for the hemolysis rate, hemolysis index, and levels of K, LDH, and ALT, suggesting that the results were stable. For the AST level, deleting one study [Citation23] significantly changed the pooled results, from SMD = 0.05 (95% CI = −0.08 to 0.17) before deletion, to SMD = 0.12 (95% CI = 0.02 to 0.21), indicating that the pooled result for the AST level was unstable (Supplementary Figure 1).
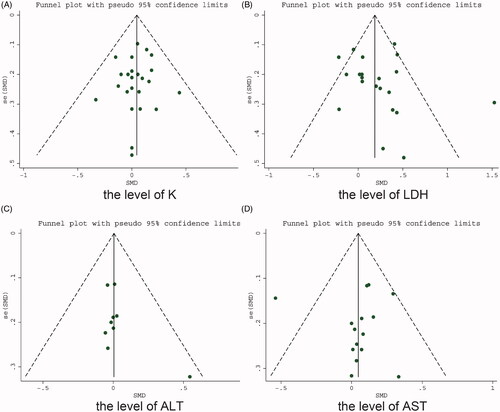
Funnel plots were evaluated to detect the presence of publication bias for the K, LDH, ALT, and AST levels. It was found that the studies had a symmetric distribution (). Egger’s test suggested that there was no significant publication bias in the results of each study for the levels of K (p = .64), LDH (p = .54), ALT (p = .19), and AST (p = .99).
Figure 5. Funnel plot for a PTS vs manual transportation.
Discussion
This meta-analysis of 29 cross-sectional studies included 3121 blood samples, and found a statistically significant effect of PTS on LDH and may conclude that the PTS is associated with a mild degree of hemolysis in the transported blood samples, as LDH is first altered when hemolysis occurred. This study found that the first primary outcome (the hemolysis rate) did not differ significantly between a PTS and manual transportation. Cakirca and Erdal [Citation10] similarly considered that using a PTS did not significantly affect the hemolysis of blood samples, with hemolysis rates of 8% and 10% in their PTS and manual-transportation groups, respectively; Fernandes et al. [Citation21] found corresponding rates of 5.8% and 10%, with no significant difference, as also found by Phelan et al. [Citation4]. However, Kara et al. [Citation2] found that the hemolysis rate was significantly higher in their PTS group than in their manual-transportation group. There are several possible reasons for the above-mentioned discrepancies. In the study of Kara et al. [Citation2], the transportation and clinical biochemical measurements of blood samples were not made contemporaneously in the two groups, nor did those authors describe the baseline characteristics, which might be different and hence affected the accuracy of the results. Furthermore, the discrepancies might also be related to the characteristics of the PTSs varying between the studies, such as in the transportation routes and number of bends or carriers.
Regarding the second primary outcome of the present study, we found that a PTS had no effect on the hemolysis index of blood samples, which is consistent with the conclusions drawn by Koessler et al. [Citation24]. Toth et al. [Citation16] similarly found no remarkable difference in hemolysis index between a PTS and manual transportation, and that the PTS did not cause any significant preanalytical problems with hemolysis. However, Lee et al. [Citation26]. reported that the hemolysis index was higher for a PTS than for manual transportation, which could have been due to the high PTS speed in that study increasing the hemolysis index caused by damage to erythrocytes. Differences in the PTS characteristics among these studies might also have contributed to the observed differences.
For the secondary outcomes of the present meta-analysis, the lack of a significant effect of a PTS on hemolysis was further confirmed by no obvious differences being found among erythrocytic compounds such as K, ALT, and AST between samples transported by a PTS or manually. Similarly, Pupek et al. [Citation28] believed that using a PTS had no effect on the K, ALT, and AST levels in blood samples. Kapoula et al. [Citation23] also reported that the transportation method had no significant effect on measured serum blood parameters such as K and AST levels. However, the meta-analysis performed by Kapoula et al. [Citation9] yielded statistically significant results for K and AST. Possible causes of these differences are as follows: (1) the blood samples analyzed in their study were obtained from a single venipuncture procedure, but the baseline values for the paired blood samples analyzed in parallel were comparable, which were also included in our study; (2) Kapoula et al. used the mean difference as the effect size, which differs from our use of the SMD; and (3) finally, our meta-analysis is more recent, and includes more journal articles than that of Kapoula et al.
A particularly interesting finding of our study was that blood samples transported by a PTS had higher LDH levels than those transported manually (with a 95% CI of 0.06 to 0.34). We suspected that only the LDH from samples transported by a PTS showed a significant difference due to the LDH level being higher than the sensitivity threshold of the test [Citation35]. The level of LDH in red blood cells is reportedly 160-fold higher than that in plasma, while the concentration of potassium in red blood cells is only 23-fold higher [Citation19]. Only 0.1% hemolysis of erythrocytes in a blood sample could increase the LDH activity by at least 18% [Citation35]. So there is a clear correlation between a mild degree of hemolysis in the transported blood samples and PTS transportation, which is consistent with the conclusions drawn by Kapoula et al. [Citation9]. In order to prevent this mild hemolysis, it is necessary to control the quality of PTSs, such as the fHb standard as high as 9 mmol/L when purchasing new PTSs for laboratories in US public biddings.
Four previous studies found that hemolysis may be affected by the PTS speed, PTS distance, the protection of the blood samples, and other characteristics of the PTS [Citation10,Citation19,Citation30,Citation37]. One of these studies found that blood samples were more prone to hemolysis in the ‘long distance and high speed’ phase than in the ‘short range, slow speed’ phase [Citation30]. Another study found that the use of sponge rubber inserts can reduce the rate of hemolysis by decreasing the movements and the vibrations of the samples in the tubes [Citation10]. The other two studies found that characteristics of a PTS such as its type, number of bends, and transportation routes may produce different results [Citation19,Citation37]. Our subgroup analyses showed that the LDH or AST levels of blood samples delivered by a PTS were significantly higher than that transported manually under the condition of a fast PTS, a long PTS, or no protective measures. It can therefore be recommended that a PTS should be used at slow speeds, over short distances, and with protection of the blood samples. Due to the variety of PTSs and the lack of data on the number of bends and transportation routes, we did not conduct a subgroup analysis of these characteristics of the PTSs.
Several limitations of this study must also be mentioned. The small number of included studies means that caution is required when interpreting the results for the hemolysis rate, hemolysis index, and their subgroup analysis. Moreover, some studies were not included since necessary data were not reported, which might have resulted in selectivity bias. Besides, since the number of bends and the transportation routes were not reported in most of the studies, the effect of these PTS characteristics on hemolysis could not be explored. The definition of hemolysis was too high to allow reporting of results for some components (AST, Folate, or LDH). Finally, other preanalytical variations in the blood samples, such as coagulation, were not part of the study, but may still be altered by PTSs.
Conclusions
The present study has shown that there is a statistically significant difference for the blood samples transported by PTS compared to those transported manually, so it is sensible that each hospital validates and monitor their PTSs, such as using data loggers and applying standards or recommendations of PTSs. Furthermore, we believe that a PTS will work better at slow speeds, short distances, and with protection of the blood samples. Randomized controlled trials with larger samples and rigorous designs should be carried out in the future to verify these conclusions.
Author contributions
All the authors have accepted responsibility for the entire content of this submitted manuscript and approved submission.
Supplemental Material
Download PDF (162.3 KB)Acknowledgments
The authors thank the reviewers for their comments on the manuscript.
Disclosure statement
No potential conflict of interest was reported by the author(s).
References
- Xu JJ, Zhou YF. Hospital pneumatic tube system. Chin Med Equip J. 2003;(8) :44–45.
- Kara H, Bayir A, Ak A, et al. Hemolysis associated with pneumatic tube system transport for blood samples. Pak J Med Sci. 2014;30(1):50–58.
- Wei J, Wu YN, Ling Y, et al. False decrease of high-sensitivity cardiac troponin T assay in pneumatic tube system samples. Clin Chim Acta. 2019;495:507–511.
- Phelan MP, Reineks EZ, Hustey FM, et al. Does pneumatic tube system transport contribute to hemolysis in ED blood samples? West J Emerg Med. 2016;17(5):557–560.
- Keshgegian AA, Bull GE. Evaluation of a soft-handling computerized pneumatic tube specimen delivery system. Effects on analytical results and turnaround time. Am J Clin Pathol. 1992;97(4):535–540.
- Rostom A, Dube C, Cranney A, et al. Celiac disease [Internet]. Rockvile (MD): Agency for Healthcare Research and Quality; 2004. Available from: https://www.ncbi.nlm.nih.gov/books/NBK35156.
- Wells G, Shea B, O’Connell D, et al. The Newcastle-Ottawa Scale (NOS) for assessing the quality of non-Randomized studies in meta-Analyses [Internet]. Ottawa, Ontario: Ottawa Hospital Research Institute.2012. Available from: http://www.ohri.ca/programs/clinical_epidemiology/oxford.asp
- Higgins J, Green S. Cochrane handbook for systematic reviews of interventions version 6. Oxford (UK): Cochrane Collaboration; 2020.
- Kapoula GV, Kontou PI, Bagos PG. The impact of pneumatic tube system on routine laboratory parameters: a systematic review and meta-analysis. Clin Chem Lab Med. 2017;55:1834–1844.
- Cakirca G, Erdal H. The effect of pneumatic tube systems on the hemolysis of biochemistry blood samples. J Emerg Nurs. 2017;43(3):255–258.
- Yang L, Zhao WS, Jiang L, et al. Effect of improved pneumatic tube system on test results of routine biochemical projects. Jiangsu Med J. 2016;42:1397–1399.
- Ling HY, Gong J, Zheng TY. Discussion on the influence of pneumatic tube system on the quality of blood specimens. Biotech World. 2015;(11):269.
- Wang XR, Long XL, Yu M, et al. Effect of pneumatic tube system on blood biochemical test. J Mod Lab Med. 2009;24:37–38.
- Wang JX, Wang YG, Shen RC, et al. Effect of pneumatic tube system on test results of ICU patients samples. J Mod Lab Med. 2010;25(2):110–112.
- Shen JC, Mao SQ, Qi JJ, et al. Study on the effect of medical pneumatic tube transport system on the results of blood biochemical detection project. Lab Med. 2006;21(3):287–289.
- Tóth J, Lenkey Á, V Oláh A, V OA, et al. Pneumatic tube system for transport of laboratory samples: preanalytical aspects. Orv Hetil. 2014;155(28):1113–1120.
- Boss DS, Hackeng CM, Vlot EA, et al. Het effect van buizenpost op stolling-en hemolyseparameters: “to walk or not to walk”. Ned Tijdschr Klin Chem Labgeneesk. 2015;40:234–238.
- Andersen IB, Mogensen N, Brandslund I. Stability of biochemical components in blood samples transported by Tempus600/SysmexGLP robot reception system. J Appl Lab Med. 2017;1:376–386.
- Cui M, Jing R, Wang H. Changes of serum lactate dehydrogenase and potassium levels produced by a pneumatic tube system. Lab Med. 2009;40(12):728–731.
- Evliyaoğlu O, Toprak G, Tekin A, et al. Effect of pneumatic tube delivery system rate and distance on hemolysis of blood specimens. J Clin Lab Anal. 2012;26(2):66–69.
- Fernandes CM, Worster A, Eva K, et al. Pneumatic tube delivery system for blood samples reduces turnaround times without affecting sample quality. J Emerg Nurs. 2006;32(2):139–143.
- Heireman L, Stroobants J, Uyttenbroeck W, et al. Smartphone application monitoring of acceleration forces during pneumatic tube system transport of emergency department patient samples. Clin Lab. 2018;64(7):1297–1304.
- Kapoula G, Filntisis I, Karampousli E, et al. Pneumatic tube transport system for blood samples: evaluation of its effect on hemolysis. Sci Chronicles. 2015;2:194–199.
- Koessler J, Kobsar AL, Brunner K, et al. The preanalytical influence of two different mechanical transport systems on laboratory analysis. Clin Chem Lab Med. 2011;49(8):1379–1382.
- Koroglu M, Erkurt MA, Kuku I, et al. Assessing safety of pneumatic tube system (PTS) for patients with very low hematologic parameters. Med Sci Monit. 2016;22:1329–1333.
- Lee AJ, Suk SH, Jeon CH, et al. Effects of one directional pneumatic tube system on routine hematology and chemistry parameters; A validation study at a tertiary care hospital. Pract Lab Med. 2017;9:12–17.
- Lellep A, Kurm J, Univer I, et al. Comparison of blood sample transport via pneumatic tube system and manually by courier. Eesti Arst. 2016;95:53.
- Pupek A, Matthewson B, Whitman E, et al. Comparison of pneumatic tube system with manual transport for routine chemistry, hematology, coagulation and blood gas tests. Clin Chem Lab Med. 2017;55:1537–1544.
- Suchsland J, Winter T, Greiser A, et al. Extending laboratory automation to the wards: effect of an innovative pneumatic tube system on diagnostic samples and transport time. Clin Chem Lab Med. 2017;55(2):225–230.
- Tiwari AK, Pandey P, Dixit S, et al. Speed of sample transportation by a pneumatic tube system can influence the degree of hemolysis. Clin Chem Lab Med. 2011;50(3):471–474.
- Zeytinli M, Zengin O, Ari E, et al. The effects of transport by pneumatic tube system on routine biochemistry parameters. Clin Chem Lab Med. 2015;53:A69.
- Nosanchuk JS, Salvatore JD. Improved pneumatic tube system shortens stat turnaround time. Lab Med. 1977;11:21–25.
- Poznanski W, Smith F, Bodley F. Implementation of a pneumatic-tube system for transport of blood specimens. Am J Clin Pathol. 1978;70(2):291–295.
- Steige H, Jones JD. Evaluation of pneumatic-tube system for delivery of blood specimens. Clin Chem. 1971;17(12):1160–1164.
- Weaver DK, Miller D, Leventhal EA, et al. Evaluation of a computer-directed pneumatic-tube system for pneumatic transport of blood specimens. Am J Clin Pathol. 1978;70(3):400–405.
- Sodi R, Darn SM, Stott A. Pneumatic tube system induced haemolysis: assessing sample type susceptibility to haemolysis. Ann Clin Biochem. 2004;41(3):237–240.
- Nybo M, Lund ME, Titlestad K, et al. Blood sample transportation by pneumatic transportation systems: a systematic literature review. Clin Chem. 2018;64(5):782–790.