
Abstract
Glycated albumin (GA) may be a useful biomarker of glycemia in pregnancy. The aim of this study was to establish the reference interval (RI) for GA, analyzed by liquid chromatography-tandem mass spectrometry (LC-MS/MS), in healthy, nulliparous pregnant women. In addition, we assessed the accuracy of GA and glycated hemoglobin A1c (HbA1c) in the diagnosis of gestational diabetes mellitus (GDM). Finally, we explored the prevalence of GDM in healthy nulliparas, comparing three diagnostic guidelines (WHO-1999, WHO-2013 and the Norwegian guideline). The study was carried out at Stavanger University Hospital, Norway, and included a study population of 147 pregnant nulliparous women. An oral glucose tolerance test (OGTT) was performed and used as the gold standard for GDM diagnosis. Blood samples for analysis of GA and HbA1c were collected at pregnancy week 24–28. A nonparametric approach was chosen for RI calculation, and receiver operating characteristic (ROC) curves were used to evaluate the diagnostic performance of GA and HbA1c. The established RI for GA in 121 pregnant women was 7.1–11.6%. The area under the ROC curves (AUCs) were 0.531 (GA) and 0.627 (HbA1c). According to the WHO-1999, WHO-2013 and the Norwegian guideline, respectively, 24 (16%), 36 (24%) and 21 (14%) women were diagnosed with GDM. Only nine women (6%) fulfilled the GDM-criteria of all guidelines. In conclusion, we established the first LC-MS/MS-based RI for GA in pregnant women. At pregnancy weeks 24–28, neither GA nor HbA1c discriminated between those with and without GDM. Different women were diagnosed with GDM using the three guidelines.
Introduction
Hyperglycemia is among the most common medical complications in pregnancy and is classified as either diabetes in pregnancy (DIP) or gestational diabetes mellitus (GDM) [Citation1]. In Europe, GDM prevalence is around 5–10%, depending on screening strategy, diagnostic criteria and study population [Citation2]. GDM is associated with adverse maternal-fetal outcomes in the short and long term [Citation3].
Since 2010, the International Association of Diabetes and Pregnancy Study Groups (IADPSG) have advocated universal GDM screening of all pregnant women [Citation4]. There is, however, no international consensus on the diagnosis [Citation5]. In 2017, a Norwegian GDM guideline was published [Citation6], recommending almost universal screening with an oral glucose tolerance test (OGTT) during pregnancy weeks 24–28. New criteria for GDM diagnosis were established, with fasting plasma glucose (FPG) 5.3–6.9 mmol/l and/or 2 h plasma glucose (2hPG) 9.0–11.0 mmol/l. Until 2017, selective screening of high-risk women and the GDM diagnostic criteria according to the WHO-1999 guideline was used in Norway [Citation7].
Despite low reproducibility and high coefficients of variation (CV) [Citation8,Citation9], the OGTT remains the gold standard test for diagnosing GDM. However, the IADPSG predicts that simpler and more cost-effective strategies as FPG or markers of short-term glycemia will replace the OGTT in the future [Citation4]. Glycated hemoglobin A1c (HbA1c) reflects mean glycemia over the preceding 8–12 weeks [Citation10] and has been the principal diagnostic test for diabetes mellitus for the last decade [Citation11]. Other factors than glycemia, e.g. altered erythrocyte turnover [Citation12], may influence HbA1c level. In addition, there are clinical settings, among them pregnancy, where HbA1c has limitations [Citation13]. In a recent meta-analysis exploring the accuracy of HbA1c in diagnosing GDM, the authors concluded that HbA1c has high specificity, but low sensitivity [Citation14].
Glycated albumin (GA), a biomarker of glycemia reflecting short-term (2–4 weeks) glycemic control, has been suggested as a supplement to HbA1c [Citation15]. In diabetic pregnancies, where strict glycemic control is important to reduce the risk of adverse maternal/fetal outcomes, a marker reflecting recent glycemic status is preferable. Elevated GA level is seen in pregnancies complicated by GDM and has been associated with adverse outcomes [Citation16,Citation17]. However, the role of GA in monitoring glycemic control in diabetic pregnancies and as a diagnostic test of GDM, is still controversial. The reference interval (RI) for GA in healthy pregnant women is not well defined. A few studies have reported the RI for GA (using enzymatic methodology) in Asian pregnant women [Citation18,Citation19]. To our knowledge, only one study has established a RI for GA in a healthy Caucasian pregnant population [Citation20]. Recently, a new high-throughput method for GA measurement utilizing liquid chromatography-tandem mass spectrometry (LC-MS/MS) was developed in our laboratory [Citation21]. Prior to assess the potential clinical role of GA as a biomarker of glycemia in pregnancy, establishment of a RI in a pregnant population is mandatory.
The aim of this study was to establish the RI for GA, analyzed by LC-MS/MS, in healthy, nulliparous pregnant women at pregnancy weeks 24–28. In addition, we evaluated the diagnostic accuracy of GA and HbA1c in the diagnosis of GDM, using the OGTT as the gold standard. Finally, we explored the prevalence of GDM among healthy nulliparas using the diagnostic criteria from three different GDM-guidelines: WHO-1999, WHO-2013 and the newer Norwegian guideline (Norway-2017).
Materials and methods
Study setting
This cross-sectional study was conducted at Stavanger University Hospital, Norway, in 2017–2018. Women were asked to participate in the study when they met for routine second-trimester ultrasound examination around pregnancy week 18. Inclusion criteria were nulliparous women > 25 years with singleton pregnancies, not previously diagnosed with diabetes. According to the Norway-2017 guideline, these women are recommended to have an OGTT at pregnancy weeks 24–28. A one-step 75 g OGTT was performed at the Clinical Trial Ward in the morning after an overnight fast [Citation6]. In addition to GA and HbA1c, thyroid and iron status were assessed, as abnormal thyroid function is known to influence GA [Citation15] and iron deficiency may increase HbA1c [Citation12].
All participating women answered a questionnaire in which age, ethnicity, pre-pregnancy weight, height, weight gain in pregnancy to date, family history of diabetes, smoking and tobacco use, chronic illnesses, medication and supplement use were recorded. Weight and height were used to calculate BMI (kg/m2). Information concerning pregnancy outcome, such as weight gain in pregnancy, preeclampsia, hypertension, induction of labor, operative vaginal delivery, cesarean section, birth weight and Apgar score, and admission to the neonatal intensive care unit were collected from medical records after delivery. Frequencies of small for gestational age and large for gestational age babies were calculated using the 10th and 90th percentile according to Gjessing et al. [Citation22].
The women diagnosed with GDM according to the Norway-2017 guideline were informed about the diagnosis and advised to contact their general practitioner for follow-up. Within two weeks of the OGTT, all women with GDM attended a workshop with an endocrinologist, clinical nutritionist and diabetes nurse at Stavanger University Hospital. The target for glycemic control throughout the remainder of pregnancy was FPG < 5.3 mmol/L and 2 h postprandial glucose < 6.7 mmol/L. In cases were glycemic control was not achieved by diet or lifestyle changes, anti-diabetic medication was initiated by an endocrinologist. All women with ferritin level < 15 ug/L were recommended iron substitution. Women with GDM were offered a follow-up consultation at the hospital, including ultrasound examination and repeat blood tests at gestational weeks 36–38. Their blood glucose measurements from time of diagnosis until follow-up were retrieved from Diasend (Glooko Inc., Mountain View, CA).
The prevalence of GDM in our study population was assessed using the three different diagnostic guidelines; WHO-1999 (FPG ≥ 7.0 mmol/L or 2hPG ≥ 7.8 mmol/L), WHO-2013 (FPG 5.1–6.9 mmol/L, 1 h plasma glucose (1hPG) ≥ 10.0 mmol/L and/or 2hPG 8.5–11.0 mmol/L) and finally, the Norway-2017 guideline.
LC-MS/MS analysis
Blood samples for GA were collected in serum gel tubes, stored at room temperature for 30 min, centrifuged at 2500 g to obtain serum, and stored at −75 °C until used. A recently developed LC-MS/MS method was used for GA measurement [Citation21]. GA is measured by the relative degree of glycation of the N-terminus lysine (K) of KQTALVELVK, a proteotypic peptide of human serum albumin obtained by enzymatic digestion with trypsin. The glycation of lysine (525 K) is the most frequently reported glycation site on human serum albumin [Citation23]. The percentage of GA is estimated by neat peak area response of glycated peptide divided by the sum of glycated and non-glycated peptide using full scan nano-LC-MS.
Since 2016, this method has been implemented in routine use for complementing the HbA1c assay and assisting in diabetes detection and monitoring. The method is applied as previously published, but with a few modifications. Robot pipetting is now with an EVO Freedom 150 liquid handling robot (Tecan, Männedorf, Switzerland) and basically 2 µL serum is mixed with 450 µL TRIS-formate buffer (50 mM, pH 7.6) followed by mixing and discarding 400 µL. To this diluted sample the following was added: 10 µL of trypsin (0.05–0.06 µg/µL with 25–30 mM Ca) mg/mL) and 190 µL acetonitrile. The plate was capped and incubated for one hour at 37 °C, followed by 11 min centrifugation, 4000 g at 4 °C, and direct analysis by LC-MS/MS.
Method calibration was performed by using a commercial quality control sample (Seronorm Liquid Level 1, Sero, Norway) with an in-house assigned level of 13.5% GA. A different in-house quality control sample (HK) with a mean level of 8.91% GA was applied to monitor long-term precision, resulting in a CV of 4.0% (12 months, n = 57). The level specific CV for a batch analysis was 2.0% (mean GA level 12.1%). The normal reference range was established by analysis of Nobida biobank serum samples and was found to be 7.8–12.4% GA, which most likely is specific for the laboratory of Stavanger University Hospital. Instrumental method files for the robot pipetting and instrumental analysis, as well as an example of processed results are provided in Supplementary material.
HbA1c was analyzed using BioRad Variant II Turbo, high-performance LC, standardized by the International Federation of Clinical Chemistry (IFCC) reference method (analytical variation ≤ 3%), and Abbott Architect c16000 was used for analysis of glucose. All analyses were performed at Department for Medical Biochemistry, Stavanger University Hospital.
Statistical analysis
To calculate the RI by the nonparametric approach, as recommended by the Clinical and Laboratory Standards Institute (CLSI) [Citation24], a sample size of 150 pregnant women was chosen to ensure at least 120 healthy individuals were included. The RI for GA was calculated using Analyse-it version 5.65 for Microsoft Excel (Analyse-it Software Ltd, Leeds, United Kingdom), based on the 2.5 and 97.5 percentiles and corresponding 90% CI in the reference population. The Dixon method was used for outlier detection [Citation24].
For the diagnostic-accuracy analyses, sample size calculations were carried out with MedCalc for Windows version 17.6 (MedCalc Software, Ostend, Belgium). We estimated a prevalence of GDM of 10%, as found in previous Norwegian studies [Citation25]. Previous receiver operating characteristics (ROCs) analyses in the general population have shown that the accuracy of GA is comparable to that of HbA1c with an expected area under the ROC curve (AUC) about 0.8 [Citation26,Citation27]. In women with GDM, an AUC of 0.757 for HbA1c is reported [Citation28]. Based on these calculations, specifying a significance level of 5%, power of 80%, GDM prevalence of 10% and an AUC of 0.757, a sample size of at least 110 was needed. ROC analyses were performed to compare the diagnostic values of GA and HbA1c, considering the OGTT as the reference diagnostic test. The diagnostic-accuracy analyses are in accordance with the 2015 Standards for reporting of diagnostic checklist (STARD) [Citation29].
The statistical analyses were performed using IBM SPSS Statistics for Windows version 26 (IBM Corp., Armonk, NY). Continuous variables are presented as mean with standard deviation (SD), while categorical data are presented with number and percentage. Of 95% confidence intervals (CIs) or SDs are given. Q–Q-plots were used to assess data distribution and Welch’s t-interval was used in situations where SD in one group was > 1.5 times the SD in the other group. Student’s t-test was used to examine differences between women with and without GDM and paired samples t-test was performed where appropriate. A two-tailed p value < .05 was considered statistically significant. Pearson’s test was used for correlation analysis. One woman with pre-pregnancy BMI 47 and 10-kg weight loss in pregnancy prior to the OGTT was considered an outlier in the analyses of pre-pregnancy BMI and weight gain in pregnancy, and was removed from these analyses.
Results
In all, we included 147 women. One woman diagnosed with diabetes mellitus in pregnancy (FPG > 7.0 and 2hPG > 11.0) was excluded from all further analyses. To establish the RI for GA in pregnancy we followed the recommendation by the CLSI [Citation24] and excluded women diagnosed with GDM (n = 21) and DM (n = 1) according to Norway-2017. Furthermore, we excluded four women using medication possibly interfering with their blood glucose level (e.g. prednisolone), resulting in a total reference population of 121 women. All these women had normal liver, kidney and thyroid function.
The characteristics of the reference population are shown in . In the reference population, the mean GA level was significantly lower among women with pre-pregnancy BMI ≥ 30 compared with GA level in women in the other BMI categories (BMI < 20, BMI 20–24 and BMI 25–29), p < .05 () whereas the mean CRP level increased in the higher two BMI categories. The RI for GA was 7.1–11.6% (). There were no outliers detected.
Table 1. Characteristics of the reference population (n = 121).
Table 2. Glycated albumin reference interval in pregnant women.
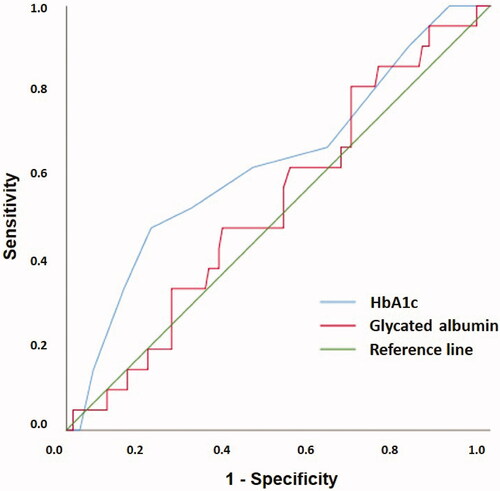
The performance of GA and HbA1c in the diagnosis of GDM, using the OGTT as the reference diagnostic test, is presented in . ROC analysis showed AUC of GA was 0.531 (p = .649), whereas AUC of HbA1c was 0.627 (p = .063). The correlation coefficient between GA and HbA1c was r = −0.073 (n = 146).
Figure 1. Receiver operating characteristics (ROC) curves to assess the suitability of GA and HbA1c in the diagnosis of GDM in pregnancy weeks 24–28 using the oral glucose tolerance test as the reference standard. The AUC value of GA was 0.531 (SE 0.065, 95% CI 0.405–0.658) and HbA1C was 0.627 (SE 0.069, 95% CI 0.492–0.762). GA: glycated albumin; HbA1c: glycated hemoglobin A1c; GDM: gestational diabetes mellitus; AUC: area under the ROC curve; SE: standard error; CI: confidence interval.
The numbers of women diagnosed with GDM were 24 (16.4%, 95% CI 10.4–22.5), 36 (24.7%, 95% CI 17.7–31.6) and 21 (14.4%, 95% CI 8.6–20.2) according to WHO-1999, WHO-2013 and Norway-2017, respectively. Among the 21 women diagnosed with GDM according to Norway-2017, 15 (71.4%) had FPG ≥ 5.3 mmol/L as the only diagnostic criterion. In contrast, the 24 women diagnosed using WHO-1999 criteria had elevated 2hPG ≥ 7.8 mmol/L. The characteristics of women with and without GDM diagnosed by Norway-2017 are presented in , while characteristics of women with and without GDM according to WHO-1999, WHO-2013 and Norway-2017 are provided in Supplemental Table 1.
Table 3. Characteristics of women with and without gestational diabetes mellitus (GDM).
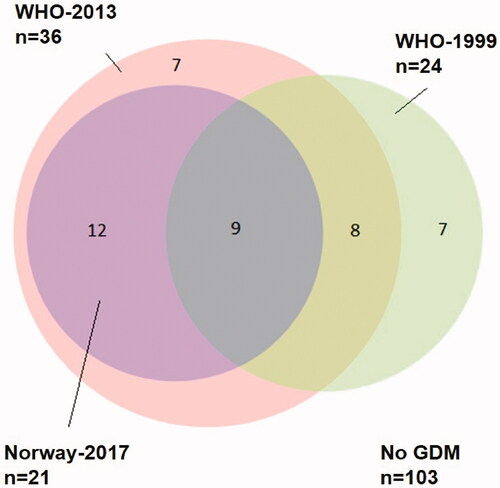
shows an Euler diagram illustrating the number of women diagnosed by each guideline. Only nine women (6.2%) fulfilled the GDM criteria in all three guidelines. In these nine women, hyperglycemia was more pronounced and all glucose values at the OGTT were higher compared with those for the rest of the study population (n = 137). Comparing these two groups, the mean FPG, 1hPG and 2hPG were 5.1 mmol/L (SD 0.4) vs. 4.8 mmol/L (SD 0.3), 9.8 mmol/L (SD 0.9) vs. 6.8 mmol/L (SD 1.6) and 9.0 mmol/L (SD 0.8) vs. 5.9 mmol/L (SD 1.3), respectively (all p < .05). There was no significant difference in mean GA level or HbA1c level between these two groups.
Figure 2. Euler diagram showing the relationship between GDM diagnoses according to the three different guidelines WHO-1999, green circle (n = 24), WHO-2013, pink circle (n = 36) and Norway-2017 and violet circle (n = 21). Numbers in the three circles indicate how many women were diagnosed with GDM according to each guideline, in both single and multiple guidelines. Total study population n = 146. GDM: gestational diabetes mellitus; WHO: World Health Organization.
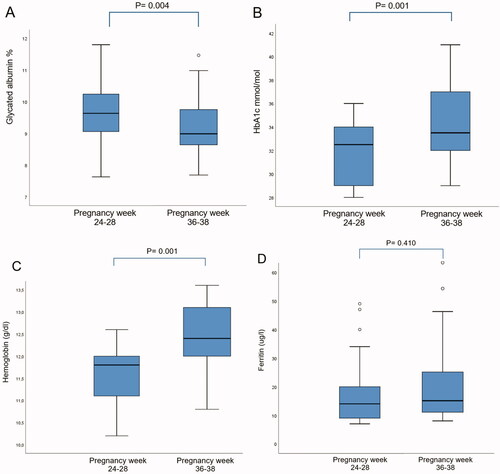
There was no significant difference in mean GA level or HbA1c level between women with and without GDM, diagnosed by Norway-2017 at the OGTT. 18 of 21 women with GDM met for follow-up consultation around pregnancy week 37, and in these, the mean GA level was significantly lower than at the time of diagnosis: 9.1% (SD 0.95) vs. 9.6% (SD 0.97), whereas mean HbA1c level was significantly higher: 33.4 mmol/mol (SD 2.6) vs. 31.9 mmol/mol (SD 3.5) (). In addition, the mean hemoglobin level increased from 11.6 g/dL (SD 0.7) to 12.4 g/dL (SD 0.8), whereas the mean ferritin level remained low and showed no significant difference from initial measurement () despite 12 of the women being recommended iron substitution at the OGTT. Neither did we observe any difference between mean reticulocyte count or mean reticulocyte hemoglobin level at pregnancy weeks 24–28 compared to pregnancy week 37 (data not shown).
Figure 3. Box plot of glycated albumin level (A), HbA1c level (B), hemoglobin level (C) and ferritin level (D) in women with gestational diabetes mellitus at pregnancy weeks 24–28 and 36–38 (n = 18). HbA1c: glycated hemoglobin A1c.
Blood glucose data registered from women with GDM showed good glycemic control with mean PG 5.3 mmol/l (SD 0.4) from time of diagnosis until follow-up at pregnancy week 37 (Supplemental material). Only 3 of 21 women with GDM (14.3%) needed anti-diabetic medication during pregnancy.
Discussion
This study established the first LC-MS/MS-based RI for GA in a population of healthy women at pregnancy weeks 24–28. Before assessing the clinical potential of a biomarker, establishment of a RI in a healthy population similar to the population on which the biomarker is to be applied, is the first step. In pregnancy, GA could be a supplement in the diagnostics of GDM and in monitoring of glycemic control. According to CLSI, the best means to establish a RI is to collect a minimum of 120 samples from qualified reference individuals [Citation24]. Thus, the sample size was estimated for this main purpose and not to assess differences between women with and without GDM. The reference population should be as similar as possible to the population to which the test will be applied, with the exception of the presence of disease [Citation30]. Thus, we included women with various pre-pregnancy BMIs and different ethnicities, although this was not done in other RI studies for GA in pregnancy [Citation18,Citation19]. According to the Medical Birth Registry of Norway, one out of three pregnant women has pre-pregnancy BMI > 25 [Citation31]. Therefore, excluding this group from the reference population would not reflect the ‘normal’ pregnant population. We established the RI of GA in pregnancy weeks 24–28, as this is the recommended screening period for GDM.
In this study, the RI for GA in pregnant women analyzed by LC-MS/MS was 7.1–11.6%, which is somewhat lower than the RI reported from our laboratory in non-pregnant women (7.8–12.4%). Hiramatsu et al. showed that the RI for GA in healthy Japanese pregnant women was 11.5–15.7% [Citation18], whereas in Chinese pregnant women, a GA RI of 9.2–14.6% is established [Citation17]. Both these studies used an enzymatic method for GA analysis [Citation32], and women with pre-pregnancy BMI > 25 were excluded in the Japanese study. Other studies have shown that GA level is lower in higher BMI categories [Citation33]; the reasons remain unexplained, but might be due to increased albumin turnover related to inflammation [Citation34]. In accordance with this, a lower GA level was also seen in the obese group in our study population ().
With a reported AUC of only 0.531, our study does not support the use of GA as a diagnostic tool for GDM, which is also in agreement with previous studies finding AUCs for GA comparable with ours, and in the range 0.531–0.568 [Citation35–37].
There was no correlation between GA and HbA1c (r = 0.073) in our data set, although a strong positive correlation was found outside pregnancy (r = 0.84) [Citation21]. The difference may be explained by a more homogeneous dataset and less spread in the pregnant population, as correlations are relative [Citation38]. Another explanation may be the differences between GA and HbA1c, detecting short-term and long-term glycemia, respectively.
In our study population, the prevalence of GDM varied from 14.4% (Norway-2017) to 24.7% (WHO-2013), and only 6.2% fulfilled the GDM criteria in all three guidelines. When comparing WHO-1999 and Norway-2017, which represent the previous and present diagnostic criteria used in Norway, a corresponding prevalence was observed (16 vs. 14%). However, only nine women were diagnosed with GDM using both guidelines (). In a recent Dutch study, applying the WHO-2013 criteria in a high-risk population increased the number of GDM diagnoses from 22 to 32% (as compared to WHO-1999) [Citation39]. Moreover, they observed that women diagnosed on the WHO-2013 FPG-threshold of 5.1 mmol/L had increased risk of adverse outcomes, supporting the use of this criterion.
The WHO-2013 criteria are based on an estimated increased risk of adverse outcomes, using an odds ratio (OR) of 1.75, based on the Hyperglycemia and Adverse Pregnancy Outcome (HAPO) study [Citation40]. The diagnostic criteria in Norway-2017 use a cut-off of OR 2.0. In our study population, an almost doubled prevalence of GDM was observed with the use of WHO-2013 criteria compared with the use of the Norway-2017 criteria. Unfortunately, our sample size is too small to compare the risk of adverse outcomes using the different guidelines. To avoid the high WHO-2013-calculated prevalence of GDM, some have supported the use of OR 2.0 [Citation41], which is also in agreement with the evidence from the Maternal-Fetal Medicine Units Network randomized trial of treatment of mild GDM [Citation42].
In Switzerland, GDM screening includes a simplification of the IADPSG consensus, and glucose loading in OGTT is only performed in women with FPG in the range 4.4–5.0 mmol/L. Women with FPG ≥ 5.1 mmol/L are diagnosed with GDM (‘rule-in’), whereas those with FPG < 4.4 mmol/L are ‘ruled-out’. The diagnostic performance of this strategy was evaluated in a Swiss population with a GDM prevalence of 10.9% [Citation43]. The authors reported a sensitivity of 78.5%, and that 63.8% would have avoided the OGTT. This finding is in contrast to Agarwal et al. who reported a high sensitivity (95.4%) in Arab women using the same simplification [Citation44]. The conflicting results have several explanations, one being the prevalence of GDM (10.9 vs. 37.7%), another the distribution of abnormal values on the OGTT. In our study, only 11 women (7.5%) had FPG < 4.4 mmol/L. Using the ‘rule-out/in’ strategy with cut-off values of FPG < 4.4 and ≥ 5.3 mmol/L respectively, 26 women (18%) would have avoided the OGTT and none of the women with GDM according to Norway-2017 would have been missed.
As in two Chinese studies [Citation19,Citation36], we did not find any difference in mean GA when comparing women with and without GDM at pregnancy weeks 24–28. At follow-up around pregnancy week 37, the mean GA level was significantly reduced from the time of diagnosis (), in contrast to Zhu et al., who found a higher GA level in the third trimester [Citation36]. Exploring the role of GA in monitoring glycemic control was not among the aims of our study; however, a lower GA level at follow-up may reflect the good glycemic control achieved by these women as shown in their daily glucose monitoring (mean glucose 5.3 mmol/L). Conversely, the HbA1c level increased in the same period, and one might speculate whether this was because of iron deficiency. The mean ferritin level was low both at the OGTT and at follow-up, however, the mean hemoglobin level increased slightly.
Others have shown that GA level is stable or decreases throughout gestation in healthy pregnant women [Citation18,Citation19,Citation36]. Unfortunately, our study design did not allow for comparison of GA level among women with and without GDM in late third trimester.
Limitations to our study include that the study design did not allow establishing trimester-specific RIs for GA. Moreover, this was a single-center study with a limited sample size including only women > 25 years of age with singleton pregnancies. Multiparous women and women with multiple gestations were not included. The majority of the women were of Scandinavian heritage, with only 9.5% having a non-European background, thus our findings may not apply to all ethnicities. In addition, our sample size is too small to conclude on pregnancy outcome.
Strengths of this study include the well-characterized pregnant reference population, the implementation of the OGTT on a Clinical Trial Ward, and the analysis of GA by LC-MS/MS. This high-throughput method has shown good reproducibility (analytical variation ≤ 4% and a strong correlation between GA and HbA1c (r = 0.84)) [Citation21]. Although the study was carried out at Stavanger University Hospital, the women included were unselected, living in both rural and urban parts of our region with various socio-economic status, representative of the pregnant population. Only three women with GDM were lost to follow-up for repeat blood tests.
In conclusion, the established LC-MS/MS-based RI for GA in pregnant women was 7.1–11.6%. At pregnancy week 24–28, neither GA nor HbA1c discriminated between those with and without GDM, thus this study does not support the use of these biomarkers in GDM diagnosis. Finally, the prevalence of GDM among healthy nulliparas in our study population differs from 14.4 to 24.7% according to the various diagnostic guidelines and only 6.2% of the women fulfilled the GDM criteria in all three guidelines. It is time to reach international consensus for the diagnostic criteria of GDM.
Ethical approval
The study was carried out in accordance with the Helsinki Declaration and was approved by the Regional Committee for Medical and Health Research Ethics (REC) South-Eastern Norway (May 2017, REK 2017/771). The study was registered in Clinical Trials with identifier NCT03372824. Informed consent was obtained from all women included in this study.
Author contributions
All authors were responsible for study design and interpretation of data. ØS was responsible for analysis of GA and establishment of the RI. JHT has carried out the study, followed-up the study participants and did the data analysis. JHT and IØ drafted the manuscript, and all authors contributed to the revision of the manuscript. All authors have accepted responsibility for the entire content of this manuscript and approved its submission.
Supplemental Material
Download MS Word (12.3 KB)Supplemental Material
Download Zip (333.4 KB)Supplemental Material
Download PDF (1.3 MB)Acknowledgments
Jorunn Nilsen, Clinical Trial Ward, Ingvild Dalen, Department of Research, Section of Biostatistics, Cato Brede, Department of Medical Biochemistry and Joanna Claire Haynes, Department of Anesthesiology, Stavanger University Hospital.
Disclosure statement
No potential conflict of interest was reported by the author(s).
Additional information
Funding
References
- Hod M, Kapur A, Sacks DA, et al. The international federation of gynecology and obstetrics (FIGO) initiative on gestational diabetes mellitus: a pragmatic guide for diagnosis, management, and care. Int J Gynaecol Obstet. 2015;131(3):S173–S211.
- Eades CE, Cameron DM, Evans JMM. Prevalence of gestational diabetes mellitus in Europe: a meta-analysis. Diabetes Res Clin Pract. 2017;129:173–181.
- Reece EA. The fetal and maternal consequences of gestational diabetes mellitus. J Matern Fetal Neonatal Med. 2010;23(3):199–203.
- Metzger BE, Gabbe SG, Persson B, et al. International association of diabetes and pregnancy study groups recommendations on the diagnosis and classification of hyperglycemia in pregnancy. Diabetes Care. 2010;33(3):676–682.
- Kapur A, McIntyre HD, Divakar H, et al. Towards a global consensus on GDM diagnosis: light at the end of the tunnel? Int J Gynaecol Obstet. 2020;149(3):257–261.
- The Norwegian Directorate of Health. Nasjonal faglig retningslinje for svangerskapsdiabetes. 2017. Available from: https://www.helsedirektoratet.no/retningslinjer/svangerskapsdiabetes
- World Health Organization. Definition, diagnosis and classification of diabetes mellitus and its complications: report of a WHO consultation. Part 1, Diagnosis and classification of diabetes mellitus. 1999. Available from: https://apps.who.int/iris/handle/10665/66040
- Munang YN, Noubiap JJ, Danwang C, et al. Reproducibility of the 75 g oral glucose tolerance test for the diagnosis of gestational diabetes mellitus in a Sub-Saharan african population. BMC Res Notes. 2017;10(1):1–6.
- Berg JP. HbA1c as a diagnostic tool in diabetes mellitus. Nor J Epidemiol. 2013;23(1):5–8.
- Nathan DM, Turgeon H, Regan S. Relationship between glycated haemoglobin levels and mean glucose levels over time. Diabetologia. 2007;50(11):2239–2244.
- World Health Organization. Health experts accept use of HbA1c for diagnosing diabetes. 2011. Available from: https://www.who.int/chp/media/news/releases/2011_1_diabetes/en/
- English E, Idris I, Smith G, et al. The effect of anaemia and abnormalities of erythrocyte indices on HbA1c analysis: a systematic review. Diabetologia. 2015;58(7):1409–1421.
- Hashimoto K, Noguchi S, Morimoto Y, et al. A1C but not serum glycated albumin is elevated in late pregnancy owing to iron deficiency. Diabetes Care. 2008;31(10):1945–1948.
- Renz PB, Chume FC, Timm JRT, et al. Diagnostic accuracy of glycated hemoglobin for gestational diabetes mellitus: a systematic review and Meta-analysis. Clin Chem Lab Med. 2019;57(10):1435–1449.
- Koga M. Glycated albumin; clinical usefulness. Clin Chim Acta. 2014;433:96–104.
- Mendes N, Alves M, Andrade R, et al. Association between glycated albumin, fructosamine, and HbA1c with neonatal outcomes in a prospective cohort of women with gestational diabetes mellitus. Int J Gynecol Obstet. 2019;146(3):326–332.
- Li HP, Wang FH, Tao MF, et al. Association between glycemic control and birthweight with glycated albumin in Chinese women with gestational diabetes mellitus. J Diabetes Invest. 2016;7(1):48–55.
- Hiramatsu Y, Shimizu I, Omori Y, et al. Determination of reference intervals of glycated albumin and hemoglobin A1c in healthy pregnant Japanese women and analysis of their time courses and influencing factors during pregnancy. Endocr J. 2012;59(2):145–151.
- Dong Y, Zhai Y, Wang J, et al. Glycated albumin in pregnancy: reference intervals establishment and its predictive value in adverse pregnancy outcomes. BMC Pregnancy Childbirth. 2020;20(1):12.
- Agnello L, Lo Sasso B, Scazzone C, et al. Preliminary reference intervals of glycated albumin in healthy Caucasian pregnant women. Clin Chim Acta. 2021;519:227–230.
- Brede C, Hop B, Jørgensen K, et al. Measurement of glycated albumin in serum and plasma by LC-MS/MS. Scand J Clin Lab Invest. 2016;76(3):195–201.
- Gjessing HK, Grøttum P, Økland I, et al. Fetal size monitoring and birth-weight prediction: a new population-based approach. Ultrasound Obstet Gynecol. 2017;49(4):500–507.
- Shaklai N, Garlick RL, Bunn HF. Nonenzymatic glycosylation of human serum albumin alters its conformation and function. J Biol Chem. 1984;259(6):3812–3817.
- Clinical and Laboratory Standards Institute (CLSI). Defining, establishing, and verifying reference intervals in the clinical laboratory; approved guideline. 3rd ed. Wayne (PA): Clinical and Laboratory Standards Institute; 2008.
- Lekva T, Godang K, Michelsen AE, et al. Prediction of gestational diabetes mellitus and pre-diabetes 5 years postpartum using 75 g oral glucose tolerance test at 14–16 weeks’ gestation. Sci Rep. 2018;8(1):13392.
- Yang C, Li H, Wang Z, et al. Glycated albumin is a potential diagnostic tool for diabetes mellitus. Clin Med. 2012;12(6):568–571.
- Bellia C, Zaninotto M, Cosma C, et al. Clinical usefulness of glycated albumin in the diagnosis of diabetes: results from an Italian study. Clin Biochem. 2018;54:68–72.
- Renz PB, Cavagnolli G, Weinert LS, et al. HbA1c test as a tool in the diagnosis of gestational diabetes mellitus. PLoS One. 2015;10(8):e0135989.
- Bossuyt PM, Reitsma JB, Bruns DE, et al. STARD 2015: an updated list of essential items for reporting diagnostic accuracy studies. BMJ. 2015;351:h5527.
- Jones G, Barker A. Reference intervals. Clin Biochem Rev. 2008;29:93–97.
- Medisinsk fødselsregister. 2020. Available from: http://statistikkbank.fhi.no/mfr/
- Kohzuma T, Koga M. Lucica GA-L glycated albumin assay kit: a new diagnostic test for diabetes mellitus. Mol Diag Ther. 2010;14(1):49–51.
- Matsha TE, Korf M, Erasmus RT, et al. Reference interval determination for glycated albumin in defined subgroups of a South African population. Ann Clin Biochem. 2019;56(4):480–487.
- Koga M, Otsuki M, Matsumoto S, et al. Negative association of obesity and its related chronic inflammation with serum glycated albumin but not glycated hemoglobin levels. Clin Chim Acta. 2007;378(1–2):48–52.
- Saglam B, Uysal S, Sozdinler S, et al. Diagnostic value of glycemic markers HbA1c, 1,5-anhydroglucitol and glycated albumin in evaluating gestational diabetes mellitus. Ther Adv Endocrinol Metab. 2017;8(12):161–167.
- Zhu J, Chen Y, Li C, et al. The diagnostic value of glycated albumin in gestational diabetes mellitus. J Endocrinol Invest. 2018;41(1):121–128.
- Chume FC, Renz PB, Hernandez MK, et al. Is there a role for glycated albumin in the diagnosis of gestational diabetes mellitus? Endocrine. 2021;72(3):681–687.
- Lydersen S. The correlation is relative. Tidsskr nor Laegeforen. 2020;140(16). DOI:https://doi.org/10.4045/tidsskr.20.0483
- Koning SH, van Zanden JJ, Hoogenberg K, et al. New diagnostic criteria for gestational diabetes mellitus and their impact on the number of diagnoses and pregnancy outcomes. Diabetologia. 2018;61(4):800–809.
- Metzger BE, Lowe LP, Dyer AR, et al. Hyperglycemia and adverse pregnancy outcomes. N Engl J Med. 2008;358(19):1991–2002.
- Cheung NW, Moses RG. Gestational diabetes mellitus: is it time to reconsider the diagnostic criteria? Diabetes Care. 2018;41(7):1337–1338.
- Landon MB, Spong CY, Thom E, et al. A multicenter, randomized trial of treatment for mild gestational diabetes. N Engl J Med. 2009;361(14):1339–1348.
- Ryser Ruetschi J, Jornayvaz FR, Rivest R, et al. Fasting glycaemia to simplify screening for gestational diabetes. BJOG: Int J Obstet Gy. 2016;123(13):2219–2222.
- Agarwal MM, Dhatt GS, Shah SM. Gestational diabetes mellitus: simplifying the international association of diabetes and pregnancy diagnostic algorithm using fasting plasma glucose. Diabetes Care. 2010;33(9):2018–2020.