
 ?Mathematical formulae have been encoded as MathML and are displayed in this HTML version using MathJax in order to improve their display. Uncheck the box to turn MathJax off. This feature requires Javascript. Click on a formula to zoom.
Abstract
Immunoglobulins are affected by sex, age and region, so it is necessary to establish suitable reference intervals (RIs) for clinical diagnosis. Various statistical methods were used to calculate RIs, but there has been a lack of comparison among the methods. Research based on immunoglobulin RIs establishment with various methods would provide a methodological basis for further research. A total of 16,525 individuals were enrolled in the study. Individuals were selected in the medical examination center of First Hospital of Jilin University from 2014 to 2020. The lambda-mu-sigma (LMS) method was performed to evaluate the dynamic changes in analytes. RIs were calculated by parametric, non-parametric, Hoffman method and Bhattacharya method. Sex and age partitions were found for immunoglobulins G and immunoglobulin M. The levels of IgM showed no difference with age in males, but showed differences after 50 years of age in females. Circulating immunoglobulin A concentrations showed an increasing trend with age, and immunoglobulin M showed a fluctuating trend with age. Obvious difference (>5%) was commonly found among the four methods, however, the RIs established by the four methods all passed the verification with a high passing rate. Sex and age differences should be considered for immunoglobulins G and immunoglobulin M in clinical practice. The feasibility of the four indirect methods was proven, which would provides a methodological reference for further studies and benefit the application of clinical data.
Introduction
Immunoglobulins (Igs), the effector products of differentiated B cells and the regulators of the humoral immune response, play a chief role in the immunological defense mechanism for the human body [Citation1]. Three main components of Igs (IgG, IgM and IgA) are measured for many clinical conditions. Immunoglobulin G (IgG), a major serum glycoprotein that exerts the role of an antibody in the immune system, couples antigen recognition with a variety of effector functions via interactions with various IgG-binding proteins. Immunoglobulin A (IgA) is the second most prevalent antibody in the circulation and can passively and actively inhibit or initiate inflammatory responses [Citation2]. Immunoglobulin M (IgM) plays a pivotal role in both humoral and mucosal immunity [Citation3]. Indeed, the presence of a polyclonal gammopathy is well known in a variety of systemic autoimmune diseases and is likely the result of chronic inflammation [Citation4]. Mutual influences are usually found between Ig levels and diseases. High levels of Igs promote the development of inflammation, while the degree of inflammation is influenced by the levels of Igs which determine the progression or recovery of disease. The examination of serum Igs could determine not only primary and secondary immunodeficiencies but also autoimmune diseases and chronic liver diseases, which require suitable reference intervals (RIs) for auxiliary diagnosis [Citation5]. The RIs provided by the manufacturer have been used in many laboratories. However, RIs for Igs (IgG, IgA and IgM) may vary based on various physical and environmental condition, such as sex, age and geography. In addition, our research group has conducted some pilot studies in the early stage, and the results confirm that age, sex, and statistical methods have a certain influence on the RIs [Citation6,Citation7]. Hence, the International Federation of Clinical Chemistry (IFCC) and Clinical and Laboratory Standards Institute (CLSI) recommend that RIs should be derived locally [Citation8] so as to make an accurate clinical diagnosis.
The selection of healthy subjects is the first challenge in establishing suitable RIs. In the past, different screening methods were published to ensure the accuracy of the study, such as the exclusion criteria defined by the Scandinavian Committee [Citation9] or the strict selection approaches in the direct method recommended by CLSI [Citation8]. However, these methods are not convenient for practical application, especially for certain age groups. The Laboratory Information System (LIS) houses a large amount of patients’ data and has excellent value for the clinical studies. In contrast to direct techniques, indirect methods that collect data from the LIS have been developed in recent years and are well received in laboratory studies. The CLSI also recommends the indirect method as a suitable sampling method [Citation8]. Hence, the research based on routinely collected data has attracted more attention with the development of LIS [Citation10]. For the indirect method, various statistical methods were used to calculate RIs, including parametric, non-parametric, Hoffman, Bhattacharya method, Arzideh and Wosniok method [Citation11]. Studies on the Hoffman and Bhattacharya methods are more common than those on parametric and non-parametric methods [Citation12–14]. Hence, these two methods combined with parametric and non-parametric method were selected in the present study. There are specific formulas used in parametric and non-parametric method to calculate the RIs, and a Gaussian distribution is required for parametric methods. The Hoffman method is an alternative method for establishing RIs using existing patient data from laboratory databases and was proposed by biostatistician Robert G. Hoffmann [Citation15,Citation16]. Hoffmann began by plotting the cumulative frequency of a particular result against the analyte value on normal probability paper. He then chose the linear portion of the resulting graph, centered on the 50th percentile, therefore giving the most weight to these values. By extrapolating the linear portion of the graph, the 2.5th and 97.5th centiles could be calculated, representing the range which should include only apparently healthy individuals, if the assumptions made are valid. Bhattacharya method was originally devised to study the ‘Forkal length of the Porgy’ by an Indian fisheries inspector named Bhattacharya, which became the name for this method [Citation17]. A study on RIs used the basic theory of Bhattacharya to conduct a modification of the indirect method, which was found to be applicable to clinical chemistry [Citation18]. The algorithm assumed that the major part of the total unselected population could be considered ‘normal’ and that the overlap between this ‘healthy’ part and the abnormal (high and/or low) part was only partial. The linear range consisting of five or six points in the figure could be used to calculate the final RIs. Similar to other indirect methods, the advantages of the Hoffman and Bhattacharya methods were that they removed the need to recruit healthy individuals and instead utilized hospital data in a Gaussian distribution. Parametric and non-parametric method were more widely used, especially non-parametric method which was performed more commonly in our previous studies [Citation6,Citation19]. With the development of medical statistics, the Hoffman and Bhattacharya methods, as graphical methods with simple computer operations [Citation12], will exhibit application value and improve the calculation method of RIs to a certain extent. Hence, various methods need to be applied rather than use the same methods habitually. Accordingly, the most important premise for a method to be widely used was accuracy, hence, sufficient comparison and practice are necessary for various statistical methods. However, there were a lack of comparison studies on RIs establishment by various methods. In addition, there were currently no explicit criteria for indirect methods in RIs establishment at present, hence, these methods could be used arbitrarily in various researches. For the reason that different methods will produce different results, the importance of comparative studies among the four methods should be emphasized to provide methodological references for future studies.
This paper aims to establish suitable local RIs for Igs (IgG, IgA and IgM) with the data of LIS data using the parametric method, non-parametric method, Hoffman method and Bhattacharya method. Furthermore, comparisons with national standards (issued in 2018) [Citation20] and among the four methods, followed by the verification of derived RIs were performed to assess the accuracy and provide more significant reference value for practical research applications.
Materials and methods
Study population
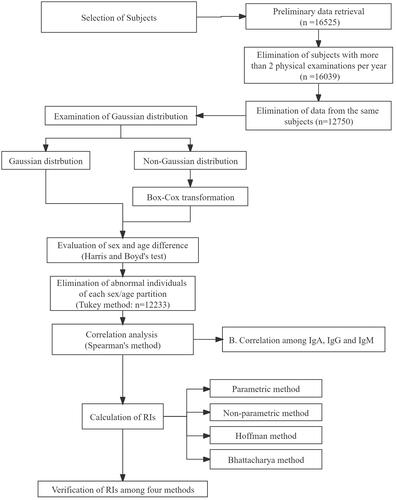
The individual test data were queried from the LIS database of the LIS at the First Hospital of Jilin University (Changchun, China) for the given test, demographic data (age and sex) and date. The data of 16,525 individuals who had undergone the immune function examination from January 2014 to November 2020 were downloaded. Patients were excluded if they had undergone testing twice or more per year or had gout, hypertension, diabetes, hyperlipidemia, coronary heart disease, myocardial infarction, liver disease, kidney disease or other systemic diseases. The inclusion criteria were the following: normal liver function, renal function, routine blood lipid tests, routine blood tests (white blood cells, neutrophils, lymphocytes, monocytes, basophils, eosinophils, red blood cells, hemoglobin, platelets) and routine urine tests (urinary white blood cells, urinary red blood cells, urinary crystals, urinary catheter type, urinary glucose, urinary bacteria). Duplicate samples were identified by samples with the same name, date of birth and/or reported age. If an individual had more than one measurement record during the period analyzed, only data from the first episode were included in the study. After the removal of duplicate data, a total of 12,233 individual results were enrolled for further research. The total protocol of this research is shown in . This study was approved by the Ethics Committee of the First Hospital of Jilin University (number: 2019249).
Figure 1. The research protocol. The corresponding n in each bracket represents the number of remaining subjects after elimination according to the standard.
Analytical measurement and quality control
The levels of IgA, IgM and IgG were measured by the nephelometric method using the Siemens BN-II automatic protein analyzer, and values were expressed as g/L with two decimal places. Regular maintenance, functional inspection, calibration, and quality control were performed on a BN-II automatic protein analyzer according to the manufacturer’s instructions. The internal quality control study was performed using two levels of control serum for the measurement of IgG, IgM and IgA. For each quantity, day-to-day imprecision and systematic error which could affect results were estimated from the pooled control results obtained in parallel to reference values. The specific calibrators and controls that have been calibrated against the ERM-DA470 certified reference material. The kit component (N Latex IgM/IgG/IgA, OQAC0) were used for traceability on BN Systems. The coefficient of variation (CV%) of intermediate precision for IgG, IgA and IgM were less than 7.0%. Quality assurance was performed according to the standard procedures of the laboratory. The analytical performance of the test is shown in .
Table 1. Analytical parameters of Ig activity obtained from the Siemens automatic protein analyzer, BNII.
Statistical method
Statistical tests were analyzed with SPSS 22.0 and Office EXCEL and the graphics were drawn with GraphPad Prism 8.0 software (GraphPad Software) and Minitab software. LMS chartmaker Light 2.54 (Medical Research Council) was used to estimate continuous centile curves of analytes.
Methods of RIs establishment
The Kolmogorov-Smirnov test was used to determine whether the data were normally distributed [Citation21]. Box-Cox transformation was performed if the data distribution exhibited a non-normal distribution. Harris and Boyd’s test (z test) was performed to access the sex and age difference of analytes, and the formulas were shown below. The maximum penalized likelihood estimation technique and the determination of the Box-Cox transformation λ (L), median μ (M) and coefficient of variation σ (S) were performed to construct continuous centile curves [Citation6]. The freedom of L, M, S could be adjusted and fit so as to make the continuous centile curves present continuous lines as a function of age. The z test was performed to analyze the differences of age subgroups which were observed on the curves:
Notes. X1, the mean value of the first group; X̅2, the mean value of the second group; S1, standard deviation (SD) of the first group; S2, SD of the second group; n1, number of the first group; n2, number of the second group
The Tukey method [Citation22] was used to further eliminate extreme outliers according to the sex and age partition. Outliers were defined as the data outside of the following lower limits (LL) or upper limits (UL). LL = P25 − 1.5 × IQR; UL = P75 + 1.5 × IQR (P25, 25th percentile; P75, 75th percentile; IQR, interquartile range). When an individual had outlier values, all data for this individual were eliminated to ensure the overall health level of the individual population. Iteration elimination was performed until there were no outliers in the data set. Spearman rank correlation analysis, a non-parametric method, was used to assess the relationships among Igs.
Parametric method, non-parametric method, Hoffman method and Bhattacharya method were used to determine the lower reference limits (LRL) and upper reference limits (URL). The RIs of the parametric method were calculated by the formula ‘x (mean value) ±1.96 s (standard deviation)’. Parametric RIs of IgG were calculated using the original data, and IgA and IgM RIs were calculated using the log10-transformed data. The 2.5th and 97.5th percentiles were calculated as the LRL and URL of RIs by non-parametric method. QQ plots and computer procedures were performed to establish RIs in the Hoffman method [Citation14]; The specific computer procedure of the Bhattacharya method was performed according to the previous study [Citation18]. Transformed Gaussian distribution data (log10) were used to perform Hoffman and Bhattacharya method. The 95% confidence intervals of the LRL and URL were calculated by the bootstrap program through random resampling of the same dataset for 1000 times [Citation23].
RIs comparison and verification
A comparison was performed between the RIs established in the present studies and the national standard of our country. In addition, the comparison was also performed among the RIs calculated by four statistical methods. The difference was taken into consideration and noted if the difference between the LRL or URL was more than 5% (>5%) of the compared RIs. Verification of RIs was performed by selecting 20 individuals randomly from the health examination center in the First Hospital of Jilin University according to the RIs establishment guideline of C28-A3.
Results
Individual characteristics and data analysis
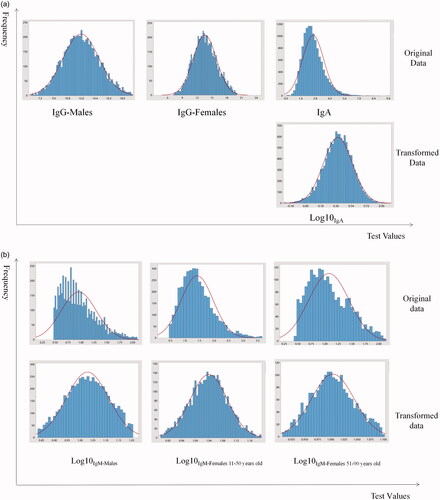
A total of 16,525 data points were detected from the LIS, 3775 data points were eliminated due to duplication and 12,750 data points corresponding to patients aged 6–102 years (6367 males and 6383 females) were initially enrolled for further analysis. IgG was normally distributed, as assessed by the Kolmogorov–Smirnov testnormal distribution, hence, Box-Cox transformation was performed to transform the IgA and IgM data with log 10 selected as the preferred transformation. The distributions of original data and transformed data were shown in .
Figure 2. Transformed data distribution of IgG, IgA and IgM. Transformed data were obtained by the Box-Cox method of IgG, IgA and IgM with log 10, which was selected as the preferred transformation.
Evaluation of sex/age differences and elimination of extreme values
The statistical significance of the sex difference existed in IgG (z = 22.89, z*=21.86; z > z*) and IgM (z= 39.42, z*=21.86; z> z*) based on the z test. Sex-specific levels of Igs were shown in . LMS curves were constructed to show the variation tendency with age, as shown in . The median lines (50th percentile) of the charts were used to interpret the trends of the Igs (IgG, IgA, IgM), since the physical condition could be represented by these lines. Concentrations of IgG remained stable throughout the entire age group. A slight increasing trend was found for IgA, but the concentrations of IgA remained stable between 40 and 60 years old. The levels of IgM showed a fluctuation trend throughout the age group, and a turning point was found in 40-year-old and 60-year-old females. Higher concentrations were found in females than in males. The results of the z test showed that the turning point for 50-year-olds observed on LMS curves in IgA (z= 7.98, z*=21.86; z< z*) and the point for 40-year-olds in IgM (z= 7.96, z*=15.45; z< z*) of males were not significantly different. In addition, a statistically significant difference in IgM was found between females less than and greater than 50 years old (z= 17.67, z*=15.47; z> z*), while the turning point for 60-year-olds (z= 12.12, z*=15.47; z< z*) was not significantly different. After sex and age partitioning, the Tukey method was used to eliminate the abnormal extreme values. shows the detailed elimination numbers of individuals through LL and UL for each iteration. Iteration elimination was performed for the IgG of males, and the elimination order was consistent with the analyte order in . After the total elimination process, 12,233 individuals (6121 males and 6112 females) remained for the calculation of RIs. A significant positive correlation was found between IgG and IgA (r = 0.265***) and IgG and IgM (r = 0.188***). Serum IgA and IgM lacked an obvious relationship according to Spearman analysis.
Figure 3. Sex-specific levels of Igs. The blue line indicates males, and the red line indicates females. Significant differences between groups are marked with ***.
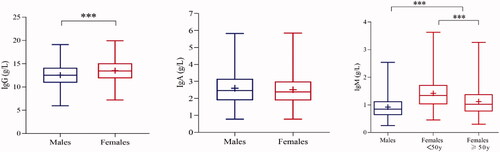
Figure 4. Scatter plot and LMS curves of IgG, IgA and IgM. The blue and yellow dots represent males and females, respectively.
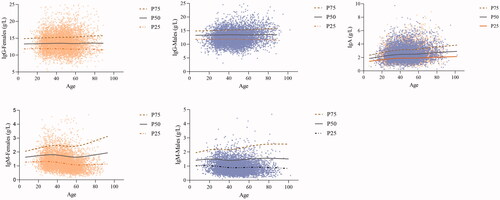
Table 2. The elimination results of the Tukey method.
Calculation of RIs
The final RIs were calculated by parametric method, non-parametric method Hoffman method and Bhattacharya method according to the partition results, as shown in . The graphical calculation plots of IgG, IgA and IgM were shown in and .
Figure 5. QQ plots of analytes. (a) IgA and IgG; (b) IgM. The equation corresponds to the linear part of the QQ plot.
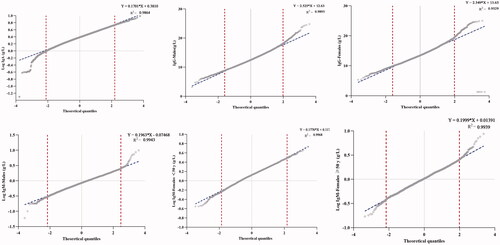
Figure 6. The calculation plots of the Bhattacharya method for IgG, IgA and IgM; Bhat, Bhattacharya method; Bhat included points within the selected linear range.
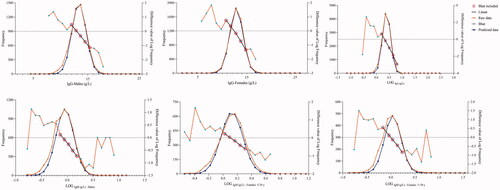
Table 3. The result of RIs calculated by the four methods.
Comparison analysis results
Wider RIs were found with the parametric method compared with the other methods, while the results of the Hoffman and Bhattacharya methods showed narrower RIs than those of the parametric and non-parametric methods. Compared with the parametric and non-parametric methods, the values of LRL and URL were commonly found to be higher (>5%) in the Hoffman and Bhattacharya methods. The LRL and URL of RIs determined by the parametric method were higher (>5%) than those of the non-parametric method for IgA, while the opposite result was found for IgG. The LRL of RIs determined by the parametric method for the IgM of females aged <50 years old and males were higher (>5%) than those determined by the non-parametric method. A less than 5% difference was found in IgG between the Hoffman and Bhattacharya methods. However, there were some differences (>5% higher) in the URL of Ig between the Bhattacharya and Hoffman methods. The LLRs of IgM for females aged <50 years old and males associated with the Bhattacharya method were higher (>5%) than those associated with the Hoffman method. Some differences (>5% higher) were also found in both the LRL and URL of IgM for females aged ≥50 years old between the Bhattacharya and Hoffman methods. There were some differences (>5% lower) in the IgG of males determined by the parametric method compared with the Hoffman and Bhattacharya methods, while a > 5% difference in the lower result was found for the parametric method compared with the Hoffman method for the IgG of females. The URL of RIs determined by the parametric method was higher (>5%) than those determined by the Hoffman method for IgA. The LRL of RIs determined by the parametric method was lower (>5%) than those determined by the Bhattacharya method for IgM in males. There were some differences (>5% lower) in the IgM of females aged ≥50 years observed from the parametric compared with Hoffman method. There were some differences (>5% lower) in IgG between the non-parametric method and the Hoffman method. The LRLs of IgA and IgM observed in the non-parametric method were lower than those in the Hoffman and Bhattacharya methods. The URL of IgM in females aged ≥50 years old and males was lower with the non-parametric method than the Hoffman method. includes the comparison results with previous studies.
Table 4. Comparison with previous studies.
The RIs observed in the present study by the indirect method for some, but not all, analytes were essentially comparable to the values reported in the national standard. The national standard was not partitioned according to sex for IgG; hence, various difference trends existed between the present study and the national standard in males and females. The LRLs of IgG in males in the parametric, non-parametric and Hoffman methods were all lower (>5%) than those in the national standard. However, higher results were found for the non-parametric, Hoffman and Bhattacharya methods for IgG in females. There were obvious differences (>5% higher) in IgA determined in this study than those in the national standard. Narrower RIs were found in the present studies of IgM in males compared with the national standard. There was no age partition in the national standard for IgM in females. The LRL of IgM in females aged ≥50 years old in this study was higher than that in the national standard, while a lower LRL and URL were found for IgM in females aged <50 years old.
Verification analysis results
Different partition groups were established between the national standard and the present study. Hence, to ensure the consistency of the validation population, the validation process was only carried out for the RIs obtained in this study. Verification of IgG, IgA and IgM in all four methods showed satisfactory results based on the eligibility criteria (passing rate ≥90%). RIs of IgA and IgM in males showed a 100% passing rate for the four methods. The same 95% passing rate was found for IgG and IgM (≥50 years old) in females. Higher passing rates of IgM were found in females (<50 years old) for the parametric and non-parametric methods than for the Hoffman and Bhattacharya methods.
Discussion
Selection of individuals and data processing
The selection of healthy individuals was one of the most important steps in the process of RI establishment. The indirect sampling technique has been widely used in many studies to establish RIs [Citation24,Citation25], but few studies have established Ig RIs. The individuals in LIS from examination center were selected in this study to avoid taking measures to recruit volunteers to participate in the study by a series of measures and enrolling the patients who suffered serious illness. Furthermore, some individuals were also eliminated by screening other clinical parameters, such as liver function and kidney function parameters, to avoid enrolling diseased individuals. There were always some extreme data in the study group, and the Tukey method could eliminate this type of outlier to make the established RIs more accurate. A specific formula was used to eliminate the extreme values of the dataset. Iteration elimination was needed in this process to fully clean the dataset. However, because of the physiologically high levels of IgA and downward trend of IgM with age, the Tukey method would excessively eliminate some ‘abnormal values’ that were actually normal before age partition. Hence, to avoid the consequence of overelimination, the Tukey method was employed after sex and age partitioning in each group.
Influence of age and sex on RIs
It was suggested that sex and age would influence the concentrations of analytes in the previous studies of our group; hence, sex and age were deemed as an essential factors with which to partition the RIs. In this study, RIs of IgM and IgG were partitioned according to sex. Higher levels of IgG in females were found in the present study, which was consistent with the results of a previous analysis of Wsex-specific levels of IgG. Another analysis indicated a general phenomenon, in which higher levels of IgG were found in females after vaccination; however, the underlying mechanism for differences in responses was unclear. The level of IgM in females was higher than that in males, which was in accordance with the results of previous studies [Citation13,Citation26]. There was emerging evidence that sex hormones impact microbial composition and the resulting immune response via secondary metabolite binding with receptors, such as estrogen receptors (ERs), and peroxisome proliferator-activated receptors (PPARs) etc. [Citation27]. Hence, researchers conjectured that hormone deficiency would decrease the ability of immune response, and other studies had proven that estrogen replacement therapy could improve this phenomenon [Citation28,Citation29]. In other words, estrogen stimulated the immune response and result in the higher levels of Igs in females than those in males.
Age was evaluated as a variable associated with abnormal IgM results in this study, which was not in agreement with other studies but was in accordance with Chinese multicenter studies [Citation13,Citation26,Citation30,Citation31]. The reason for the differences might be the selection of statistical methods and the physical conditions of females in various regions. In addition, systematic differences between statistical measurement methods might be recognized as possible explanations for the different results. Concentrations of IgM decreased rapidly in females between 40 years old and 60 years old which was the period of perimenopause for women. In this period, a series of physical and mental changes affected women due to a decrease in hormone levels [Citation30]. The previously mentioned theory that estrogen plays an important role in the immune response [Citation27,Citation30] could also be linked to the phenomenon of the lower concentration of IgM in females after 50 years of age in this study. Due to the innate high level of estrogen in females, the phenomenon of higher IgM levels in females compared with males remained even after accounting for the decrease in Igs after 50 years of age, which undoubtedly emphasized the important role of estrogen in the immune response. According to the LMS curves, IgA showed an increasing trend with age but no significant turning point. Diabetes, hypertension and other diseases could lead to an increase in IgA concentration, and an increasing trend would be found in the incidence rate of these diseases with age, which might be one of the most important reasons for the increasing trend of IgA. In addition, previous studies have reported higher concentrations of IgA in older individuals than in young individuals [Citation29,Citation32], reflecting the accumulation of chronic inflammation with age [Citation13,Citation26,Citation33].
Comparison with other studies
Sex partitioning for IgG was an obvious difference between the present study and the national standard. Higher IgG levels in females were found in this study compared with those in the national standard. The physical condition of local individuals was one of the reasons for this phenomenon, and different measurements and statistical methods would also affect the results. A partition difference in RIs was also found in the age of IgM. Although the national standard of IgM showed a sex partition, no specific age partition for IgM was shown in females. However, a significantly lower trend of IgM was found in females after 50 years of age in this study compared with those of the national standard. Due to the necessary role of estrogen in regulating the immune response, there was a possibility that the significantly decreasing trend of estrogen in our area might cause the low levels of IgM in the elderly females. In addition, the choice of the individual population might also account for this result. The RIs of IgM for the four methods established in this study were narrower than those in the national standard. To avoid over-diagnosis, different regional and environmental factors would have been considered during the national standard establishment, which would lead to results with wider intervals. Significantly higher IgA levels were shown in the present study than in the national standard. The main reason might be relate to geographical environment in which the individuals of this study lived exhibiting worse terrible climate conditions than other areas; hence, the ability to withstand infection would be stronger than that in other areas. In addition, different dietary habits would result in different incidence rates of some common diseases (such as diabetes and cardiovascular disease), which might cause differences in IgA levels. The above significant difference emphasized the significance of local RI establishment, which would provide more suitable application in practice. Different metrological traceability should be considered when establishing RIs, which could aid in the evaluation of the difference between the present RIs and official RIs of various analytes to help remind clinicians to choose more suitable RIs.
The RIs for IgG in this study were higher than those derived in Russia and Spain but lower than those derived in Kenya and India [Citation13,Citation26,Citation31]. A higher IgG result was also found in eastern and southern African countries. Individuals in countries closer to the equator tended to have a greater probability of contacting infectious pathogens; accordingly, higher serum levels of inflammatory markers were found in the populations of these regions [Citation34]. A higher level of IgA was found in the present study compared with other studies from India, Asia and Russia. The URL of IgM for males in this study was generally lower than that in other studies. Our observations might reflect generalized, nonspecific activation of immunoglobulin-producing B cells because of environmental factors, genetic predisposition and/or chronic infection. These discrepancies might be explained by region elements, different devices or individual selection. However, the levels of IgM in this study for females aged <50 years old showed similar results to those in other studies, which indicated that the effect of hormone levels on immunoglobulin would not be masked by regional and ethnic factors.
Comparison among four methods in RIs establishment
Various methods were used to establish RIs in the indirect method, and the comparison among the common methods might serve as a methodology framework for future studies. comparisons of RI calculation methods were always performed between parametric and non-parametric methods, while the Hoffman and Bhattacharya methods were added in the present study. The Hoffman and Bhattacharya methods presented herein were not fundamentally new but only represented the last link (currently) in a chain of precursor versions, which could all be traced back to the American biostatistician Robert G. Hoffmann and Bhattacharya [Citation16,Citation18]. The parametric, Hoffman and Bhattacharya methods all needed a Gaussian distribution for calculation. Similarly, the Hoffman and Bhattacharya methods determined the RIs visually by placing a straight line that was considered healthy through the central part of the points. The healthy status of individuals was required for the application of each method. Compared with parametric and non-parametric method, the Hoffman and Bhattacharya method could identify corresponding individuals who met the criteria for enrollment in the study directly through the lines. Hence, it was more convenient for clinical laboratories to establish RIs. In this case, it was obvious that a small number of abnormal individuals were enrolled. However, this would not significantly affect the result of actual RIs. Some studies had shown that an abnormal data rate of 10–30% in the study population would still not affect the reliability of the RIs [Citation35,Citation36]. The complex calculation procedure of the Hoffman and Bhattacharya methods, compared with the simple procedures with specific formulas for the parametric and non-parametric methods, might be the main reason for their wide application in research. The Hoffman and Bhattacharya methods should be performed by individuals with computer skills who were proficient in method application; however, these two methods exhibited a linear range, and calculating RIs through charts would be an innovative technique in laboratory studies.
The RIs calculated by Hoffman method and Bhattacharya method were much narrower than those by parametric and non-parametric method, which might be due to the strict definition of linear range. Higher levels (>5%) of LRL or URL were found with the Hoffman and Bhattacharya methods than with the parametric and non-parametric methods, but this phenomenon was not observed for IgG in females and IgM in males. However, in addition to the Hoffman ranges of IgG being approximately 10% narrower than the parametric RIs, most RIs of the Hoffman and Bhattacharya methods were wider than those of the parametric method, but the difference was within 5%. A subtle difference (<5%) was shown between the Hoffman and Bhattacharya methods. Although there was some difference among various methods, the verifications all showed a satisfactory result, which affirmed the practical value of the four methods. In addition, narrower RIs resulting from Hoffman and Bhattacharya methods would be expected given their resistance to outliers, the validation results (shown by the passing rate) showed that the subtle difference among the four methods might not have an actual influence on the practical application of the methods, which would provide a reference for the calculation results regarding the application of different indirect methods. There was no unified indirect method by which to establish RIs, and there was also no indication of which method was more accurate. The conclusion of which method could be considered as the most suitable one for the clinic could not be drawn from only one set. Further verifications, such as through direct methods, should be performed to ensure the accuracy of established RIs. Only by performing verification could researchers obtain more information on the usability of established RIs. The previous extensive use of non-parametric methods had made some limitations regarding the use of statistical method in RIs establishment. However, the Hoffman and Bhattacharya methods should receive more attention due to their convenience. The comparison among different methods required further research and discussion, and this study could provide a methodological reference for the use of various statistical methods for RI establishment according to personalized needs.
Limitations
Despite the careful and thorough selection of individuals using exclusion criteria and statistical methods, individuals with potential disease might have also been included in the study group. In addition, the use of different instruments or the factors associated with individual enrollment might have affected the test results. Therefore, when applying the RIs of the present study, it is necessary to verify the application of RIs.
Conclusion
In conclusion, this study first established the local sex-specific and age-specific RIs of Igs (IgG, IgA and IgM) by four indirect statistical methods (parametric, non-parametric, Hoffman and Bhattacharya methods). IgM and IgG were partitioned by sex or age in this study. Higher results were found using the Hoffman and Bhattacharya methods. The RIs derived by the four indirect methods were found to have slight differences but similar satisfactory verification results, which confirmed the practical significance of their application. The feasibility of the wide use of these statistical methods in combination with laboratory data was emphasized in this study, and a methodological reference was provided for future laboratory studies to perform more efficient clinical diagnoses.
Acknowledgments
Jiatong Chai wrote the main manuscript text and prepared the figures and tables. Zeyu Sun collected the data. Shunli Zhang guided the statistical analysis. Qi Zhou and Jiancheng Xu guided the writing process of the thesis. All authors reviewed the manuscript.
Disclosure statement
No potential conflict of interest was reported by the authors.
Data availability statement
The datasets analyzed during the current study are available from the corresponding author upon request.
Additional information
Funding
References
- Ahmed J, Zaman MM, Rouf MA, et al. Reference value of immunoglobulins in healthy school children of Bangladesh. J Epidemiol. 2001;11(6):263–265.
- Bakema JE, van Egmond M. Immunoglobulin A: a next generation of therapeutic antibodies?. MAbs. 2011;3(4):352–361.
- Li Y, Wang G, Li N, et al. Structural insights into immunoglobulin M. Science. 2020;367(6481):1014–1017.
- Duarte-Rey C, Bogdanos DP, Leung PS, et al. IgM predominance in autoimmune disease: genetics and gender. Autoimmun Rev. 2012;11(6–7):A404–A412.
- Bonilla FA, Khan DA, Ballas ZK, et al. Practice parameter for the diagnosis and management of primary immunodeficiency. J Allergy Clin Immunol. 2015;136(5):1186–1205.e1-78.
- Zhu X, Wang K, Zhou Q, et al. Age- and sex-specific pediatric reference intervals of serum electrolytes in Jilin province of China using the a priori approach. Am J Clin Pathol. 2020;154(5):708–720.
- Guo W, Zhou Q, Jia Y, et al. Division of myocardial enzyme reference intervals in population aged 1 to <18 years old based on fisher's optimal segmentation method. Comput Math Methods Med. 2020.
- CLSI Defining, establishing, and verifying reference intervals in the clinical laboratory (Approved Guidlin-Third Edition). CLSI Docucument. 2010;28:C28–A3.
- Alström T, Gräsbeck R, Hjelm M, et al. Recommendations concerning the collection of reference values in clinical chemistry and activity report by the committee on reference values of the Scandinavian society for clinical chemistry and clinical physiology. Scand J Clin Lab Invest Suppl. 1975;144:1–44.
- Concordet D, Geffré A, Braun JP, et al. A new approach for the determination of reference intervals from hospital-based data. Clin Chim Acta. 2009;405(1–2):43–48.
- Ozarda Y, Ichihara K, Jones G, IFCC Committee on Reference Intervals and Decision Limits (C-RIDL), et al. Comparison of reference intervals derived by direct and indirect methods based on compatible datasets obtained in Turkey. Clin Chim Acta. 2021;520:186–195.
- Jones GRD, Haeckel R, Loh TP, et al. Indirect methods for reference interval determination – review and recommendations. Clin Chem Lab Med. 2018;57(1):20–29.
- Omuse G, Ichihara K, Maina D, et al. Determination of reference intervals for common chemistry and immunoassay tests for Kenyan adults based on an internationally harmonized protocol and up-to-date statistical methods. PLoS One. 2020;15(7):e0235234.
- Wosniok GHRLW. Simple estimation of reference intervals from routine laboratory data. Lab Manage. 2016;39.
- Shaw JL, Cohen A, Konforte D, et al. Validity of establishing pediatric reference intervals based on hospital patient data: a comparison of the modified Hoffmann approach to CALIPER reference intervals obtained in healthy children. Clin Biochem. 2014;47(3):166–172.
- Hoffmann RG. Statistics in the practice of medicine. JAMA. 1963;185:864–873.
- Bhattacharya CG. A simple method of resolution of a distribution into gaussian components. Biometrics. 1967;23(1):115–135.
- Baadenhuijsen H, Smit JC. Indirect estimation of clinical chemical reference intervals from total hospital patient data: application of a modified Bhattacharya procedure. J Clin Chem Clin Biochem. 1985;23(12):829–839.
- Xu P, He B, Zhou Q, et al. Establishment of reference intervals for serum amylase and lipase: a large sample study based on Chinese healthy children. Scand J Clin Lab Invest. 2021;81(6):502–507.
- China NHCotPsRo. Reference intervals for common clinical biochemistry tests – Part 1: serum immunoglobulin A, immunoglobulin G and immunoglobulin M, complement 3 and complement 4. China:National Health Committee of the People’s Republic of China; 2018.
- Grecu DS, Paulescu E. Quality in post-analytical phase: indirect reference intervals for erythrocyte parameters of neonates. Clin Biochem. 2013;46(7–8):617–621.
- JW T. Exploratory data analysis. New York, NY: Addison-Wesley; 1977; p. 506.
- Chai J, Sun Z, Xing D, et al. The indirect method in the establishment of reference intervals for complement 3 and complement 4: a retrospective study. Journal of Taibah University Medical Sciences. 2022;17(3):353–361.
- Cheng D, Li X, Zhao S, et al. Establishment of thromboelastography reference intervals by indirect method and relevant factor analyses. J Clin Lab Anal. 2020;34(6):e23224.
- Delgado JA, Bauça JM, Pastor MI, et al. Use of data mining in the establishment of age-adjusted reference intervals for parathyroid hormone. Clin Chim Acta. 2020;508:217–220.
- Shah SAV, Ichihara K, Dherai AJ, et al. Reference intervals for 33 biochemical analytes in healthy Indian population: C-RIDL IFCC initiative. Clin Chem Lab Med. 2018;56(12):2093–2103.
- Qin X, Tang G, Qiu L, et al. A multicenter reference intervals study for specific proteins in China. Medicine (Baltimore). 2015;94(49):e2211.
- Evgina S, Ichihara K, Ruzhanskaya A, et al. Establishing reference intervals for major biochemical analytes for the Russian population: a research conducted as a part of the IFCC global study on reference values Clin Biochem. 2020;81:47–58.
- Taneja V. Sex hormones determine immune response. Front Immunol. 2018;WS/T 645-2018(9):1931.
- Kumru S, Godekmerdan A, Yilmaz B. Immune effects of surgical menopause and estrogen replacement therapy in peri-menopausal women. J Reprod Immunol. 2004;63(1):31–38.
- Yilmazer M, Fenkci V, Fenkci S, et al. Association of serum complement (C3, C4) and immunoglobulin (IgG, IgM) levels with hormone replacement therapy in healthy post-menopausal women. Hum Reprod. 2003;18(7):1531–1535.
- Khan SR, van der Burgh AC, Peeters RP, et al. Determinants of serum immunoglobulin levels: a systematic review and Meta-Analysis. Front Immunol. 2021;12:664526.
- Gonzalez-Quintela A, Alende R, Gude F, et al. Serum levels of immunoglobulins (IgG, IgA, IgM) in a general adult population and their relationship with alcohol consumption, smoking and common metabolic abnormalities. Clin Exp Immunol. 2008;151(1):42–50.
- Listì F, Candore G, Modica MA, et al. A study of serum immunoglobulin levels in elderly persons that provides new insights into B cell immunosenescence. Ann NY Acad Sci. 2006;1089:487–495.
- Liu J, Zhan S, Jia Y, et al. Retinol and α-tocopherol in pregnancy: establishment of reference intervals and associations with CBC. Matern Child Nutr. 2020;16(3):e12975.
- Katayev A, Balciza C, Seccombe DW. Establishing reference intervals for clinical laboratory test results: is there a better way? Am J Clin Pathol. 2010;133(2):180–186.