
 ?Mathematical formulae have been encoded as MathML and are displayed in this HTML version using MathJax in order to improve their display. Uncheck the box to turn MathJax off. This feature requires Javascript. Click on a formula to zoom.
Abstract
Background
It is crucial to improve the accuracy of HbA1c measurement as its essential role in diabetes diagnosis and treatment. We aimed to establish the biological variation (BV) and sigma metrics (SM) models and apply the models to evaluate the analytical performance of HbA1c in external quality assessment (EQA) program.
Methods
Data of HbA1c EQA (2021) and internal quality control (IQC) (March–August 2021) were collected. The group-specific bias and coefficient of variance (CV) were computed for measuring systems with laboratory number >9 in EQA program. The analytical bias and CV for individual laboratory were estimated from EQA and IQC data. The CV% and bias% were plotted in the BV-SM models for performance evaluation of measuring system and individual laboratory.
Results
Totally, 380 laboratories participated in EQA program. The overall inter-laboratory CV of five EQA samples ranged from 3.02% to 3.63%. There were five measuring systems that met the minimum performance for 5/5 samples: Arkary, Primus, Roche, Mindray and Tosoh, but none of them achieved the optimum performance. Half of the 196 laboratories that reported IQC and EQA results simultaneously achieved 3σ and minimum performance limits. Further analysis indicated that 88.8%, and 31.6% of the laboratories met the minimum performance for bias and CV, respectively.
Conclusions
The biological variation and sigma metrics are appropriate quality management models for evaluating the performance of HbA1c in EQA program. The intra-laboratory and inter-laboratory imprecision need to be improved in order to achieve the required analytical goals for diabetes diagnosis.
Introduction
Diabetes has become a critical health concern owing to its high prevalence and related disability and mortality [Citation1]. The estimated worldwide prevalence in people aged 20–79 years has risen to 463 million today and the number will jump to 578 million by 2030 without sufficient action [Citation2]. HbA1c is an essential target in diabetes diagnosis and treatment. The American Diabetes Association (ADA) has formally included HbA1c ≥6.5% as a diagnostic criterion for diabetes since 2010 [Citation3]. In 2011, the World Health Organization (WHO) has recommended that HbA1c can be used as a diagnostic test for diabetes, provided that the assays are standardized to criteria aligned to the international reference values [Citation4]. The new China Guideline for Type 2 Diabetes published in 2020 has also stated that HbA1c can be used as a supplementary diagnostic criterion for diabetes with standardized methods and stringent quality assurance.
Thus, it is crucial to improve the accuracy of HbA1c measurement. External quality assessment (EQA) program is a widely accepted tool for monitoring and improving method performance in clinical laboratories and plays a key role in achieving harmonization [Citation5]. As the EQA provider of Zhejiang province in China, Zhejiang Center for Clinical Laboratories (ZJCCL) has been providing EQA programs for more than 30 years. Currently, the acceptability of HbA1c measurement performance in EQA is usually simply assessed with passing rate model by comparing the difference between the result and the target value to the quality criteria, that is, allowable total error (TEa).
The Six Sigma (6σ) quality management is a globally used data-based and customer-centered quality management model. Sigma metrics (SM) evaluate process capability. In clinical laboratory, the application of 6σ quality management involves the combined use of quality criteria and analytical performance to quantitatively evaluate whether the performance meets clinical standards [Citation6]. According to the consensus reached at a Milan Conference in 2014, the performance specifications are based on (1) clinical outcome, (2) biological variation (BV), and (3) state of the art [Citation7]. The performance specifications based on BV are divided into three levels: minimum, desirable, and optimum performance. Even the minimum criterion is usually much stricter than the state of the art. To our knowledge, the BV and SM used in EQA results evaluation are not common. The combined models can assess EQA results from multiple perspectives and evaluate the performance more comprehensively. Hence, we aimed to establish the BV-SM models according to International Federation of Clinical Chemistry and Laboratory Medicine (IFCC) Task Force on Implementation of HbA1c Standardization (TF- HbA1c) [Citation8] and evaluate the analytical performance of HbA1c in EQA program with the BV-SM models.
Materials and methods
Study design
The data of HbA1c EQA program in 2021 were retrospectively reviewed. This EQA program was conducted once a year by ZJCCL with five samples (liquid control based human serum): lot 20210911 - lot 20210915, obtained from Bio-Rad Laboratories (California, America). Laboratories were also asked to provide internal quality control (IQC) data online from March to August 2021 to obtain the cumulative coefficient of variance (CV) of results in-control.
Biological variation model
In BV model, the quality criteria were set according to intra-individual biological variation (CVI) and inter-individual biological variation (CVG). For HbA1c, the data were 1.6% and 7.1% respectively, as referred to EFLM Biological Variation Database [Citation9]. The calculation of three quality criteria levels were performed as the formula:TEa=1.65 × f1 × CVI + f2× (CVI2+ CVG2)0.5 (minimum: f1 = 0.75, f2 = 0.375; desirable: f1 = 0.5, f2 = 0.25; optimum: f1 = 0.25, f2 = 0.125). According to the equation: TE = Bias + 2CV [Citation8], we used CV% as abscissa and Bias% as ordinate to draw the biological variation performance (). The three lines represented the limits for minimum, desirable, and optimum performance.
Figure 1. Biological variation and Sigma Metrics model. Quality criteria are shown in colors for the BV model (A) [minimum (MIN), optimum (OPT), desirable (DES)] and with lines for the SM model (B) (2σ–6σ). Two models were combined as shown in C.
![Figure 1. Biological variation and Sigma Metrics model. Quality criteria are shown in colors for the BV model (A) [minimum (MIN), optimum (OPT), desirable (DES)] and with lines for the SM model (B) (2σ–6σ). Two models were combined as shown in C.](/cms/asset/8e0067d3-b6b3-4a7b-aa65-c8f765042738/iclb_a_2100822_f0001_c.jpg)
Sigma metrics model
Sigma metrics were calculated using the following equation: σ = (TEa-|bias|)/CV. The College of American Pathologists (CAP) acceptance limit of ±6% was used. The SM model was drew similarly as the BV model, and divided into six grades by five lines (). 6σ represents the world’s first-class level; 5 ≤ σ < 6 implies ‘excellent performance’; 4 ≤ σ < 5 means ‘good performance’; 3 ≤ σ < 4 indicates ‘marginal quality’ and σ < 3 signifies ‘poor quality’ [Citation10].
Statistical analysis
Data analysis was performed using Excel 2010 (Microsoft Corporation, Redmond, WA, USA). Performance evaluation for measuring system and individual laboratory were conducted respectively.
Performance evaluation for measuring system: the performance of measuring system with the laboratory number > 9 after outlier exclusion in EQA was further analyzed, as recommended by the CAP in Proficiency Testing Manual [Citation11]. The overall average (Xtotal) was calculated using the robust algorithm described in ISO 13528 for five EQA samples as the target value [Citation12]. The group-specific average (Xgroup) and SDgroup were calculated according to ISO 13528 as well. Thus, the group-specific bias (Biasgroup) and CV (CVgroup) for each measuring system were calculated as follows:
The performance of individual measuring system was evaluated by the BV-SM models () using CVgroup and Biasgroup for five EQA samples, and the group-specific sigma (Sigmagroup) was computed.
Performance evaluation for individual laboratory: Laboratories that participated in HbA1c EQA and reported the IQC data simultaneously were included for further analysis. Laboratories were divided into different groups according to measuring systems and the group-specific robust average (Xgroup’) was calculated as the target value of each group for five samples. The analytical bias for individual laboratory was calculated using the following equations:
The SD (SDIQC) and average (XIQC) of IQC results in-control during March to August 2021 were calculated for individual laboratory, and the analytical CV was obtained as: CVanalytical = SDIQC/XIQC. The combined BV-SM models () were used to evaluate the performance of individual laboratory.
The three levels of performance specification for CV and bias based on biological variation were performed as: CVa = f1 × CVI, Biasa= f2× (CVI2+ CVG2)0.5 (minimum: f1 = 0.75, f2 = 0.375; desirable: f1 = 0.5, f2 = 0.25; optimum: f1 = 0.25, f2 = 0.125). Biasanalytical and CVanalytical were further compared to the three levels of quality criteria.
Results
Totally, 380 laboratories participated in 2021 HbA1c EQA program. The target values and overall inter-laboratory CVs of the five samples were 9.80% (3.02%), 5.52% (3.63%), 5.34% (3.58%), 13.04% (3.51%), and 13.39% (3.54%), respectively.
Measuring system performance
As displayed in , the number of laboratories reporting Tosoh was largest (113), and Roche was least (10). Overall, the sigma metrics were higher for Arkary and Mindray and lower for Bio-Rad and Medconn. demonstrated that the CVgroup varied from 1% to 3%, and the Biasgroup were much less than 1%. The performance for Arkary, Primus, Roche, Mindray and Tosoh met the minimum quality criteria for 5/5 samples, while none of them could achieve the optimum performance. For sigma metrics, only Arkary and Mindray showed a sigma value > 3 for all five samples.
Figure 2. Combined models applied to the performance evaluation for measuring systems. The colors represent five samples: blue, 20210911; red, 20210912; green, 20210913; black, 20210914; yellow, 20210915. The symbols represent specific manufacturers: ellipse, Arkary; rectangle, Bio-Rad; diamond, Medconn; triangle, Primus; down triangle, Roche; cross, Tosoh; star, Mindray; hexagon, Lifotronic.
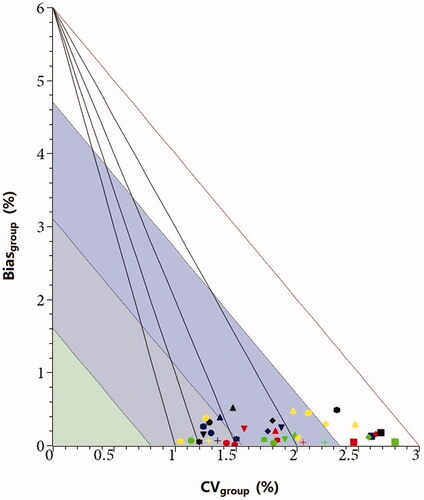
Table 1. The sigma metrics for measuring systems.
Individual laboratory performance
Totally 196 laboratories simultaneously submitted the IQC and EQA data for performance evaluation. The BV-SM models () showed that about half of the laboratories reached the minimum performance, while none was acceptable with optimum limit. Similarly, half of the laboratories obtained a sigma metric more than 3, of which 10 laboratories achieved 6σ. As displayed in , 88.8%, 63.3%, and 26% of the laboratories fulfilled the minimum, desirable, and optimum level of bias criteria. While for CV, less than one-third of the laboratories satisfied the minimum criteria, and only one laboratory achieved the optimum level.
Figure 3. Combined models applied to the performance evaluation for individual laboratory. The symbols represent specific manufacturers: ellipse, Arkary; rectangle, Bio-Rad; diamond, Medconn; triangle, Primus; down triangle, Roche; cross, Tosoh; star, Mindray; hexagon, Lifotronic.
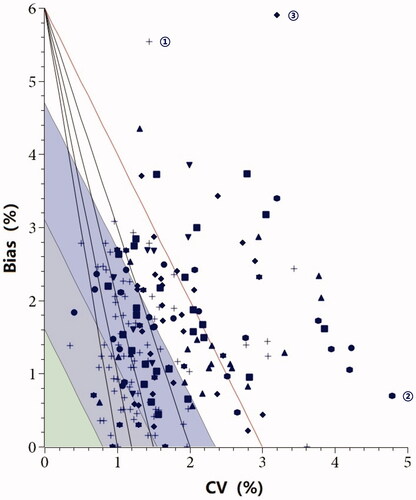
Table 2. The quality criteria based on biological variation and the number of laboratories that fulfill the criteria.
Discussion
With the increasing clinical value of HbA1c, it is essential to measure HbA1c with an accurate and precise method to diagnose and monitor diabetes mellitus [Citation13]. Studies suggest that a 0.5% bias might significantly increase the number of patients diagnosed with diabetes [Citation14]. A measuring system with a CV of 3.4% can report the result (true concentration was 6.1%) range from 5.6 to 6.6%, which might meet the ‘diabetes’ standard [Citation15]. A scientific evaluation scheme to understand the quality level of different systems seems more and more critical.
There are several methods with different principles for HbA1c measurement, such as capillary electrophoresis, ion-exchange high-performance liquid chromatography (HPLC), immunoassay and enzymatic assays [Citation16,Citation17]. In our study, only 10 laboratories used Roche system by enzymatic method in 2021 HbA1c EQA program, and others all used HPLC method with various systems. Participating in EQA program can promote harmonization of HbA1c measurement. We used the BV-SM models to evaluate the performance of HbA1c for measuring system and individual laboratory. Although various measuring systems showed different performance, all of them presented very low bias, indicating good consistency with the overall target value. The high inter-laboratory CV was the main reason for poor performance. In our HbA1c EQA program, the overall inter-laboratory CV was approximately 3.5%. As reported by the summary of CAP GH-5a 2021, the value ranged from 2.6–3.0%, and over 90% of laboratories were using methods with between-laboratory CVs < 3% for all five HbA1c levels [Citation18]. Laboratories should pay more attention to EQA reports and avoid using methods with high CVs.
It is evident that BV limits are more stringent than SM limits. The two key factors of the BV-SM Models are measurement imprecision and bias. The source of poor performance can be evaluated with the BV-SM Models: high bias for the laboratory marked with ‘①’ using Tosoh, high imprecision for the laboratory marked with ‘②’ using Lifotronic, and high bias and high imprecision for the laboratory marked with ‘③’ using Bio-Rad. Overall, the bias showed a better performance than CV for most laboratories. To a certain extent, imprecision improvements are still needed for most laboratories in order to achieve the required analytical goals for diabetes diagnosis, such as: instrument maintenance, daily check of reagent, personnel training.
This study also demonstrated the differences in the performance of laboratories using identical measuring systems. Take Tosoh as an example, there were seven laboratories falling within the 6σ line, while 6 laboratories falling outside the 2σ line. Similar results have been reported by other studies. Fasano et al. [Citation19] used sigma metrics to evaluate 20 assays performed on the Atellica chemistry and immunoassay analyzer in a multicenter study and demonstrated that individual sigma metrics varied across different laboratory sites. Taher et al. [Citation20] performed another multisite study and reported similar results. Hence, we believe that BV-SM models can be used to evaluate the performance of the analytes and contribute to comparing of measurement quality for different laboratories.
Our results found that different concentrations led to different sigma values. As exhibited in , the number of measuring systems with sigma < 3 was least for sample 20210911 (1/8) and largest for sample 20210915 (5/8). Zhou et al. [Citation21] also reported that different concentrations of the same analyte had significant differences in the sigma metrics. However, the sample concentration showed different effect on sigma metrics for different measuring systems. The sigma values of samples with low concentration were significantly lower for Medconn, Mindray and Tosoh, while the effect was not obvious for other systems. Therefore, the concentration should be considered when the BV-SM models are used to evaluate analytical performance, especially the medical decision level.
Some limitations of our study merit consideration. The target value of HbA1c was determined as the robust average of the results of participants, which is not a ‘true’ value. Thus, the bias evaluation in this study was vulnerable to the performance of participants. Second, the BV model was established based on the biological variation data according to the median value of the results from multiple studies. Whether the data are applicable to the population of our area is not verified. More studies are required to acquire reliable biological variation data and set quality criteria for HbA1c EQA program.
In conclusion, the biological variation and sigma metrics are appropriate quality management models for evaluating the performance of HbA1c in EQA program. As reflected by results, the overall performance needs to be improved in order to achieve the required analytical goals for diabetes diagnosis. The intra-laboratory imprecision and bias between laboratories areas of concern both for the laboratories and the manufacturers alike.
Acknowledgements
The authors thank all the laboratories that participated in the EQA program and reported the IQC data.
Disclosure statement
The authors declared no potential conflicts of interest with respect to the study, authorship, and publication of this article.
Additional information
Funding
References
- GBD 2016 Disease and Injury Incidence and Prevalence Collaborators Global, regional, and national incidence, prevalence, and years lived with disability for 328 diseases and injuries for 195 countries, 1990-2016: a systematic analysis for the global burden of disease study 2016. Lancet. 2017;390:1211–1259.
- International Diabetes Federation. International Diabetes Federation Diabetes atlas, nine edition. https://diabetesatlas.org/en/resources. (Update on 2021. 9-3).
- American Diabetes Association Diagnosis and classification of diabetes mellitus. Diabetes Care. 2013;36(Suppl 1):S67–S74.
- World Health Organization. Use of glycated haemoglobin (HbA1c) in the diagnosis of diabetes mellitus: Abbreviated report of a WHO consultation. Geneva: WHO, 2011.
- Miller WG. The role of proficiency testing in achieving standardization and harmonization between laboratories. Clin Biochem. 2009;42(4-5):232–235.
- Tetrault G. Evaluating laboratory performance with the six sigma scale. Arch Pathol Lab Med. 2000;124(12):1748–1749.
- Sandberg S, Fraser CG, Horvath AR, et al. Defining analytical performance specifications: Consensus statement from the 1st strategic conference of the European federation of clinical chemistry and laboratory medicine. Clin Chem Lab Med. 2015;53(6):833–835.
- Weykamp C, John G, Gillery P, IFCC Task Force on Implementation of HbA1c Standardization, et al. Investigation of 2 models to set and evaluate quality targets for hb a1c: biological variation and sigma-metrics. Clin Chem. 2015;61(5):752–759.
- EFLM. List of Matrices with Biological Variation Datasets. https://biologicalvariation.eu/bv_specifications/measurand. (Update on 2021. 9-3).
- Westgard JO, Westgard SA. The quality of laboratory testing today: an assessment of sigma metrics for analytic quality using performance data from proficiency testing surveys and the CLIA criteria for acceptable performance. Am J Clin Pathol. 2006;125(3):343–354.
- College of American Pathologists. Proficiency Testing Manual. https://documents.cap.org/documents/2019-ProficiencyTesting-Manual_FINAL.pdf.
- International Organization for Standardization. Statistical methods for use in proficiency testing by interlaboratory comparison. ISO 13528. Geneva: ISO, 2015.
- Heylen O, Van Neyghem S, Exterbille S, et al. Evaluation of the sebia CAPILLARYS 2 flex piercing for the measurement of HbA(1c) on venous and capillary blood samples. Am J Clin Pathol. 2014;141(6):867–877.
- Bruns DE, Boyd JC. Few point-of-care hemoglobin A1c assay methods meet clinical needs. Clin Chem. 2010;56(1):4–6.
- Weykamp C, Siebelder C. Evaluation of performance of laboratories and manufacturers within the framework of the IFCC model for quality targets of HbA1c. J Diabetes Sci Technol. 2018;12(4):747–752.
- Klingenberg O, Furuset T, Hestbråten CR, et al. HbA1c analysis by capillary electrophoresis - comparison with chromatography and an immunological method. Scand J Clin Lab Invest. 2017;77(6):458–464.
- Wu X, Chao Y, Wan Z, et al. A comparative evaluation of the analytical performances of capillarys 2 flex piercing, tosoh HLC-723 G8, premier Hb9210, and roche cobas c501 tina-quant gen 2 analyzers for HbA1c determination. Biochem Med (Zagreb). 2016;26(3):353–364.
- College of American Pathologists Survey Data. CAP GH-5a 2021 Summary. http://www.ngsp.org/CAPdata.asp (Update on 2021-9-3).
- Fasano T, Bedini JL, Fle PA, et al. Multi-site performance evaluation and sigma metrics of 20 assays on the atellica chemistry and immunoassay analyzers. Clin Chem Lab Med. 2019;58(1):59–68.
- Taher J, Cosme J, Renley BA, et al. A novel sigma metric encompasses global multi-site performance of 18 assays on the abbott alinity system. Clin Biochem. 2019;63:106–112.
- Zhou B, Wu Y, He H, et al. Practical application of six sigma management in analytical biochemistry processes in clinical settings. J Clin Lab Anal. 2020;34(1):e23126.