
 ?Mathematical formulae have been encoded as MathML and are displayed in this HTML version using MathJax in order to improve their display. Uncheck the box to turn MathJax off. This feature requires Javascript. Click on a formula to zoom.
Abstract
ARKRAY ADAMS A1c HA-8190V is a fully automated high-pressure liquid chromatography (HPLC) system for the measurement of HbA1c. The runtime is 58 s per sample in the Variant mode and 24 s per sample in the Fast mode. We evaluated the analytical performance of this analyzer in the Variant mode, to verify the quality of analysis, according to the consensus criteria established for this measurand. Reproducibility, trueness, carry-over, linearity, interferences and comparison with ARKRAY ADAMS A1c HA-8180V and HA-8180T analyzers were evaluated. Total CVs were 0.76% (IFCC units) 0.55 (NGSP units) at low HbA1c concentration and 0.85% (IFCC units) 0.68 (NGSP units) at high HbA1c concentration. Mean difference with the target values was −1.25 mmol/mol (−0.119%) and total error at medium level was 2.83% (IFCC units), 2.46% (NGSP units) Carry-over was 0%. Linearity was shown in the range 27–122 mmol/mol (4.6–13.3%). The results were not affected in the range of total Hb 59–199 g/L, labile fraction up to 5.5%, carbamylated up to Hb 6.3% nor acetylated Hb up to 5.3%. Method comparison demonstrated good concordance between the methods. The analyzer demonstrated a high analytical performance adequate for routine clinical use in laboratories with high workloads.
Introduction
Glycohemoglobin HbA1c, the N-terminal (1-deoxyfructosyl) valine glycation product of hemoglobin (Hb) A0, is the most important laboratory test for Diabetes Mellitus (DM) management. The relationship with the clinical outcome of diabetic patients has been convincingly demonstrated for both type 1 and type 2 DM in major clinical trials [Citation1,Citation2].
Measurement of HbA1c has been widely used to retrospectively evaluate long-term glycemic status in diabetic patients. More recently, the International Expert Committee published a report stating that type 2 diabetes could be diagnosed when HbA1c ≥6.5% (48 mmol/mol) [Citation3]. An extension of the role of this Hb fraction from monitoring to the screening and diagnosis of DM, leads to the possibility of even greater demand for this analysis.
The automation and precision of the high performance liquid chromatography (HPLC) methods have favored their use and the technical improvements have allowed the achievement of shorter analysis time [Citation4]. We have evaluated the analytical performance of ADAMS A1c HA-8190 Variant mode (ARKRAY Inc., Kyoto, Japan) to assess the quality of the measurement of HbA1c and to verify that the reduction in the time of analysis does not impair the overall quality of the results.
Materials and methods
Characteristics of the ARKRAY ADAMS A1C HA-8190 analyzer
This is a fully automated HPLC analyzer. The instrument is designed to measure HbA1c (range 9–195 mmol/mol International federation for Clinical Chemistry, IFCC units; 3.0 − 20.0% NGSP National Glycohemoglobin Standarization Program NGSP units), HbF as well; the system can detect common Hb variants Hb S, HbC, Hb D and HbE.
The runtime is 24 s per sample in the Fast mode and 58 s per sample in the Variant mode.
The instrument has a capacity of 100 samples per run; specimens are either primary tubes, or tubes for haemolysates and there is an option to insert urgent samples. In total, 8.0 µL of whole blood is automatically diluted (standard 1:100; anemic samples 1:50) and injected.
The instrument is calibrated with two calibrators, the reported result is derived from the ratio HbA1c/ total HbA, adjusted for calibration and expressed in both IFCC and NGSP units.
Samples and controls
Blood specimens were obtained from patients whose diabetic control was being assessed routinely and were used in this study according to the Hospital’s ethics guidelines. Whole blood samples were obtained during routine analysis and collected in K2-EDTA anticoagulant tubes (VacutainerTM Becton-Dickinson, Rutherford, NJ, USA).
Calibrators and quality-control materials used throughout the evaluations were provided by ARKRAY, Inc. (Calibrator Lite and extendSURETM lyophilized controls).
Protocol of evaluation
The evaluation was carried out over a period of 5 weeks. The analyzer was calibrated at the beginning of the evaluation, according to the manufacturer’s instructions in IFCC units (mmol/mol) and NGSP units (%) [Citation4,Citation5].
We used the Clinical and Laboratory Standards Institute (CLSI) guidelines to evaluate reproducibility, carry-over and linearity.
Trueness was evaluated to assess traceability to the IFCC reference measurement procedure and NGSP reference method, using IFCC targeted samples.
The effect of interfering substances were assessed according to the manufacturer’s protocols, using samples with increased concentration of labile HbA1c, carbamylated Hb and acetylated Hb. Specimens with a broad range of Hb concentrations were created to investigate the effect of anemia.
Comparisons of HA-8190V against our current routine methods (ARKRAY ADAMS A1c HA-8180V and ADAMS A1c HA-8180T) were performed.
Reproducibility
Within-run precision (intra-assay) was studied at two concentrations, using pooled blood from non-diabetic and poorly controlled diabetic adults; these samples were assayed 10-times. Mean value and coefficient of variation (CV) of the measurements were calculated.
Total imprecision was investigated using CLSI EP-5 A3 protocol [Citation6] with control materials (extendSURETM Canterbury Scientific, New Zealand). With this protocol, on 20 working days, 2 samples with low and high concentrations are assayed in duplicate twice a day in an analytical run, with at least 10 samples.
Trueness
We used IFCC HbA1c control set lot Munich 2021.509, to which IFCC targets, as well as derived NGSP targets, have been assigned by all approved laboratories in the IFCC network [Citation7]. Five samples were used, the target values were 31.4 mmol/mol (5.02%), 53.3 mmol/mol (7.02%), at three total Hb levels and 77.6 mmol/mol (9.25%).
Slopes and intercepts (calculated according to Deming and standard regression), along with their 95% confidence intervals, and the differences between measured and assigned target values were calculated.
Carry-over
The CLSI EP-10 protocol [Citation8] was used to evaluate carry-over between blood samples with high and low HbA1c concentration processing samples 3-times and sequentially, examining the first and third results of each triplet for systematic deviation, using the following formula (L1–L3)/(H3–L3)* 100.
Linearity
Linearity was estimated in accordance with protocol CLSI EP6 [Citation9]. Linear regression analysis was applied to compare expected and observed analytical values using results from proportional mixtures of samples with high and low HbA1c.
Effect of Hb concentration
The manufacturer’s claim is that haemoglobin concentration is between 45 and 140 g/L. We therefore investigated the effect of varying haemoglobin concentrations on chromatographic quantification.
One sample was centrifuged for 10 min at 3000 rpm to separate blood cells from plasma. Blood cells and plasma were mixed at the ratios 9:1, 8:2…1:9; the set of samples obtained had a broad haematocrit range.
Interferences
Potential interferences caused by other chemically modified haemoglobins were evaluated. The following protocol was performed to confirm the effective separation of the Schiff base peak.
Glucose incubation: pooled blood was split into six tubes; a Glucose solution was added to these test samples at increasing ratios to achieve final glucose concentrations ranging 11.1–55.5 mmol/L. These samples were incubated at 37 °C for 2 h and the labile fraction and Hb A1c results recorded.
The same procedure was employed for carbamylated Hb (cHb) with increasing concentrations of a sodium cyanide solution (up to 10 mmol/L), and for acetylated Hb (AcHb) with increasing concentrations of an acetaldehyde solution (range 2–10 mmol/L).
Method comparison
Comparisons of HA-8380V with our current routine methods (ARKRAY ADAMS A1c HA-8180V and ADAMS A1c HA-8180T) were carried out applying Passing–Bablok Linear Regression [Citation10] and Bland–Altman Analysis [Citation11], using samples from 120 diabetic and nondiabetic subjects being routinely monitored.
Hb variants
The detection of a Hb variant is a clinically relevant finding.
We analyzed most prevalent variants in our area, to investigate the ability of the system to detect and interpret them. All the Hb variants were analyzed at the time of our evaluation in the course of the routine health controls of the patients; the characterization was performed by electrophoretic methods and molecular analysis.
The effect of common Hb variants on HbA 1c results were also evaluated.
For this purpose, 12 samples from carriers (4 HbAS, 3 HbAC, 3 HbAD and 2 HbAE) were run in parallel on an affinity chromatography system (Premier Hb9210, Trinity Biotech), whose results were considered the target values.
Statistical analysis
Statistical analysis was performed using Microsoft Excel (version 5.10) and MedCalc (version 18.6; Ostend, Belgium).
Results
Reproducibility
Within-run precision (intra-assay): for low Hb A1c (35 mmol/mol, 5.4%) and high concentration (102 mmol/mol, 11.5%), CV was 0.15 and 0.21%, respectively (IFCC units), 0.09 and 0.17%, respectively (NGSP units).
Total imprecision: EP-5 defines four parameters for the precision, all listed in . For low control (HbA1c 35 mmol/mol, 5.4%) total CV was 0.68% (IFCC units) 0.55% (NGSP units); for high control (HbA1c 95 mmol/mol, 10.9%) total CV 0.85% (IFCC units) 0.68% (NGSP units).
Table 1. Reproducibility was investigated using CLSI EP-5 guideline with commercial controls with low and high HbA1c levels.
Trueness
Negative bias was observed, the mean difference was −1.25 mmol/mol −0.119% ().
Table 2. Trueness study, differences between measured and target values.
Deming regression (IFCC units) slope 0.987 (95% confidence interval CI 0.949 to 1.024) intercept −0.53 (95% CI −2.63 to 1.57).
Deming regression (NGSP units) rendered slope 0.988 (95% CI 0.950 to 1.034) intercept −0.066 (95% CI −0.323 to 0.272).
The confidence interval for slope included 1.000 and 0.0 for the intercept: this means that there is no significant difference between the HA-8190 V analyzer and the reference systems.
Total error at medium level 53.3 mmol/mol (7.02%) was 2.83% (IFCC units), 2.46% (NGSP units), lower than total the allowable error (4.4%), classified as very good results; this threshold is based on the IFCC certification criteria of the results of EP-5 and EP-9 guidelines.
Carry-over
Analyzing samples with concentrations 27–104 mmol/mol (4.6 and 11.7%) the percentage of carry-over was 0%.
Linearity
With regard to the linearity, the experiments performed so far proved that, in the whole physiopathological range, no deviation from the linearity was detected, as clear from the following equations ().
Figure 1. Linearity linear regression analysis was applied to compare expected and observed analytical values using results from proportional mixtures of samples with high and low HbA1c. Range 27–122 mmol/mol (4.6–13.3%).
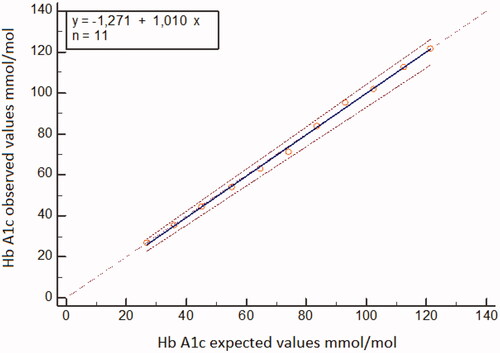
When using IFCC units in the Hb A1c range 27–122 mmol/mol the regression equation was
When using NGSP units in the HbA1c range 4.6–13.3% the regression equation was
Effect of Hb concentration
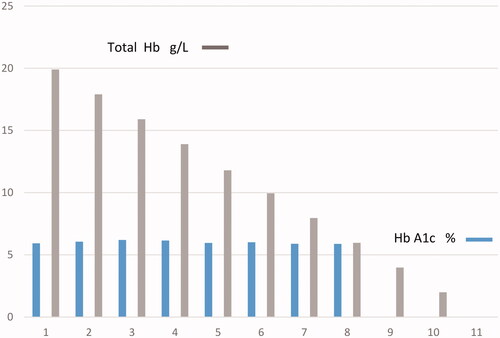
The range of total Hb was 59–199 g/L, reflecting diverse clinical conditions (severe anemia, normal status polycythemia); despite this fact the system was found to be robust, HbA1c 42 mmol/mol (6.0%) was not affected and the same value was obtained on all samples analyzed ().
Figure 2. Effect of total Hb concentration on HbA1c.
Interferences
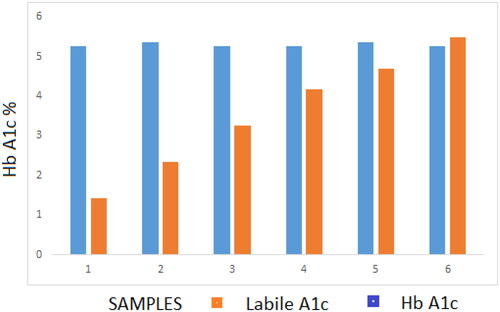
After the incubation with glucose, the labile fraction (LA1c) increased to fourfold the basal level (5.5%, in the sample with 55.5 mmol/L glucose) while HbA1C quantification remained stable within 0.11% at 5.4% (35 mmol/mol) ().
Figure 3. Effect of labile fraction on HbA1c.
The in-vitro experiments with sodium cyanate showed that the cHb fraction increased up to 6.3%, while the HbA1c fractions were stable within 0.2% of the value observed with the initial sample.
HbA1c 5.4% (35 mmol/mol) was not affected by AcHb 5.3%.
Method comparison
Both correlation studies with the devices currently in use in our laboratory were found very good with no significant bias as the equations obtained prove.
Correlation with ADAMS HA-8180V
When using IFCC units in the Hb A1c range 20–141 mmol/mol the regression equation was
The absolute mean difference was 0.7
When using NGSP units in the HbA1c range 4.0–15.1% the regression equation was
The absolute mean difference was 0.06
Correlation with ADAMS HA-8180T ()
Figure 4. Comparison between ARKRAY HA-8190V and ADAMS HA-8180T: 120 samples range 20–145 mmol/mol (4.0–15.4%) were run in parallel. (A) Passing – Bablok regression . (B) Bland–Altman plot, mean difference 1.2 mmol/mol (0.11%).
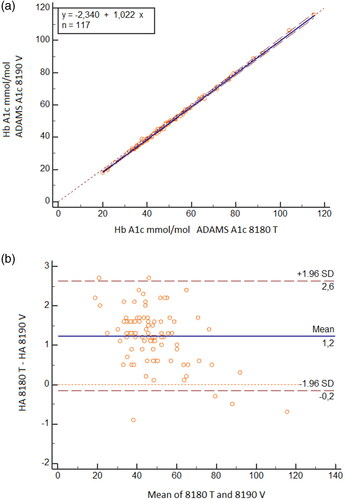
When using IFCC units in the Hb A1c range 20–145 mmol/mol the regression equation was
The mean difference was 1.2 mmol/mol
When using NGSP units in the HbA1c range 4.0–15.4% the regression equation was
The mean difference was 0.11%
Hb variants
The instrument can identify and report the presence of heterozygous HbS, HbC, HbD and HbE; for the homozygous Hb a flag ‘no Hb A1c’ is generated ().
Figure 5. Chromatograms of Hb variants.
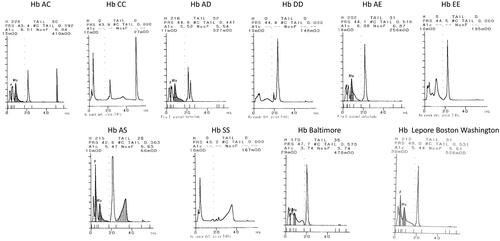
None of those Hb variants affected the correct measurement of HbA1c: no significant bias was observed mean differences < −1.05 mmol/mol (−0.16% NGSP).
Discussion
The consensus statement on the worldwide standardization and the IFCC reference method for the HbA1c measurement have contributed substantially to the quality of the HbA1c measurements [Citation3]. The assays that have the lowest variability due to imprecision provide a clearer picture of glycemic control, a reliable method can identify smaller changes as significant, contributing to best practice. The analytical requirements become even more important when HbA1c is applicable for screening and diagnosis of diabetes [Citation12].
Previous evaluations have demonstrated the evolution of Arkray instruments [Citation4,Citation5,Citation13–15]. The effect of total Hb concentration is negligible in a wider range in the new instrument and higher amount of Schiff base did not interfere with the analysis of HbA1c on HA-8190V when compared to HA-8180 [Citation4,Citation5,Citation13]. The present evaluation confirms the negative bias of results; nevertheless the excellent total CVs allowed good classification criteria the overall results [Citation14].
Biological variation has dictated the desirable targets for analytical performance of laboratory methods [Citation16]. However, it has been shown that the situation in diabetics is more complex, being affected by both clinical control and sampling time interval; a practical working CV for analytical reproducibility in long-term monitoring of 2.1% has been proposed [Citation17].
The analyzer achieved this stringent target in our evaluations revealed excellent reproducibility, far below the most stringent requirements of 2% [Citation18]. Based on the IFCC classification criteria the overall result would be considered Gold /excellent according to the quality targets [Citation19].
The results were reliable within a wide range of total Hb values; this feature shows the robustness of the system so, from a technical point of view, the patient could be controlled with confidence in different clinical situations (severe anemia, mild anemia, normal iron status, polycythemia). Nevertheless, clinical considerations must be taken into account when reporting HbA1c results in anemic patients, because anemia affects the erythropoiesis status and the life span of erythrocytes, so the correct interpretation of results could be compromised [Citation20–23].
Similar considerations can be raised when a Hb variant is present. Usually, the effect of Hb variants is evaluated in terms of analytical interference with Hb A1c measurement [Citation24]. From this point of view the results are not affected by common Hb variants, nevertheless it is important to consider the potential impact of Hb variants on the red cell cycle and the clinical interpretation of HbA1c results.
Technological advances have enabled modern analyzers with high resolution capabilities to handle potentially interfering components, thus obviating the need for pre-or on-column treatment to destroy this fraction before analysis.
Labile A1c, the concentration of which varies with blood glucose concentrations at the time of blood collection, is an intermediate in the production of the corresponding stable moiety. The isoelectric points of the labile fraction and its stable counterpart are so similar that can lead to little or no separation of the two peaks, giving misleading Hb A1c results.
Uremia derived from advanced stages of kidney failure can provide another potential interference with some methods, because in most of the commercially available systems cHb elutes in the labile fraction peak, acHb as well [Citation25,Citation26].
We have confirmed in vitro that the Schiff base is separated on the HA 8190 V system, irrespective of its concentration and the HbA1c value remains reliable.
Comparison of HA-8190V with ARKRAY ADAMS A1c HA-8180V and ADAMS A1c HA-8180T resulted excellent, so the new device can be used in parallel with confidence.
Conclusion
The reduction in the time of analysis does not impair the overall quality of the results.
The results were accurate and linear in the clinically significant analytical range.
The values were independent of the total concentration of Hb and the presence of Hb chemically modified Hb eluting in the labile fraction. Given the short time of the analysis this is a suitable system for the control of diabetic patients in laboratories with high workflow, mainly in areas with incidence of Hb variants.
Acknowledgments
The author thank Dr Beate Saeger and Mr Ibon Untzilla for their support and assistance.
Disclosure statement
No potential conflict of interest was reported by the author(s).
References
- The Diabetes Control and Complications Trial Research Group. The effect of intensive treatment of diabetes on the development and progression of long-term complications in insulin-dependent diabetes mellitus. N Engl J Med. 1993;329:977–986.
- UK Prospective Diabetes Study (UKPDS) Group. Intensive blood glucose control with sulphonylureas or insulin compared with conventional treatment and risk of complications in patients with type 2 diabetes (UKPDS 33). Lancet. 1998;352:837–853.
- The International Expert Committee. International Expert Committee Report on the role of the A1c assay in the diagnosis of diabetes. Diabetes Care. 2009;32:1327–1334.
- Urrechaga E. Analytical evaluation of the ADAMS ™ A1c HA-8180 thalassemia mode analyser for the measurement of HbA1c. J Clin Lab Anal. 2018;32(1):e22155.
- Weykamp C, Lenters-Westra E, van der Vuurst H, et al. Evaluation of the menarini/ARKRAY ADAMS A1c HA-8180V analyser for HbA1c. Clin Chem Lab Med. 2011;49(4):647–651.
- CLSI. User verification of precision and estimation of bias; approved guideline. 3rd ed. (CLSI document EP5-A3). Wayne (PA): clinical and Laboratory Standards Institute; 2014.
- Jeppsson J-O, Kobold U, Barr J, International Federation of Clinical Chemistry and Laboratory Medicine (IFCC), et al. Approved IFCC reference method for the measurement of HbA1c in human blood. Clin Chem Lab Med. 2002;40(1):78–89.
- CLSI. Preliminary evaluation of quantitative clinical laboratory measurement procedures; approved guideline. 3rd ed. (CLSI document EP10-A3-AMD). Wayne (PA): Clinical and Laboratory Standards Institute; 2014.
- CLSI. Evaluation of the linearity of quantitative measurement procedure: a statistical approach; approved guideline (CLSI document EP06-A). Wayne (PA): Clinical and Laboratory Standards Institute; 2003.
- Passing H, Bablok W. A new biometrical procedure for testing the equality of measurements from two different analytical methods. J Clin Chem Biochem. 1983;21(11):709–720.
- Bland JM, Altman DG. Statistical method for assessing agreement between two methods of clinical measurements. Lancet. 1986;1:307–310.
- Weykamp C, Siebelder C. Evaluation of performance of laboratories and manufacturers within the framework of the IFCC model for quality targets of HbA1c. J Diabetes Sci Technol. 2018;12(4):747–752.
- Urrechaga E. Evaluation of ADAMS ™ A1c HA-8180V HPLC analyzer for HbA1c determination. JLife SciUSA. 2012;6:456–460.
- van der Hagen EAE, Leppink S, Bokker K, et al. Evaluation of the ARKRAY HA-8190V instrument for HbA1c. Clin Chem Lab Med. 2021;59(5):965–970.
- Renata Paleari R, Mosca F, A, Ceriotti. Performance evaluation of ARKRAY HA-8190V system for measuring glycated hemoglobin. Biochim Clin. 2022;46:68–73.
- Ricós C, Iglesias N, Garcia-Lario JV, et al. Within subject biological variation in disease: collated data and clinical consequences. Ann Clin Biochem. 2007;44(Pt 4):343–352.
- Braga F, Dolci A, Montagnana M, et al. Revaluation of biological variability of glycated hemoglobin using an accurately designed protocol and an assay traceable to the IFCC reference system. Clin Chim Acta. 2011;412(15–16):1412–1416.
- Goodall I, Colman PG, Schneider HG, et al. Desirable performance standards for A1c analysis – precision, accuracy and standardisation. Clin Chem Lab Med. 2007;45:1083–1097.
- Weykamp C, John G, Gillery P, IFCC Task Force on Implementation of HbA1c Standardization, et al. Investigation of 2 models to set and evaluate quality targets for Hb A1c: biological variation and Sigma-Metrics. Clin Chem. 2015;61(5):752–759.
- Gallagher EJ, Le Roith D, Bloomgarden Z. Review of hemoglobin A(1c) in the management of diabetes. J Diabetes. 2009;1(1):9–17.
- Heinemann L, Freckmann G. Quality of HbA1c measurement in the practice. J Diabetes Sci Technol. 2015;9(3):687–695.
- Rodriguez-Segade S, Garcia JR, García-López JM, et al. Impact of mean cell hemoglobin on Hb A1c-defined glycemia status. Clin Chem. 2016;62(12):1570–1578.
- Urrechaga E. Influence of iron deficiency on Hb A1c levels in type 2 diabetic patients. Diab Met Syndr: Clin Res Rev. 2018;12(6):1051–1055.
- Rohlfing C, Hanson S, Estey MP, et al. Evaluation of interference from hemoglobin C, D, E and S traits on measurements of hemoglobin A1c by fifteen methods. Clin Chim Acta. 2021;522:31–35.
- Weykamp CW, Penders TJ, Siebelder CWM, et al. Interference of carbamylated and acetylated hemoglobins in assays of glycohemoglobin by HPLC, electrophoresis, affinity chromatography and enzyme immunoassay immunoassay. Clin Chem. 1993;39(1):138–142.
- Szymezak J, Lavalard E, Martin M, et al. Carbamylated hemoglobin remains a critical issue in HbA1c measurements. Clin Chem Lab Med. 2009;47(5):612–613.