
 ?Mathematical formulae have been encoded as MathML and are displayed in this HTML version using MathJax in order to improve their display. Uncheck the box to turn MathJax off. This feature requires Javascript. Click on a formula to zoom.
Abstract
Introduction
ARKRAY ADAMS A1c Lite HA-8380V is a fully automated high- performance liquid chromatography system for the measurement of HbA1c. We aimed to evaluate its analytical performance using the Variant Mode.
Methods
Carry-over, linearity, imprecision, trueness, interferences and comparison against ARKRAY ADAMS A1c HA-8180V and HA-8180T analyzers were studied.
Results
Total CVs 0.93% (IFCC units), 0.63% (NGSP units) at low concentration and 1.01% (IFCC) 0.74% (NGSP), at high concentration. Mean difference with the target values was −0.44 mmol/mol (IFCC) −0.04% (NGSP). Carry-over, linearity and method comparison were excellent.
The results were not affected in the range of total Hb 39-199 g/L, labile fraction 5.7%, carbamylated Hb 9.1% nor acetylated Hb 7.8%, effect of common variants was negligible.
Conclusions
the analyzer demonstrated very good analytical performances, according to the consensus criteria established for HbA1c; it is adequate for laboratories with medium-low workloads.
Introduction
Since the publication of the Diabetes Control and Complications Trial (DCCT) [Citation1] and UK Prospective Diabetes Study (UKPDS) [Citation2] clinical trials HbA1c has become the gold standard for medium- to long-term glycemic control, related to the clinical outcome of diabetic patients.
The innovations in technology and the international consensus to implement the International Federation for Clinical Chemistry (IFCC) standardization system for HbA1c measurement and the National Glycohemoglobin Standardization Program (NGSP) [Citation3] have led to improvements in the quality of the assays, so now Hba1c is also considered as a reliable test for screening and diagnosis of Diabetes Mellitus (DM) [Citation4,Citation5].
DM can be considered a pandemic with increasing figures around the world [Citation6]. This situation and the pressure for diagnosing undetected cases is increasing the demand and the desire for the availability of HbA1c testing in different clinical settings to support the management of the disease: not only laboratories in main hospitals but also those with low workloads could be interested in Hba1c analysis.
The author has conducted a verification of the analytical performance of the ADAMS A1c Lite HA-8380V Variant Mode (ARKRAY Inc., Kyoto, Japan) analyzer, assessing the quality of the measurement of HbA1c.
Materials and methods
Characteristics of the ARKRAY ADAMS A1c Lite HA-8380V analyzer
This automated analyzer has been designed specifically to meet the needs of diabetes clinics and laboratories in settings with low to medium workloads.
The instrument can measure HbA1c in the range 9–195 mmol/mol IFCC units (3.0%– 20.0% NGSP units). Also, Hemoglobin F (Hb F) and the most prevalent Hb variants (HbS, HbC, HbD and HbE) can be detected.
The measurement principle is HPLC reversed-phase cation exchange chromatography, and the Hb fractions are detected with a dual-wavelength (420 and 500 nm) LED-photodiode.
The runtime is 100 s per sample in the Fast mode and 160 s per sample in the Variant mode. The latter, the Variant mode, has been evaluated. The sample loading capacity is up to 10 samples, with 5 samples per rack. Specimens are either primary tubes with cap piercing (patient samples), or tubes or cups for hemolysates (calibrators, controls, patients with small sample volume, capillary whole blood) placed in specific racks. The sample volume is 4 µL whole blood (8 µL in an anemic sample) which will be automatically diluted (standard 1:161; anemic samples 1:81) and injected. The stainless steel ARKRAY column maintained at 40 °C, consists of a pre-filter and an analytical column packed with an ion-exchange resin (a hydrophilic polymer of methacrylate ester copolymer). Elution is achieved in a five-step phosphate-buffered gradient with increasing ionic strength, with three buffers.
The instrument is calibrated with two calibrators (low and high concentrations). The reported result is derived from the ratio HbA1c/total Hb A, adjusted for calibration, and expressed in both IFCC and NGSP units.
Samples and controls
Blood specimens were obtained from patients during their routine health controls, and were used in this study according to the Hospital Galdakao - Usansolo ‘s ethics guidelines. Whole blood samples were collected in K2-EDTA anticoagulant tubes (VacutainerTM Becton-Dickinson, Rutherford, NJ, USA). Calibrators and quality-control materials used throughout the evaluations were provided by ARKRAY, Inc. (Calibrator Lite and extendSURETM Haemoglobin A1c Lyophilised Controls).
Protocol of evaluation
The evaluation was carried out over a period of 5 weeks.
The analyzer was calibrated at the beginning of the evaluation, according to the manufacturer’s instructions in IFCC (mmol/mol) and NGSP (%) units.
Reproducibility, carry-over and linearity were evaluated according to Clinical & Laboratory Standards Institute (CLSI) guidelines, while the effect of interfering substances was assessed using the manufacturer’s recommended protocols.
Samples with high concentrations of labile HbA1c, carbamylated Hemoglobin (Hb) and acetylated Hb were used to investigate their interference with the measurement of HbA1c. Specimens with a broad range of total Hb concentrations were created to check the effect of total Hb concentration.
Comparison of HA-8380V with our current routine methods (ARKRAY ADAMS A1c HA-8180V and ADAMS A1c HA-8180T) was performed.
The effect of common Hb variants on HbA 1c results was also evaluated.
Statistical analysis
Statistical analysis was performed using Microsoft Excel (version 5.10) and MedCalc (version 18.6; Ostend, Belgium).
Reproducibility
Within-run imprecision (intra-assay) was studied at two concentrations, using pooled blood from non-diabetic and poorly controlled diabetic adults; these samples were assayed 10 times. The mean value and coefficient of variation (CV) of the measurements were calculated.
Total imprecision was investigated using CLSI EP-5 A3 protocol [Citation7] with control materials (extendSURE™ Canterbury Scientific, New Zealand). During 20 working days, two samples with low and high HbA1c concentrations were analysed in duplicate twice a day in an analytical run, with at least 10 samples.
Trueness
Trueness was evaluated to assess traceability to the IFCC reference measurement procedure and NGSP reference method, using IFCC-targeted samples according to the manufacturer’s protocol.
We used the IFCC HbA1c control set lot Munich 2021.509, to which IFCC targets and the derived NGSP targets, have been assigned by the laboratories in the IFCC network [Citation8]. This set included five samples, the target values were 31.4 mmol/mol (5.02%), 53.3 mmol/mol (7.02%) at three total Hb levels and 77.6 mmol/mol (9.25%).
Deming and standard regression were applied to calculate slopes and intercepts; the differences between measured and assigned target values were calculated.
Carry-over
The CLSI EP-10 protocol [Citation9] was used to evaluate carry-over
Three consecutive measurements of a sample with high HbA1c concentration (H1,H2, H3), followed by three consecutive measurements of another sample with HbA1c concentrations (L1, L2,L3) were assayed.
% carryover was calculated according to the following equation: (L1–L3)/(H3–L3)* 100.
Linearity
The protocol CLSI EP6 [Citation10] was used. Linear regression analysis was applied to compare calculated and measured analytical values using the results from proportional mixtures (9:1, 8:2…1:9) of specimens with high and low HbA1c.
Effect of Hb concentration
The manufacturer’s claim is that results are reliable in the total Hb range 45 g/L − 140 g/L. We, therefore, investigated the effect of varying Hb concentrations on the quantification.
One sample was centrifuged 10 min at 3000 rpm, then the blood cells and plasma were mixed at the ratios 9:1, 8:2…1:9 to obtain a set of samples with a broad Hb range.
Interferences
Potential interferences caused by other chemically modified Hbs on HbA1c analysis were evaluated. The following protocol was performed to confirm the effective separation of the Schiff base peak.
Glucose incubation: pooled blood was split into six tubes; a Glucose solution was added to these test samples at increasing ratios to achieve final glucose concentrations ranging 11.1–55.5 mmol/L. These samples were incubated at 37 °C for 2 h and the labile fraction and Hb A1c results were recorded.
The same procedure was employed for carbamylated Hb (cHb) adding concentrations of a sodium cyanide solution (up to 10 mmol/L), and for acetylated Hb (AcHb) with increasing concentrations of an acetaldehyde solution (range 2–10 mmol/L).
Method comparison
Comparison of HA-8380V against our current routine methods (ARKRAY ADAMS A1c HA-8180V and ADAMS A1c HA-8180T) was carried out applying Passing–Bablok Linear Regression [Citation11] and Bland–Altman Analysis [Citation12], using samples from 120 diabetic and nondiabetic patients.
Hb variants
The detection of a Hb variant is a clinically relevant finding. We analyzed the most prevalent variants to investigate the ability of the system to detect and interpret the unexpected peak.
The potential interference of common variants on HbA1c values was investigated. For this purpose, 12 samples from carriers (4 HbAS, 3 HbAC, 3 HbAD and 2 HbAE) were run in parallel on an affinity chromatography system (Premier Hb9210, Trinity Biotech), whose results were considered the target values.
Results
Reproducibility
Within-run imprecision (intra-assay), for low HbA1c 32.2 mmol/mol (5.1%) and high concentrations 102.2 mmol/mol (11.5%) CVs were 0.13% and 0.24% respectively (IFCC units), 0.10% and 0.21%, respectively (NGSP units).
The four parameters for the imprecision defined in the CLSI EP-5 A3 protocol are listed in .
Table 1. Reproducibility was investigated using CLSI EP-5 Guideline with commercial controls with low and high HbA1c levels.
For low control (HbA1c 35 mmol/mol, 5.4%) total CV was 0.93% (IFCC units) and 0.63% (NGSP units); for high control (HbA1c 95 mmol/mol, 10.9%) total CV was 1.01% (IFCC units) 0.74% (NGSP units).
Trueness
Negative bias was observed, the mean difference was −0.44 (IFCC units) and −0.04 (NGSP units).
Deming regression (IFCC units) rendered slope 0.970 (95% Confidence Interval CI 0.922-1.019) intercept 1.16 (95%CI −1.52–3.84).
Deming regression (NGSP units) rendered slope 0.978 (95% CI 0.927–1.030) intercept 0.180 (95%CI −0.218–0.503).
The confidence interval included 1.000 (slope) and 0.0 (intercept): this fact reflects the traceability and demonstrated no significant difference between the Adams Lite HA-8380V and the reference systems [Citation8].
Differences between target and measured values are shown in . Total error at 53.3 mmol/mol (7.02%) was 1.36% (IFCC units) and 1.35% (NGSP units), lower than total the allowable error (4.4%).
Table 2. Trueness study, differences between measured and target values.
Carry-over
Analyzing samples with concentrations 35 (L) and 91 (H) mmol/mol (5.3 and 10.5%) the percentage of carry-over was 0.16% (IFCC units) 0.18% (NGSP units).
Linearity ()
No deviation from the linearity was detected in the whole physiopathological range, as the equations obtained prove.
Figure 1. Linear regression analysis was applied to compare Expected and observed analytical values using results from proportional mixtures of samples with high and low HbA1c. Range 28–118 mmol/mol (4.7 – 13.0%).
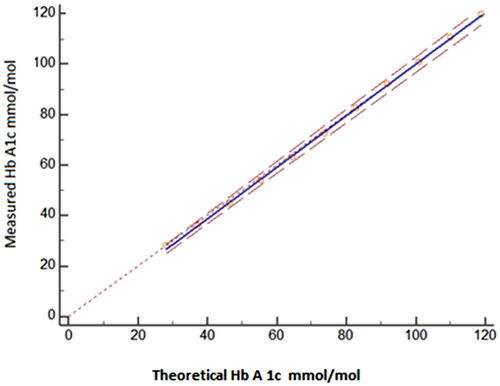
When using IFCC units in the Hb A1c range 28–118 mmol/mol.the regression equation was
When using NGSP units in the HbA1c range 4.7 − 13.0%. the regression equation was
Effect of Hb concentration ()
The range of total Hb reflected diverse clinical conditions (severe anemia, normal status, polycythemia); despite this fact HbA1c 42 mmol/mol (6.0%) was not affected by total Hb in the wide range 39–199 g/L.
Interferences
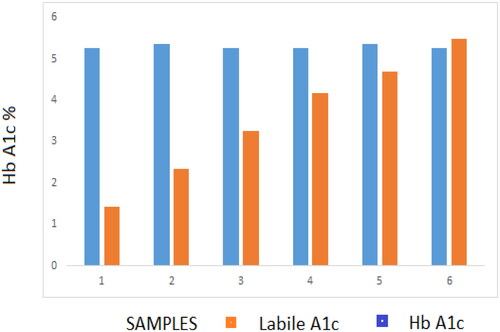
After the incubation with glucose, the labile fraction (LA1c) increased to fourfold the basal level (5.7%, in the sample with 55.5 mmol/L glucose) while HbA1c value remained stable at 35 mmol/mol (5.4%) ().
Figure 2. Effect of total Hb concentration on HbA1c.
Y axis on the left plots total Hb (g/dL, grey columns); Y axis on the right represents Hb A1c (%, blue columns).
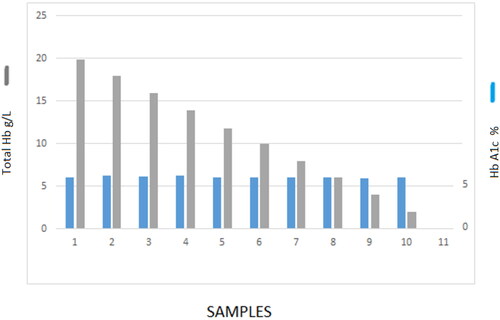
Figure 3. Effect of labile fraction on HbA1c.
The in-vitro experiments with sodium cyanate showed that the cHb fraction increased up to 9.1%, while the HbA1c value was stable within 0.2% of the value observed in the initial sample.
HbA1c 35 mmol/mol (5.4%) was not affected by AcHb 7.8%.
Method comparison
Both correlation studies with the HPLC analyzers currently in use in our Laboratory were found very good with no significant bias as the equations obtained prove.
Correlation with HA-8180V ()
Figure 4. Comparison between ARKRAY ADAMS A1C Lite HA-8380V and ADAMS HA-8180V: 120 samples range 20–141 Mmol/mol (4.0–15.1%) were run in parallel. (A) Passing – Bablok regression y = 1.005 x – 0.06; 95% Confidence Interval Slope 1.000–1.012; intercept −0.1125– −0.02. (B) Bland–Altman plot, mean difference 0.3 mmol/mol (0.02%).
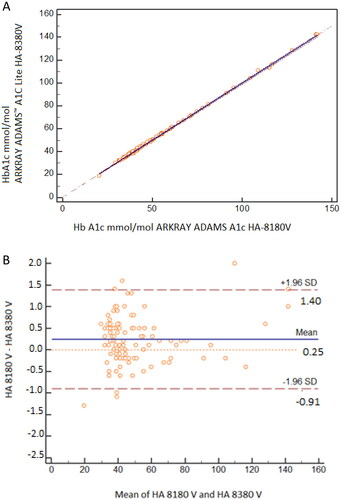
When using IFCC units in the Hb A1c range 20–141 mmol/mol the regression equation was
Mean difference 0.4 mmol/mol.
When using NGSP units in the HbA1c range 4.0–15.1% the regression equation was
Mean difference 0.02%.
Correlation with HA-8180T
When using IFCC units in the Hb A1c range 20–145 mmol/mol the regression equation was
Mean difference 0.5 mmol/mol.
When using NGSP units in the HbA1c range 4.0–15.4% the regression equation wa
Mean difference 0.04%.
Hb variants
It is shown that the instrument can identify and report the presence of heterozygous HbS, HbC, HbD and HbE; in respective homozygous Hb variants, a flag ‘no Hb A1c’ is generated ().
Figure 5. Common Hb variants.
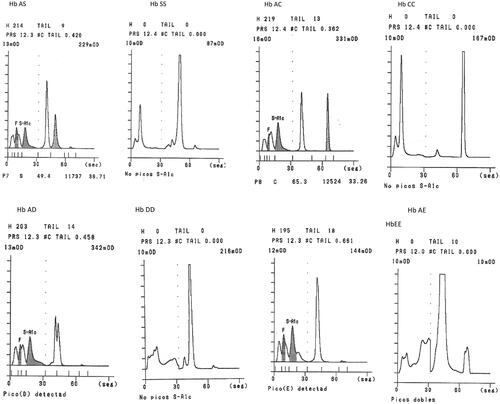
HbAS, HbAC, HbAD and HbAE did not affect the correct measurement of HbA1c: no significant bias was observed in mean differences < −1.05 mmol/mol (−0.16% NGSP).
Discussion
Quality in lab diagnostics is critical to ensuring the best possible patient outcomes. HbA1c is the cornerstone for DM management; therapeutic strategies rely on reproducible methods and precision is most important. The analytical requirements become even more important when HbA1c is used for screening and diagnosis of DM when unbiased methods are required [Citation13].
A high level of reproducibility in HbA1c measurement is a requirement in the provision of laboratory support for the process of diabetes monitoring. Changes in results obtained between patient visits to the physician must reflect the pathology of the disease and its response to treatment rather than analytical uncertainty. In this respect,
Biological variation generally has dictated the desirable targets for the analytical performance of laboratory methods. However, it has been shown that the situation in persons with diabetes is more complex, being affected by both clinical control and sampling time interval, and a practical working CV for analytical reproducibility in long-term monitoring of 2.1% has been proposed [Citation14].
The ADAMS A1c Lite HA-8380V analyzer achieved this target in our evaluations: excellent reproducibility was proven, far below the most stringent requirements of 2% [Citation15], in good agreement with the results reported by independent researchers in diverse evaluations of ARKRAY HPLC analyzers systems with high throughput [Citation16–20].
Based on the IFCC classification criteria the overall result would be considered Gold according to the quality targets [Citation21].
HbA1c testing drives best practices for quality patient care. This includes awareness of those conditions and circumstances that can compromise HbA1c result reliability and the evaluation of potential interferences.
The results were reliable within a wide range of total Hb values; this feature shows the robustness of the system so, from a technical point of view, the patient could be controlled with confidence in different clinical situations (severe anemia, mild anemia, latent iron deficiency, normal iron status, polycythemia). Nevertheless, clinical status must be considered when reporting HbA1c results in anemic patients: anemia affects the erythropoiesis and the life span of erythrocytes, so in this situation, the correct interpretation of results could be compromised [Citation22–25].
Similar considerations can be raised when a variant is present. Given the global occurrence of both Hb variants and DM it is common for the incidental detection of Hb variants during the HbA1c assay, based on separation principles [Citation26]. The detection of this abnormality by the laboratory professional must be reported to the clinician for further consideration of its implications, including genetic counseling [Citation27].
Usually, the effect of Hb variants is evaluated in terms of analytical interference with Hb A1c measurement [Citation28], our data suggest no significant interference of S, C, D and E traits. But it is important to understand the potential impact of hemoglobinopathies including thalassemia on the red cell cycle; for those patients, a non-hemoglobin-based method for assessing glycaemic control would be recommended, because the HbA1c level does not accurately reflect the long-term glycemic control [Citation29].
The isoelectric point of the chemically modified Hb closely approximates that of stable HbA1c, which can hamper the separation of the peaks. The technological advances have enabled modern analyzers with high-resolution capabilities to handle those potential interfering components. This issue has been demonstrated for the ADAMS A1c Lite HA-8380V. Our experiments show that there was no significant increase in the HbA1c after incubation with Glucose, suggesting that the tested method is specific for the stable HbA1c fraction.
Uremia is not uncommon in patients with renal disease and is recognized as a potential source of interference in some HbA1c methods [Citation30,Citation31].
We found a negligible effect on Hb A1c with cHb values increased to threefold the level found in our routine practice. But again physiological issues must be considered: the N-terminal valine of the β-globin chains is the target not only for glycation, but for carbamylation as well, and both reactions can compete for the same residues; so the clinical utility of Hb A1c in patients with advanced renal disease must be evaluated [Citation32].
In the same way, we have shown no interference of AcHb. This Hb is found in pregnant women, alcoholic patients or patients receiving aspirin. In clinical practice, the effect of aspirin on HbA1c is likely to be significant only when large doses are administered over a long period of time [Citation33,Citation34]. Nevertheless, those are ‘in vitro’ experiments and must be validated with clinical investigations.
The comparison with analyzers with high workflow capabilities resulted in excellent, so it could be used as a backup instrument.
Conclusions
Performance characteristics involve both reliability and practicability features. The former includes quality specifications, based upon clinical requirements for all laboratories irrespective of size, type or location. The latter include skills required, ease of operation, speed of analysis, with different values depending on the workload and laboratory characteristics.
The results were accurate and linear in the clinically significant analytical range. The values were independent of the total concentration of Hb and the presence of Hb chemically modified eluting in the Schiff base fraction.
This compact analyzer is suitable for the control of diabetic patients in laboratories with a middle-low workload with the requirement for the proven quality of HPLC technology.
Acknowledgments
The author wish to thank Dr Beate Saeger and Mr Ibon Untzilla for their support and assistance.
Disclosure statement
The author states no conflict of interest.
References
- The Diabetes Control and Complications Trial Research Group. The effect of intensive treatment of diabetes on the development and progression of long-term complications in insulin-dependent diabetes mellitus. N Eng J Med. 1993;329:977–986.
- UK Prospective Diabetes Study (UKPDS) Group. Intensive blood glucose control with sulphonylureas or insulin compared with conventional treatment and risk of complications in patients with type 2 diabetes (UKPDS 33.) Lancet. 1998;352:837–853.
- Consensus statement on the worldwide standardization of the haemoglobin A1C measurement: the American Diabetes Association. European association for the study of diabetes, international federation of clinical chemistry and laboratory medicine, and the international diabetes federation. Diabetes Care. 2007;30:2399–2400.
- World Health Organization. International diabetes federation. Definition and diagnosis of diabetes mellitus and intermediate hyperglycaemia: report of a WHO/IDF consultation. Geneva: WHO Press; 2006.
- American Diabetes Association. Standards of medical care in diabetes-2010. Diabetes Care. 2010;33:S11–S61.
- World Health Organization. Diabetes Fact Sheet. 30 October 2018. https://www.who.int/news-room/fact-sheets/detail/diabetes. Accessed 3rd December 2021.
- CLSI. User verification of precision and estimation of bias; approved guideline. 3rd Ed. CLSI document EP5-A3. Wayne (PA): Clinical and Laboratory Standards Institute; 2014.
- Jeppsson JO, Kobold U, Barr J. alApproved IFCC reference method for the measurement of HbA1c in human blood. Clin Chem Lab Med. 2002;40:78–89.
- CLSI. Preliminary evaluation of quantitative clinical laboratory measurement procedures; approved guideline. 3rd Ed. CLSI document EP10-A3-AMD. Wayne (PA): Clinical and Laboratory Standards Institute; 2014.
- CLSI. Evaluation of the linearity of quantitative measurement procedure: a statistical approach; approved guideline. CLSI Document EP06-A. Wayne (PA): Clinical and Laboratory Standards Institute; 2003.
- Passing H, Bablok W. A new biometrical procedure for testing the equality of measurements from two different analytical methods. J Clin Chem Clin Biochem. 1983; 21(11): 709–720. doi: 10.1515/cclm.1983.21.11.709.
- Bland JM, Altman DG. Statistical method for assessing agreement between two methods of clinical measurements. Lancet. 1986;327(8476):307–310. doi: 10.1016/S0140-6736(86)90837-8.
- Weykamp C, Siebelder C. Evaluation of performance of laboratories and manufacturers within the framework of the IFCC model for quality targets of HbA1c. J Diabetes Sci Technol. 2018;12(4):747–752. doi: 10.1177/1932296817741320.
- Braga F, Dolci A, Montagnana M, et al. Revaluation of biological variability of glycated hemoglobin using an accurately designed protocol and an assay traceable to the IFCC reference system. Clin Chim Acta. 2011;412(15–16):1412–1416. doi: 10.1016/j.cca.2011.04.014.
- Goodall I, Colman PG, Schneider HG, et al. Desirable performance standards for HbA1c analysis - Precision, accuracy, and standardisation: consensus statement of the Australasian association of 18 clinical biochemists (AACB), the Australian diabetes society (ADS), the royal 19 college of pathologists of Australasia (RCPA), endocrine society of Australia (ESA), and the Australian diabetes educators association (ADEA). Clin Chem Lab Med. 2007;45:1083–1097.
- Urrechaga E. Evaluation of ADAMS™ A1c HA-8180V HPLC analyzer for HbA1c determination. J Life Sci USA. 2012;6:456–460.
- Urrechaga E. Analytical evaluation of the ADAMS ™ A1c HA-8180 thalassemia mode analyser for the measurement of HbA1c. J Clin Lab Anal. 2018;32(1):e22155. doi: 10.1002/jcla.22155.
- Weykamp C, Lenters-Westra E, van der Vuurst H, et al. Evaluation of the menarini/ARKRAY ADAMS A1c HA-8180V analyser for HbA1c. Clin Chem Lab Med. 2011;49(4):647–651. doi: 10.1515/CCLM.2011.096.
- van der Hagen EAE, Leppink S, Bokker K, et al. Evaluation of the ARKRAY HA-8190V instrument for HbA1c. Clin Chem Lab Med. 2021;59(5):965–970. doi: 10.1515/cclm-2020-1300.
- Urrechaga E. Analytical evaluation and quality assessment of the ARKRAY ADAMS A1c HA-8190V for Hb A1c. Scand J Clin Lab Invest. 2023;83(2):136–142. doi: 10.1080/00365513.2023.2167231.
- Weykamp C, John G, Gillery P, et al. Investigation of 2 models to set and evaluate quality targets for Hb A1c: biological variation and sigma-metrics. Clin Chem. 2015;61(5):752–759. doi: 10.1373/clinchem.2014.235333.
- Gallagher EJ, Le Roith D, Bloomgarden Z. Review of hemoglobin A(1c) in the management of diabetes. J Diabetes. 2009;1(1):9–17. doi: 10.1111/j.1753-0407.2009.00009.x.
- Heinemann L, Freckmann G. Quality of HbA1c measurement in the practice. The german perspective. J Diabetes Sci Technol. 2015;9(3):687–695. doi: 10.1177/1932296815572254.
- Rodriguez-Segade S, Rodriguez Garcia J, García-López JM, et al. Impact of mean cell hemoglobin on Hb A1c-defined glycemia status. Clin Chem. 2016;62(12):1570–1578. doi: 10.1373/clinchem.2016.257659.
- Urrechaga E. Influence of iron deficiency on Hb A1c levels in type 2 diabetic patients. Diabetes Metab Syndr. 2018;12(6):1051–1055. doi: 10.1016/j.dsx.2018.06.024.
- Urrechaga E. Incidental detection of Hb disorders during HbA1c analysis. J Diabetes Sci Technol. 2015;9(3):713. doi: 10.1177/1932296815574727.
- Rhea JM. Impact of hemoglobin variants on HbA1c interpretation: do we assume too much? Med Lab Obser. 2012;6:8–14.
- Rohlfing C, Hanson S, Estey MP, et al. Evaluation of interference from hemoglobin C, D, E and S traits on measurements of hemoglobin A1c by fifteen methods. Clin Chim Acta. 2021;522:31–35. doi: 10.1016/j.cca.2021.07.027.
- http://www.ngsp.org/factors.asp. Accessed 10th May 2022.
- Little RR, Rohlfing CL, Tennill AL, et al. 35 Measurement of Hba1C in patients with chronic renal failure. Clin Chim Acta. 2013;418:73–76. doi: 10.1016/j.cca.2012.12.022.
- Desmons A, Jaisson S, Leroy N, et al. Labile glycated haemoglobin and carbamylated haemoglobin are still critical points for HbA1c measurement. Biochem Med. 2017;27(2):378–386. doi: 10.11613/BM.2017.039.
- Cercado AG, Álvarez Conde GB, Guadalupe Vargas ME, et al. Hemoglobin A1c, diabetes mellitus, diabetic nephropathy and chronic kidney disease. Rev Nefrol Dial Traspl. 2017;37(4):225–242.
- Finamore F, Priego-Capote F, Nolli S, et al. Aspirin-mediated acetylation of haemoglobin increases in presence of high glucose concentration and decreases protein glycation. EuPA Open Proteomics. 2015;8:116–127. doi: 10.1016/j.euprot.2015.04.003.
- Davison AS, Green BN, Roberts NB. Diabetes in pregnancy: effect on glycation and acetylation of the different chains of fetal and maternal hemoglobin. Clin Biochem. 2011;44(2–3):198–202. doi: 10.1016/j.clinbiochem.2010.09.015.