
Abstract
Phosphatidylethanol (PEth) are membrane molecules formed from phosphatidylcholine and ethanol through transphosphatidylation catalyzed by phospholipase D. Measurement of the main PEth form 16:0/18:1 is used as a specific and sensitive alcohol biomarker, since its formation requires ethanol, it accumulates in the blood upon repeated ethanol exposure, and it is only slowly eliminated during abstinence. PEth formation correlates with alcohol intake at the population level, albeit with considerable inter-individual variation as for the half-life during withdrawal. Over the past decade, the use of PEth has increased significantly and the applications have broadened. In Sweden, routine decision limits and the interpretation of test results for PEth were harmonized in 2013, using < 0.05 µmol/L (∼35 µg/L) as the recommended lower reporting limit and values > 0.30 µmol/L (∼210 µg/L) to indicate regular high alcohol intake. Routine test results show a large variation with about half being < 0.05 µmol/L and some even exceeding 10 µmol/L. In 2013, an external quality assessment (EQA) scheme for PEth 16:0/18:1 measurement in whole blood was also started (Equalis, Uppsala, Sweden), presently involving 56 laboratories from 13 countries. The agreement of PEth results between the laboratories has gradually improved to a CV < 15%. The current clinical and scientific information suggests that PEth values below the lower reporting limit (typically ∼0.03–0.05 µmol/L, or ∼20–35 µg/L) indicates sobriety or only low or occasional alcohol consumption, while regular high alcohol intake at levels corresponding to harmful drinking is required in most cases to reach PEth values > 0.30 µmol/L.
Introduction
Laboratory investigations are valuable and important objective tools in most areas of healthcare, to confirm health or detect disease and to monitor effects of and compliance with treatment. Test results are particularly useful in areas where obtaining reliable information by other means is challenging, such as through visual characteristics or verbal information. This applies not least to harmful use of alcohol, where there are no clear early clinical signs or symptoms and underreporting and denial are expected to occur. In addition, the possibility of confirming an alcohol intake by analysis of ethanol in breath or blood is limited to only a few hours afterwards, due to its rapid elimination [Citation1].
Long-term high alcohol consumption, on the other hand, causes various biochemical changes of body functions which can be measured and used as alcohol biomarkers. Liver function tests were introduced as such in the 1970s [Citation2] and have since been widely used, although it was early demonstrated that the sensitivity and specificity for alcohol were only moderate [Citation3]. Later, measurement of an alcohol-induced change in the glycosylation pattern of serum transferrin, called carbohydrate-deficient transferrin (CDT), was introduced as a more accurate routine biomarker to indicate harmful drinking levels before the onset of liver damage [Citation4]. Introduction of urine measurement of the conjugated ethanol metabolites ethyl glucuronide (EtG) and ethyl sulfate (EtS), which are detectable for ∼1–2 days after drinking, also extended the possibility to detect a single alcohol intake [Citation5].
Another alcohol-specific biomarker is phosphatidylethanol (PEth) that is measured in whole blood [Citation6]. PEth is a group of membrane molecules formed from phosphatidylcholine and ethanol by a transphosphatidylation reaction catalysed by phospholipase D (PLD). In the absence of ethanol, phosphatidylcholine is hydrolysed to phosphatidic acid. PEth consists of a glycerophosphoethanol group to which two fatty acids, the same or different, are attached. Hence, a large number of PEth forms have been identified [Citation7], originating from the corresponding phosphatidylcholines [Citation8,Citation9].
The basis for using PEth as an alcohol biomarker is that the formation requires ethanol, confirming high specificity, and that PEth accumulates in blood cell membranes with repeated ethanol exposure, and is eliminated only slowly during abstinence [Citation10]. In Sweden, where PEth was first detected and early introduced as a routine clinical test [Citation6,Citation11], an advisory group in drugs and toxicology of Equalis (Uppsala, Sweden), a not-for-profit provider of external quality assessment (EQA) schemes, published a recommendation for national harmonization of PEth measurement and decision limits in 2013 [Citation12], to facilitate comparability of results, and an EQA scheme was started. Over the past decade, the use of PEth has continued to increase and areas of use broadened, resulting in a growing demand for support on how the test results should be interpreted.
This work presents a general update on PEth as alcohol biomarker, together with experiences from routine PEth measurement at two Swedish hospital laboratories, and results of harmonization efforts within the Equalis EQA scheme for PEth.
Methods
PEth measurement
PEth is measured after extraction of phospholipids from cell membranes which in whole blood are almost exclusively derived from the erythrocytes [Citation13]. In Sweden, where PEth was early introduced as a routine alcohol biomarker [Citation11], measurement of the total amount was initially performed using a liquid chromatographic (HPLC) method with light scattering detection that did not distinguish between different subforms [Citation14]. An advantage of that method was that the test value constituted an overall measure of the ethanol reaction with all phosphatidylcholines. Disadvantages were an undefined and variable analyte, a relatively slow and complicated methodology causing problems with transferability, and that the method could measure only higher PEth concentrations that are reached after long-term heavy drinking [Citation14].
Later, liquid chromatographic–tandem mass spectrometric (LC–MS/MS) measurement of individual PEth forms was introduced [Citation8,Citation15], which was advantageous for method harmonization and comparability of test results. This methodology is also more sensitive and can detect lower PEth levels, corresponding to lower alcohol intake or drinking further back. Today, routine measurement of PEth is typically performed using automated LC–MS/MS methods [Citation16].
The PEth form that usually occurs in highest concentration in blood, and was demonstrated to be the single most sensitive form for use as alcohol biomarker [Citation17], contains one palmitic acid (16:0) and one oleic acid (18:1) and is called PEth 16:0/18:1. The PEth 16:0/18:1 concentration correlates well with total PEth and it is the single form on which most current clinical routine methods for PEth, and the Swedish harmonization, are based [Citation12]. In Sweden and Norway, the PEth value has since the start been reported in the unit µmol/L, while other countries have chosen to use µg/L (or the equivalent ng/mL). To translate a PEth value in μmol/L into μg/L or ng/mL, the value is multiplied by 703, the molecular weight of PEth 16:0/18:1.
An uncentrifuged venous EDTA whole blood sample is recommended for use [Citation12]. The sample can be stored for a couple of days at room temperature, for several weeks in the fridge, or at −80 °C for longer time, without the PEth value being affected [Citation15,Citation18–20]. Capillary blood collected on filter paper (dried blood spots, DBS) may also be used [Citation21–23].
Statistics
The Equalis EQA scheme for PEth uses the ‘Algorithm A’ method (ISO 13528:2015) to calculate the mean and spread of results (standard deviation, coefficient of variation, CV), to minimize the impact of extreme values. Other statistical calculations were performed using MedCalc software (Ostend, Belgium).
Results
Results from routine measurement of PEth
At two major Swedish hospital laboratories, the demand for PEth measurements has continued to rise steadily over the past decade and exceeds the number of CDT measurements (see one example in ). According to current (2020–2021) statistics from these laboratories, each based on more than 60,000 PEth measurements annually, there was consistency in the overall distribution of test results where 45/51% of all results fell below 0.05 µmol/L, 23/24% between 0.05–0.30 µmol/L, 16/19% between 0.30–1.0 µmol/L, and 10/12% above 1.0 µmol/L (). Single PEth readings have even exceeded 10 µmol/L. In the Swedish PEth harmonization initiative of 2013 [Citation12], PEth values below 0.05 µmol/L (∼35 µg/L) were interpreted as sobriety or low or only sporadic alcohol consumption, while values above 0.30 µmol/L (∼210 µg/L) were indicative of regular high alcohol intake.
Figure 1. Change in number of whole blood phosphatidylethanol (PEth) tests performed per year over the last decade at the Karolinska University Laboratory (Stockholm, Sweden), relative to the number of tests in 2013 when PEth measurement was harmonized in Sweden [Citation12]. For comparison, the corresponding results for another commonly used alcohol biomarker in blood, serum carbohydrate-deficient transferrin (CDT), is also presented.
![Figure 1. Change in number of whole blood phosphatidylethanol (PEth) tests performed per year over the last decade at the Karolinska University Laboratory (Stockholm, Sweden), relative to the number of tests in 2013 when PEth measurement was harmonized in Sweden [Citation12]. For comparison, the corresponding results for another commonly used alcohol biomarker in blood, serum carbohydrate-deficient transferrin (CDT), is also presented.](/cms/asset/dc8bec60-896a-42ad-b937-a1847eb77a23/iclb_a_2253734_f0001_c.jpg)
Figure 2. Relative distribution of phosphatidylethanol 16:0/18:1 (PEth) values in whole blood samples from clinical routine PEth measurement at the Skåne University Hospital (Lund, Sweden) and the Karolinska University Laboratory (Stockholm, Sweden) in 2020–2021 (each based on > 60,000 measurements annually). Insert: Results from the Karolinska were also presented separately for samples from drug dependence units, showing overall higher PEth values (* p < 0.0001; chi-squared test), and all other units. According to a Swedish harmonization of PEth measurement in 2013 [Citation12], values below 0.05 µmol/L indicate sobriety or only low or sporadic alcohol consumption, values in the range 0.05–0.30 µmol/L confirm alcohol consumption from a low to a high level, and values above 0.30 µmol/L indicate regular high, harmful alcohol consumption.
![Figure 2. Relative distribution of phosphatidylethanol 16:0/18:1 (PEth) values in whole blood samples from clinical routine PEth measurement at the Skåne University Hospital (Lund, Sweden) and the Karolinska University Laboratory (Stockholm, Sweden) in 2020–2021 (each based on > 60,000 measurements annually). Insert: Results from the Karolinska were also presented separately for samples from drug dependence units, showing overall higher PEth values (* p < 0.0001; chi-squared test), and all other units. According to a Swedish harmonization of PEth measurement in 2013 [Citation12], values below 0.05 µmol/L indicate sobriety or only low or sporadic alcohol consumption, values in the range 0.05–0.30 µmol/L confirm alcohol consumption from a low to a high level, and values above 0.30 µmol/L indicate regular high, harmful alcohol consumption.](/cms/asset/f6f92dd3-c381-4a7b-94fc-03f4b216c5d0/iclb_a_2253734_f0002_c.jpg)
Blood samples submitted for PEth testing originate from many different parts of healthcare, such as addiction care and psychiatry, occupational healthcare, primary care, and internal medicine. When the PEth results at one laboratory were separated between samples from addiction care and all other units, a significantly higher proportion of high PEth values was noted in the former group ().
Results from external quality assessment of PEth measurement
In parallel with the Swedish initiative for national harmonization of PEth analysis in 2013, which included recommendations for uniform decision limits and how test results should be interpreted [Citation12], Equalis started an EQA scheme for PEth 16:0/18:1 measurement in whole blood (Phosphatidyl ethanol, article nr 295), consisting of four rounds per year and three samples in each round. High analytical quality and consistency of results between laboratories is required, for the use of common decision limits. In line with the increased and broadened clinical and medico-legal uses of PEth, starting in Sweden but later also internationally, the number of laboratories participating in the EQA scheme has risen steadily from originally 6 Swedish laboratories to today 56 from 13 countries (12 European and Australia), of which 15 participants are Swedish and 19 from the other Nordic countries.
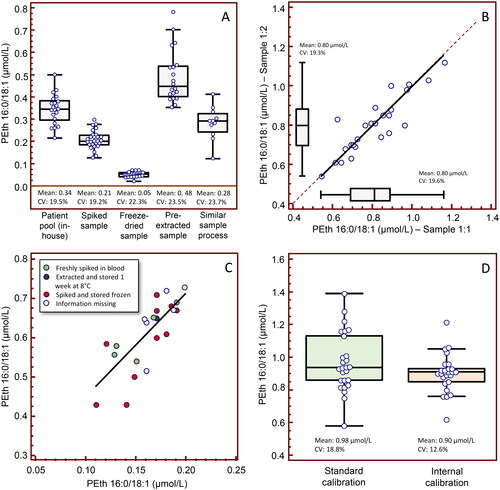
In addition to the self-help assistance that participation in an EQA scheme provides to laboratories, by receiving blinded samples for analysis and feedback on the own and others’ results in comparison to the target values, the expert group has worked for better agreement by recommending standard routines for sample processing (e.g. using hemolyzed blood) and through distribution of specially designed test materials and follow-up activities. The variation of reported PEth results has historically been relatively large, with CV values at ∼20% irrespective of the PEth level, both for native patient pools and various treated sample materials (). Since the intra-laboratory variation has typically been much smaller (), this pointed at a calibration problem, but, upon enquiry, no clear differences in PEth results emerged depending on how the calibrators were prepared (). Nevertheless, using two blinded EQA samples with assigned PEth values as low and high calibrators and recalculating the value for a third sample with a concentration in between, the internal-calibrated variation in results was significantly lower (), confirming that the variation was largely due to differences in calibration of the method. A general recommendation is that storage of calibrators prepared in blood should be at −80 °C and the time at room temperature or refrigeration minimized.
Figure 3. Results from harmonization activities in the Equalis (Uppsala, Sweden) external quality assessment (EQA) scheme for measurement of phosphatidylethanol 16:0/18:1 (PEth; Phosphatidyl ethanol, article nr 295) in whole blood, showing A) a relatively large spread in reported PEth values (N = 11–27) with coefficients of variation (CV) at ∼20%, irrespective of the PEth level with native patient pools using in-house methods (round 2018:01), with various treated sample materials (freeze-dried, spiked and pre-extracted pools) (rounds 2019:01 and 2018:02), and use of the same sample processing method (Swedish laboratories only; round 2018:04). Shown are Box-and-whisker plots. B) The intra-laboratory variation was generally much smaller (< 10%), although the results for 5 laboratories differed 12–34%, indicating that the larger inter-individual difference was due to calibration problems. Shown are passing & bablok regression (y = 0.000 + 1.000 x) and Box-and-whisker plots for two identical blinded EQA samples distributed in the same round (round 2018:05). However, upon enquiry, (C) no clear differences in PEth results emerged depending on how the calibrators were prepared (N = 22). (D) Using two blinded EQA samples with assigned PEth values as low and high calibrators and recalculating the value for a third sample with a concentration in between (round 2019:01), the internal-calibrated CV was significantly lower (N = 26), confirming that the spread was largely due to differences in method calibration.
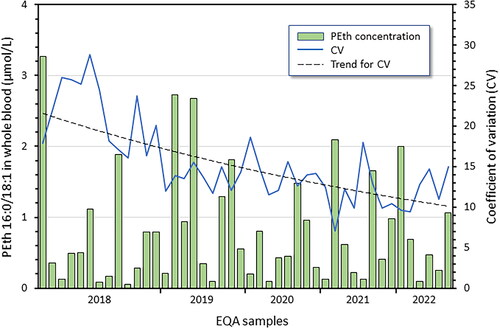
Since then, the concordance of PEth results between the Swedish laboratories in the Equalis EQA scheme has gradually improved, from > 20% CV in 2018 to ∼12% in 2021–2022, regardless of the PEth level in the tested range 0.05–3.3 µmol/L (). The overall quality goal of the EQA scheme is that the own result should not deviate more than ± 20% from the average value, and this has improved over the years and was fulfilled in the last two years by 79–91% of all participants (79–100% for Swedish participants).
Figure 4. Results from the Equalis (Uppsala, Sweden) external quality assessment (EQA) scheme for measurement of phosphatidylethanol 16:0/18:1 (PEth; Phosphatidyl ethanol, article nr 295) in whole blood. Shown are the average PEth values in control materials distributed during 2018–2022, the variation in reported values (CV) for the Swedish laboratories (N = 13–15), and a trend line for the CV. The overall agreement of PEth results has gradually improved and the average CV fallen from > 20% in 2018 to ∼12% in 2021–2022, independent of the PEth level in the tested range 0.05–3.3 µmol/L.
Today in Sweden, all but one laboratory still uses the originally harmonized lower reporting limit for PEth of < 0.05 µmol/L [Citation12], although most laboratories can accurately measure lower levels. Elsewhere in Europe, 20 µg/L, or ∼0.03 µmol/L, is commonly used. The stated lower quantification limit (LLOQ) for all participants in the EQA scheme is currently 0.002–0.05 µmol/L.
Discussion
Risk of PEth formation after blood sampling
Blood collected from an individual who is under the influence of alcohol probably always contains some PEth, as the formation begins shortly after each ethanol intake [Citation24]. Moreover, if the blood sample is not handled as instructed, PEth formation may continue from ethanol in the test tube and cause a falsely high result. However, if patient samples are not stored longer than a few days at room temperature, and not frozen at −20 °C because PLD is active at low temperature, the risk that a positive PEth sample would be clinically misleading due to additional formation in the test tube is small [Citation15]. Nevertheless, blood samples for PEth measurement should preferably be collected when the patient is sober, which, if suspected or as a clinical routine, can be checked with a breath alcohol test. Sampling capillary blood on filter paper treated with a PLD inhibitor eliminates the risk of continued PEth formation [Citation21].
In two studies of patient blood samples submitted for PEth testing, ethanol was found to be present in 4% and 12%, respectively [Citation15,Citation25], implying a risk of continued formation after sampling. It should be noted that the PEth levels in these samples were so high that they could not fully be explained by formation in the test tube. The presence of ethanol in patient blood samples largely depends on the population being investigated ().
Clinical assessment of PEth values
In the Swedish PEth harmonization from 2013 [Citation12], values below 0.05 µmol/L were interpreted as sobriety or only low or sporadic alcohol consumption, while values above 0.30 µmol/L were indicative of regular high alcohol intake. The choice of 0.05 µmol/L as the lower reporting limit was largely based on the laboratories at that time not being able to measure lower levels with sufficiently high precision. A large Norwegian population-based self-report health study [Citation26] recently suggested ∼0.05 µmol/L to be a suitable cut-off to distinguish between those drinking more or less than one standard drink (12 g ethanol) per day on average, but, as the results were based on self-reports, there is a risk of under-reporting.
Use of a lower reporting limit for PEth has been suggested [Citation27,Citation28], e.g. based on the desire to identify women who consume alcohol during pregnancy [Citation29] or to confirm sobriety in patients on the waiting list for liver transplant [Citation30,Citation31]. Today, many routine PEth laboratories can accurately measure values down to at least ∼0.03 µmol/L, but even with this reporting limit a negative PEth result does not rule out recent alcohol intake [Citation28]. To confirm total sobriety, measurement of EtG and EtS in urine samples covering alcohol intake over the last 1–2 days is an alternative option [Citation5,Citation32].
Hence, since the clinical judgement will not change, the gain of further lowering the lower decision limit for PEth, which also increases the risk for false positive results due to frequent use of ethanol-based hand sanitizer, which was common during the covid-19 pandemic, or mouthwash [Citation33,Citation34], may be limited. Given the increasing use and broader applications of PEth testing [Citation35], the lower reporting limit should be adapted to the routine methods used in hospital laboratories and not to that in special laboratories. Furthermore, it should be noticed that the reported PEth result for an EQA patient sample with a target (and mean) value of 0.05 µmol/L actually varied between 0.03–0.07 µmol/L (23 laboratories from 5 countries participated).
PEth values after single doses of ethanol
In an experimental study where 75 subjects were dosed with 20 g ethanol on three consecutive evenings and blood samples were collected on each following day, the PEth peak value was 0.06 µmol/L after the third day [Citation28]. In other studies with a single ethanol dose of 0.25–0.80 g/kg body weight, corresponding to ∼20–65 g ethanol for an 80-kg person, PEth could be detected in the blood within 30 min and the peak value was 0.21 µmol/L [Citation24,Citation36]. Higher ethanol doses generally produced higher PEth values but with large inter-individual variation, despite the intake was adapted to the body weight. In a study where subjects drank a single dose estimated to produce a blood ethanol concentration (BEC) of 0.1% (measured 0.06–0.11%) [Citation37], peak PEth values ranged between ∼0.05–0.17 µmol/L in those who tested negative for PEth at baseline and remained abstinent during the study period, and PEth was measurable for several days afterwards.
The participants in the dosing studies regularly used alcohol and some showed measurable PEth values at baseline, despite being asked to abstain from alcohol some time before. However, this could only partly explain the large inter-individual variations that are always observed. When 12 subjects who reportedly had abstained from alcohol for one month were administered single ethanol doses up to ∼0.6 g/kg, no PEth values above 0.03 µmol/L (∼20 µg/L) were detected at any time after drinking [Citation38]. This seemingly lower PEth response compared to other dosing studies [Citation24,Citation36] suggested that the PEth formation may be higher (induced) with regular alcohol consumption [Citation23].
PEth values after repeated ethanol dosing
In the Swedish PEth harmonization from 2013 [Citation12], the upper decision limit at 0.30 µmol/L chosen to indicate regular high, harmful drinking was partly based on previous experience with HPLC measurements of total PEth, after correction for the relative proportion of PEth 16:0/18:1 being ∼40% [Citation12], partly on the distribution of PEth 16:0/18:1 values in blood samples from patients and blood donors [Citation17]. In an experimental study over five consecutive days with an individualized ethanol dose estimated to give a BEC of at least 1.0 g/kg (measured 0.99–1.83 g/kg; i.e. ≥ 0.1%), thereby mimicking repeated binge drinking (i.e. consumption of five or more standard drinks on the same occasion, or reaching a BEC ≥ 1 g/kg), PEth values rose gradually, albeit with large inter-individual variation, to reach peak levels of 0.10–0.34 µmol/L [Citation39].
Alcohol dosing studies involving even higher and/or longer exposures cannot be done for ethical reasons, so here reference must be made to patient data, which is often based on self-reported alcohol consumption implying credibility problems. In an outpatient study of heavy drinkers who voluntarily had sought clinical support to reduce their drinking, thereby reducing the reason for under-reporting, the PEth value correlated best with past two-weeks self-reported ethanol intake [Citation40]. Those with a PEth value exceeding the upper decision limit of 0.30 μmol/L stated an average daily ethanol intake of ∼40 g (median ∼35 g), but often much higher, with considerable inter-individual variation between reported alcohol intake and measured PEth value [Citation40].
Half-life of PEth during abstinence from alcohol
Not only the individual dose-response effect but also the elimination half-life of PEth during abstinence after previous high alcohol intake has been shown to vary considerably, both in dosing experiments [Citation24] and during outpatient treatment [Citation10,Citation41,Citation42]. In heavy drinkers who were followed during detoxification in hospital, the half-life of PEth 16:0/18:1 ranged between ∼4–10 (median 6) days [Citation10], meaning that PEth as a long-term biomarker may reflect the alcohol intake over the last weeks to ∼1.5 months (i.e. five half-lives), where the detection time depends both on the starting concentration and the individual elimination rate.
The different PEth forms have slightly different half-lives [Citation10], which may be used for more reliable estimation of the amount and timing of alcohol intake [Citation10,Citation27,Citation36], although this has not come to practical use.
Other factors that affect the PEth value
The PEth formation rate may vary due to individual differences in PLD activity, and in the concentration of phosphatidylcholine 16:0/18:1 which is influenced by the diet [Citation43]. Repeated high alcohol intake has also been reported to change the fatty acid composition of phospholipids in erythrocytes [Citation44], increasing the proportion of phosphatidylcholine 16:0/18:1 and, hence, the amount of PEth 16:0/18:1 that can be formed [Citation9].
Since PEth in a whole blood sample almost completely originates from the erythrocyte cell membranes, the measured value is likely influenced by hematological parameters, and mainly the erythrocyte volume fraction (hematocrit). However, for hematocrit values within the reference interval, the effect on the PEth value is moderate and hardly clinically relevant for routine assessment of test results [Citation9,Citation22,Citation45], taking into account the other factors that also affect the value. However, severe anemia or other hemolytic disease may cause a falsely low PEth value [Citation46,Citation47].
Conclusions
Because PEth can only be formed as long as ethanol is present in the body and it accumulates in blood upon repeated exposure, PEth measurement is useful as a specific alcohol biomarker and can, to some extent, provide quantitative information. The PEth formation shows good correlation with alcohol intake at the population level albeit with large inter-individual variation. Accordingly, the PEth values seen after several days of low-to-moderate alcohol consumption may overlap those after a single high intake. The amount of alcohol consumed and the BEC reached, the exposure time, and biochemical factors such as the PLD activity and phosphatidylcholine 16:0/18:1 concentration, will influence the measured PEth value, while no gender differences have been reported [Citation10,Citation36]. With abstinence from alcohol, the PEth level drops slowly, but also the elimination half-life varies considerably between individuals [Citation10]. For use as a long-term alcohol biomarker, the PEth test reflects high alcohol intake over the past weeks to about one month, depending on the starting level and the individual elimination rate, but single large intakes can also generate measurable but lower levels.
Due to the considerable inter-individual variations in the formation and elimination of PEth, as for most laboratory measures, the test value only provides a rough estimate of the amount, frequency, and timing of drinking. Consequently, the proposed decision limits are not definitive to distinguish between different alcohol consumption levels. Nevertheless, current experience suggests that the originally proposed decision limits [Citation12] are still appropriate to use [Citation48]. Alcohol intake resulting in PEth values below the commonly applied lower reporting limit (i.e. < 0.03–0.05 µmol/L) indicates sobriety or only low or occasional alcohol intake [Citation26] at a level generally considered medically harmless, although no intake is completely safe [Citation49]. To reach PEth values above the upper decision limit of 0.30 µmol/L, regular high alcohol intake [Citation40] at levels equivalent to risky, harmful drinking [Citation49] is required in most cases, but it is not equivalent to a diagnosis of alcohol dependence.
Acknowledgments
Some of these results have been presented in Swedish in the medical journal Läkartidningen. EQA data has been made available by Equalis AB (Uppsala, Sweden).
Disclosure statement
No potential conflict of interest was reported by the authors. Participation in the Equalis advisory group is an unpaid commitment.
References
- Helander A, Beck O, Jones AW. Laboratory testing for recent alcohol consumption: comparison of ethanol, methanol, and 5-hydroxytryptophol. Clin Chem. 1996;42(4):618–624. doi: 10.1093/clinchem/42.4.618.
- Whitfield JB, Hensley WJ, Bryden D, et al. Some laboratory correlates of drinking habits. Ann Clin Biochem. 1978;15(6):297–303. doi: 10.1177/000456327801500171.
- Whitehead TP, Clarke CA, Whitfield AG. Biochemical and haematological markers of alcohol intake. Lancet. 1978;1(8071):978–981. doi: 10.1016/s0140-6736(78)90261-1.
- Helander A, Wielders J, Anton R, et al. Standardisation and use of the alcohol biomarker carbohydrate-deficient transferrin (CDT). Clin Chim Acta. 2016;459:19–24. doi: 10.1016/j.cca.2016.05.016.
- Helander A, Beck O. Ethyl sulfate: a metabolite of ethanol in humans and a potential biomarker of acute alcohol intake. J Anal Toxicol. 2005;29(5):270–274. doi: 10.1093/jat/29.5.270.
- Isaksson A, Walther L, Hansson T, et al. Phosphatidylethanol in blood (B-PEth): a marker for alcohol use and abuse. Drug Test Anal. 2011;3(4):195–200. doi: 10.1002/dta.278.
- Gnann H, Engelmann C, Skopp G, et al. Identification of 48 homologues of phosphatidylethanol in blood by LC-ESI-MS/MS. Anal Bioanal Chem. 2010;396(7):2415–2423. doi: 10.1007/s00216-010-3458-5.
- Helander A, Zheng Y. Molecular species of the alcohol biomarker phosphatidylethanol in human blood measured by LC-MS. Clin Chem. 2009;55(7):1395–1405. doi: 10.1373/clinchem.2008.120923.
- Stenton J, Walther L, Hansson T, et al. Inter individual variation and factors regulating the formation of phosphatidylethanol. Alcohol Clin Exp Res. 2019;43(11):2322–2331. doi: 10.1111/acer.14195.
- Helander A, Böttcher M, Dahmen N, et al. Elimination characteristics of the alcohol biomarker phosphatidylethanol (PEth) in blood during alcohol detoxification. Alcohol Alcohol. 2019;54(3):251–257. doi: 10.1093/alcalc/agz027.
- Hansson P, Caron M, Johnson G, et al. Blood phosphatidylethanol as a marker of alcohol abuse: levels in alcoholic males during withdrawal. Alcohol Clin Exp Res. 1997;21(1):108–110. doi: 10.1097/00000374-199702000-00015.
- Helander A, Hansson T. [National harmonization of the alcohol biomarker PEth]. Läkartidningen. 2013;110:1747–1748.
- Varga A, Hansson P, Johnson G, et al. Normalization rate and cellular localization of phosphatidylethanol in whole blood from chronic alcoholics. Clin Chim Acta. 2000;299(1-2):141–150. doi: 10.1016/s0009-8981(00)00291-6.
- Isaksson A, Walther L, Alling C, et al. [Phosphatidylethanol in blood (B-PEth) - a new marker of alcohol abuse]. Läkartidningen. 2009;106:1094–1098.
- Isaksson A, Walther L, Hansson T, et al. High-throughput LC-MS/MS method for determination of the alcohol use biomarker phosphatidylethanol in clinical samples by use of a simple automated extraction procedure - preanalytical and analytical conditions. J Appl Lab Med. 2018;2(6):880–892. doi: 10.1373/jalm.2017.024828.
- Berg T, Eliassen E, Jørgenrud B, et al. Determination of phosphatidylethanol 16:0/18:1 in whole blood by 96-well supported liquid extraction and UHPLC-MS/MS. J Clin Lab Anal. 2019;33(1):e22631. doi: 10.1002/jcla.22631.
- Zheng Y, Beck O, Helander A. Method development for routine liquid chromatography-mass spectrometry measurement of the alcohol biomarker phosphatidylethanol (PEth) in blood. Clin Chim Acta. 2011;412(15-16):1428–1435. doi: 10.1016/j.cca.2011.04.022.
- Skråstad RB, Spigset O, Aamo TO, et al. Stability of phosphatidylethanol 16:0/18:1 in freshly drawn, authentic samples from healthy volunteers. J Anal Toxicol. 2021;45(4):417–421. doi: 10.1093/jat/bkaa082.
- Lakso H, Wuolikainen A, Sundkvist A, et al. Long-term stability of the alcohol consumption biomarker phosphatidylethanol in erythrocytes at -80 °C. Clin Mass Spectrom. 2019;11:37–41. doi: 10.1016/j.clinms.2018.12.002.
- Dumitrascu C, van de Lavoir MCA, Neels H, et al. Stability of phosphatidylethanol 16:0/18:1 in authentic and spiked whole blood. Drug Test Anal. 2021;13(6):1219–1222. doi: 10.1002/dta.2995.
- Beck O, Mellring M, Löwbeer C, et al. Measurement of the alcohol biomarker phosphatidylethanol (PEth) in dried blood spots and venous blood-importance of inhibition of post-sampling formation from ethanol. Anal Bioanal Chem. 2021;413(22):5601–5606. doi: 10.1007/s00216-021-03211-z.
- Beck O, Kenan Moden N, Seferaj S, et al. Study of measurement of the alcohol biomarker phosphatidylethanol (PEth) in dried blood spot (DBS) samples and application of a volumetric DBS device. Clin Chim Acta. 2018;479:38–42. doi: 10.1016/j.cca.2018.01.008.
- Kummer N, Ingels AS, Wille SM, et al. Quantification of phosphatidylethanol 16:0/18:1, 18:1/18:1, and 16:0/16:0 in venous blood and venous and capillary dried blood spots from patients in alcohol withdrawal and control volunteers. Anal Bioanal Chem. 2016;408(3):825–838. doi: 10.1007/s00216-015-9169-1.
- Javors MA, Hill-Kapturczak N, Roache JD, et al. Characterization of the pharmacokinetics of phosphatidylethanol 16:0/18:1 and 16:0/18:2 in human whole blood after alcohol consumption in a clinical laboratory study. Alcohol Clin Exp Res. 2016;40(6):1228–1234. doi: 10.1111/acer.13062.
- Neumann J, Beck O, Helander A, et al. Performance of PEth compared with other alcohol biomarkers in subjects pfesenting for occupational and pre-employment medical examination. Alcohol Alcohol. 2020;55(4):401–408. doi: 10.1093/alcalc/agaa027.
- Skråstad RB, Aamo TO, Andreassen TN, et al. Quantifying alcohol consumption in the general population by analysing phosphatidylethanol concentrations in whole blood: results from 24,574 subjects included in the HUNT4 study. Alcohol Alcohol. 2023;58(3):258–265. doi: 10.1093/alcalc/agad015.
- Herzog J, Skopp G, Musshoff F, et al. Formation of phosphatidylethanol and ethylglucuronide after low to moderate alcohol consumption in volunteers with a previous three-week alcohol abstinence. Alcohol Alcohol. 2023. doi: 10.1093/alcalc/agad025.
- Aboutara N, Jungen H, Szewczyk A, et al. PEth 16:0/18:1 and 16:0/18:2 after consumption of low doses of alcohol - a contribution to cutoff discussion. Drug Test Anal. 2023;15(1):104–114. doi: 10.1002/dta.3376.
- Hasken JM, Marais AS, de Vries MM, et al. Assessing the sensitivity and specificity of phosphatidylethanol (PEth) cutoffs to identify alcohol exposed pregnancies. Curr Res Toxicol. 2023;4:100105. doi: 10.1016/j.crtox.2023.100105.
- Erim Y, Böttcher M, Dahmen U, et al. Urinary ethyl glucuronide testing detects alcohol consumption in alcoholic liver disease patients awaiting liver transplantation. Liver Transpl. 2007;13(5):757–761. doi: 10.1002/lt.21163.
- Faulkner CS, White CM, Manatsathit W, et al. Positive blood phosphatidylethanol concentration is associated with unfavorable waitlist-related outcomes for patients medically appropriate for liver transplantation. Alcohol Clin Exp Res. 2022;46(4):581–588. doi: 10.1111/acer.14786.
- Helander A. [Biomarkers can detect early-stage alcohol problems]. Läkartidningen. 2011;108:2291–2295.
- Reisfield GM, Teitelbaum SA, Jones JT, et al. Blood phosphatidylethanol (PEth) concentrations following intensive use of an alcohol-based hand sanitizer. J Anal Toxicol. 2023;46(9):979–990. doi: 10.1093/jat/bkab115.
- Reisfield GM, Teitelbaum SA, Jones JT, et al. Blood phosphatidylethanol concentrations following regular exposure to an alcohol-based mouthwash. J Anal Toxicol. 2021;45(9):950–956. doi: 10.1093/jat/bkaa147.
- Thurfjell Å, Sandlund C, Adami J, et al. General practitioners’ experiences of phosphatidylethanol in treatment of hypertension: a qualitative study. BJGP Open. 2023:BJGPO.2023.0037. doi: 10.3399/BJGPO.2023.0037.
- Hill-Kapturczak N, Dougherty DM, Roache JD, et al. Differences in the synthesis and elimination of phosphatidylethanol 16:0/18:1 and 16:0/18:2 after acute doses of alcohol. Alcohol Clin Exp Res. 2018;42(5):851–860. doi: 10.1111/acer.13620.
- Schröck A, Thierauf-Emberger A, Schürch S, et al. Phosphatidylethanol (PEth) detected in blood for 3 to 12 days after single consumption of alcohol-a drinking study with 16 volunteers. Int J Legal Med. 2017;131(1):153–160. doi: 10.1007/s00414-016-1445-x.
- Stöth F, Kotzerke E, Thierauf-Emberger A, et al. Can PEth be detected with a cutoff of 20 ng/mL after single alcohol consumption? J Anal Toxicol. 2023;46(9):e232–e238. doi: 10.1093/jat/bkac069.
- Gnann H, Weinmann W, Thierauf A. Formation of phosphatidylethanol and its subsequent elimination during an extensive drinking experiment over 5 days. Alcohol Clin Exp Res. 2012;36(9):1507–1511. doi: 10.1111/j.1530-0277.2012.01768.x.
- Helander A, Hermansson U, Beck O. Dose-response characteristics of the alcohol biomarker phosphatidylethanol (PEth)-a study of outpatients in treatment for reduced drinking. Alcohol Alcohol. 2019;54(6):567–573. doi: 10.1093/alcalc/agz064.
- Stöth F, Weinmann W, Soravia LM, et al. Evaluation of phosphatidylethanol elimination in alcohol use disorder patients undergoing withdrawal treatment. Alcohol Alcohol. 2023;58(3):266–273. doi: 10.1093/alcalc/agad010.
- Helander A, Peter O, Zheng Y. Monitoring of the alcohol biomarkers PEth, CDT and EtG/EtS in an outpatient treatment setting. Alcohol Alcohol. 2012;47(5):552–557. doi: 10.1093/alcalc/ags065.
- Hodson L, Skeaff CM, Fielding BA. Fatty acid composition of adipose tissue and blood in humans and its use as a biomarker of dietary intake. Prog Lipid Res. 2008;47(5):348–380. doi: 10.1016/j.plipres.2008.03.003.
- Alling C, Gustavsson L, Kristensson-Aas A, et al. Changes in fatty acid composition of major glycerophospholipids in erythrocyte membranes from chronic alcoholics during withdrawal. Scand J Clin Lab Invest. 1984;44(4):283–289. doi: 10.3109/00365518409083809.
- Aboutara N, Jungen H, Szewczyk A, et al. Analysis of six different homologues of phosphatidylethanol from dried blood spots using liquid chromatography-tandem mass spectrometry. Drug Test Anal. 2021;13(1):140–147. doi: 10.1002/dta.2910.
- Hahn JA, Murnane PM, Vittinghoff E, et al. Factors associated with phosphatidylethanol (PEth) sensitivity for detecting unhealthy alcohol use: an individual patient data meta-analysis. Alcohol Clin Exp Res. 2021;45(6):1166–1187. doi: 10.1111/acer.14611.
- Årving A, Hilberg T, Sovershaev M, et al. Falsely low phosphatidylethanol may be associated with biomarkers of haemolytic disease. Basic Clin Pharmacol Toxicol. 2023;132(2):223–230. doi: 10.1111/bcpt.13814.
- Ulwelling W, Smith K. The PEth blood test in the security environment: what it is; why it is important; and interpretative guidelines. J Forensic Sci. 2018;63(6):1634–1640. doi: 10.1111/1556-4029.13874.
- GBD 2016 Alcohol Collaborators. Alcohol use and burden for 195 countries and territories, 1990–2016: a systematic analysis for the global burden of disease study 2016. Lancet. 2018;392(10152):1015–1035. doi: 10.1016/S0140-6736(18)31310-2.