
 ?Mathematical formulae have been encoded as MathML and are displayed in this HTML version using MathJax in order to improve their display. Uncheck the box to turn MathJax off. This feature requires Javascript. Click on a formula to zoom.
Abstract
Introduction
There are important pharmacological differences between direct oral anticoagulants (DOAC) and a deeper knowledge of how they influence different aspects of hemostasis in patients on treatment is desirable.
Materials and methods
Blood samples from patients on dabigatran (n = 23), rivaroxaban (n = 26), or apixaban (n = 20) were analyzed with a fibrin network permeability assay, a turbidimetric clotting and lysis assay, the calibrated automated thrombogram (CAT), plasma levels of thrombin-antithrombin complex (TAT) and D-dimer, as well as DOAC concentrations, PT-INR and aPTT. As a comparison, we also analyzed samples from 27 patients on treatment with warfarin.
Results
Patients on dabigatran had a more permeable fibrin network, longer lag time (CAT and turbidimetric assay), and lower levels of D-dimer in plasma, compared with patients on rivaroxaban- and apixaban treatment, and a more permeable fibrin network than patients on warfarin. Clot lysis time was slightly longer in patients on dabigatran than in patients on rivaroxaban. Warfarin patients formed a more permeable fibrin network than patients on apixaban, had longer lag time than patients on rivaroxaban (CAT assay), and lower peak thrombin and ETP compared to patients on treatment with both FXa-inhibitors.
Conclusions
Results from this study indicate dabigatran treatment is a more potent anticoagulant than apixaban and rivaroxaban. However, as these results are not supported by clinical data, they are probably more related to the assays used and highlight the difficulty of measuring and comparing the effect of anticoagulants.
Introduction
Atrial fibrillation (AF) is a pro-thrombotic condition associated with an increased risk of stroke and systemic embolism which is reduced by treatment with oral anticoagulants (OAC) [Citation1]. For a long time, the only available OACs were vitamin K antagonists (VKA), such as warfarin. VKAs inhibit the enzyme vitamin K epoxide reductase, resulting in reduced synthesis of vitamin K dependent coagulation factors pro-thrombin, factor VII, factor IX, and factor X as well as anticoagulant protein C, protein S and protein Z [Citation2]. During the last decades, the direct oral anticoagulants (DOAC)—direct inhibitors of thrombin (dabigatran) or factor Xa (rivaroxaban, apixaban, and edoxaban)—have been introduced in the clinic and are now preferred over warfarin in most patients with AF [Citation3–9]. The anticoagulant effect of the DOACs is more predictable and, as opposed to warfarin, there is no need for routine monitoring of DOAC treatment [Citation10–13]. Compared to warfarin, DOACs offer equal or better protection against ischemic stroke and less intracranial bleedings (ICH) in patients with AF [Citation3–6]. Guidelines generally do not recommend any DOAC over the other as there are no direct comparisons between them, but in comparison with warfarin there were some differences between the various DOACs: for example, apixaban was the only DOAC without an increased risk of gastrointestinal bleeding compared to warfarin, and dabigatran was the only DOAC with less risk of ischemic stroke compared to warfarin [Citation10–14]. Considering the important pharmacodynamic and pharmacokinetic differences between the DOACs, it is not without risk to treat them as a homogenous group. With further knowledge of the potential differences between the DOACs, there may be opportunities to tailor anticoagulant treatment for patient groups with different clinical characteristics [Citation15–18].
Regulation of hemostasis depends on complicated interactions between the coagulation system, the fibrinolytic system, platelets, and the vascular endothelium. Our knowledge of these processes is continually evolving but is still incomplete. The final steps of the coagulation cascade include the conversion of pro-thrombin to thrombin by activated FX and the conversion of fibrinogen to fibrin by thrombin. Fibrin polymerizes and forms the fibrin network which together with platelets and blood cells form clots. Simultaneously, the fibrinolytic system acts to degrade the newly formed fibrin network. Many of the enzymes involved in hemostasis participate in multiple positive and negative feed-back loops [Citation19]. Thrombin is a central protease that converts fibrinogen to fibrin and potently activates platelets. At the same time, it acts as an anticoagulant by activating Protein C, attenuates fibrinolysis through activation of thrombin activatable fibrinolysis inhibitor (TAFI), and regulates inflammation and angiogenesis through modulation of immune cell activity [Citation20,Citation21].
Laboratory evaluation of fibrin network permeability, thrombin generation, and fibrinolysis are possible, and the results have been linked to clinical end-points. Fibrin network permeability can be measured using variations of a technique originally described by Blombäck and Okada already in 1982 [Citation22,Citation23]. Further clinical studies have described decreased fibrin network permeability in patients with ischemic stroke, VTE, and ACS [Citation24–29] and increased permeability with anticoagulant treatment [Citation30–35]. Thrombin generation can be studied ex vivo using the calibrated automated thrombogram (CAT), developed by Hemker et al. [Citation36]. CAT results have been linked to various thrombotic disorders, including acute coronary syndrome (ACS), ischemic stroke, and venous thromboembolism (VTE) [Citation37–39]. Fibrinolysis can be measured using the turbidimetric clotting and lysis assay, results of which have been linked to VTE, ischemic stroke, adverse outcome after ACS, and anticoagulant treatment [Citation24,Citation40–43]. Thrombin-antithrombin (TAT) complexes and D-dimer levels in plasma can be measured as general markers of an activated coagulation system in vivo [Citation44–46].
The aim of this study was to further characterize the anticoagulant effects of DOAC treatment and compare it to warfarin treatment. We analyzed the drug effects with both global and specific assays that reflect different parts of hemostasis: a fibrin network permeability assay, the CAT assay, a turbidimetric clotting and lysis assay, and measurements of plasma levels of the coagulation markers TAT and D-dimer.
Materials and methods
Patients and samples
Altogether ninety-six patients were recruited from three coagulation centres in the region of Stockholm (Danderyd Hospital, Karolinska University Hospital, and Stockholm Heart Centre) between 2013 and 2014. All patients received anticoagulant treatment according to clinical routine care. DOAC treatment included dabigatran (n = 23), rivaroxaban (n = 26), and apixaban (n = 20). The doses for each drug were chosen in line with the summary product characteristics (SPC) for DOACs, and all study patients reported full compliance during the last three days before trough plasma samples were collected. Patients on PT-INR guided warfarin therapy (n = 27) were included for comparison (VTE patients were included at least one month after any thrombotic event).
Blood samples were drawn by direct venipuncture from an antecubital vein, collected into standard vacuum tubes containing a 1/10th volume of trisodium citrate [Becton Dickenson USA, 0.109 mol/L in 4.5 mL blood (3.2%)] and immediately centrifuged at 2000 × g for 20 min at room temperature. Plasma was then frozen at −70 °C in aliquots of 0.5 mL until further analyses.
The study was performed in accordance with the Declaration of Helsinki and was approved by the Ethical Review Board in Stockholm, Sweden (reference numbers 2010/28-31/4 and 2012/1232-31/4). Oral and written informed consent was obtained from the participants.
Fibrin network permeability
Fibrin network permeability was determined according to the approach originally described by Blombäck et al. [Citation22] and later modified by Shu He in our group [Citation30,Citation47]. Tris-NaCl buffer was prepared by dissolving 50 mM Trizma base (Sigma-Aldrich, St. Louis, MO, USA) and 0.1 M NaCl in 1 L of distilled water and adjusted to pH 7.4 with HCl. Fibrin clots for one test tube were prepared by mixing 200 µL plasma with a solution (40 µL) containing recombinant human tissue factor (TF; Innovin®, final concentration 5 pM), phospholipids (Rossix; final concentration 4 µM) and CaCl2 (final concentration 20 mM). Then, 200 µL of the mixture were immediately added to a plastic cylinder prepared from a Combitips Plus tip (0.5 mL Eppendorf, Hamburg, Germany) which had been coated with purified fibrinogen (Enzyme Research Labs) of 3 mg/mL (to avoid separation of the fibrin clot from the cylinder inner wall). The fibrin gel was allowed to stabilize overnight in a moisture chamber at room temperature. The stabilized fibrin network was percolated with Tris-NaCl buffer for 40 min to fully wash soluble impurities away. The same percolation procedure was then repeated once more for 60 min and the volume of the eluted buffer was measured. The permeability coefficient was calculated by using the following formula:
where Q (cm3) is the flow rate at time t (s), L (cm) is the length of the fibrin gel, η (dyne × s/cm2) is the viscosity of the liquid, A (cm2) is the cross-sectional area and ΔP (dyne/cm2) is the differential pressure. In each run of fibrin network permeability, one fibrin clot from the normal pool plasma [NPP; CryoCheck (Darthmouth, NS, Canada)] sample was examined in parallel. The obtained Ks value of NPP was used as a control level, set at 100%. Fibrin network permeability measured in patient samples was normalized against the control level and reported as ‘% of control’.
Fibrin clots that had been fully washed (after Ks measurement) were visualized with scanning electron microscopy as earlier reported [Citation48]. Fixation was performed with 2.5% glutaraldehyde in phosphate-buffered saline solution (PBS, pH 7.4) for 12 h. The clots were gently washed with distilled water, and then dehydrated in graded water-ethanol solutions, dried by the critical point procedure, and sputter-coated with gold. The samples were then scanned with a scanning electronic microscope (HITACHI S-4700).
In vitro experiments
In vitro experiments of fibrin network permeability were performed in which dabigatran, apixaban, and rivaroxaban were added in different concentrations to NPP. Plasma from warfarin-treated individuals with different PT-INR (seven samples with PT-INR ranging from 1 to 9) was purchased from George King Bio-medical Inc. (Overland Park, KS, USA). Apixaban was provided by AstraZeneca (Mölndal, Sweden) and was reconstituted with 10% hydroxypropyl cyclodextrin and further diluted with tris buffer. Dabigatran was provided by Boehringer Ingelheim (Ingelheim am Rein, Germany) and was diluted with Tris buffer. Rivaroxaban was supplied by Bayer Healthcare AG (Wuppertal, Germany) and was reconstituted with DMSO and further diluted with Tris buffer. Five microlitres of inhibitor solution was added to 200 µL of NPP for concentrations of inhibitors ranging between 13 and 1000 ng/mL.
CAT
A coagulation trigger solution was prepared by adding TF (Innovin®) and PPL (Rossix®) to tris buffer, giving the concentrations 30 pmol/L and 24 µmol/L, respectively. In a well of the microplate, 20 µL of the above trigger solution was mixed with 80 µL of the plasma sample, to which 20 µL of FluCa (a commercial reagent containing CaCl2 and the fluorogenic substrate) was then added to start the reaction, giving final concentrations 5 pmol/L of TF, 4 µmol/L of PPL and 20 mmol/L of CaCl2. The fluorescence in the plasma was read every 30 s for 60 min using a Fluoroscan Ascent fluorometer (Fluoroscan Ascent, Thermo Scientific, Vanta, Finland). A curve of the total amount of thrombin generated over time was obtained. Lag phase is the time-to-start of detectable thrombin. Thrombin peak and thrombin peak time is the maximum concentration of thrombin formed and the time taken to reach thrombin peak, respectively. The area under the curve represents the global endogenous thrombin potential (ETP) during the whole registration time.
Thrombin-antithrombin complex (TAT)
An enzyme immunoassay was used to determine TAT complex concentrations in plasma (Enzygnost TAT Micro; Behringwerke AG, Marburg, Germany).
D-dimer
D-dimer concentrations were measured by a rapid particle-enhanced immunoturbidimetric assay, Siemens INNOVANCE® D-dimer on the instrument Sysmex CS5100.
Turbidimetric assays
Turbidimetric clotting and lysis assays were performed according to the method previously described by Carter et al. [Citation43]. From each sample, a clotting and a lysis assay was performed. NPP was analyzed for reference in five repeated runs but samples from warfarin treated patients were not analyzed with this method as they were not available at the time of analysis. Both were performed in transparent flat bottom 96-well plates (Sigma-Aldrich, St. Louis, MO, USA), and optical density as a measure of clotting of the sample was read by a Tecan Sunrise (Männedorf, Switzerland) absorbance microplate reader every 12 s for 1 h. Briefly, 25 µL of plasma was diluted with 75 µL of tris buffer and clotting was initiated by adding 50 µL of an activation mix containing, for the clotting assay, thrombin (final concentration 0.03 IU/mL) and CaCl2 (final concentration 7.5 mmol/L). For the lysis assay, the same activation mix was used but with the addition of tPA (final concentration 83 ng/mL). The variables recorded were lag time (time until clotting initiation in clotting assay; when there is an exponential increase in optical density), max absorbance (maximum clotting of clotting assay; difference in optical density between time of clotting initiation and maximum absorbance), CFR (clot formation rate of clotting assay; maximum absorbance divided by time between start of clotting initiation and maximum absorbance) and clot lysis time (time between maximum absorbance of lysis assay and 50% lysis).
Immunologic determination of fibrinogen concentration
Fibrinogen was quantified immunologically using reagents from Siemens Healthcare Diagnostics (Deerfield, IL, USA). Nephelometric measurement was performed on a BN ProSpec (Siemens Healthcare Diagnostics, Deerfield, IL, USA). The locally established reference interval used is 2.0–4.2 g/L.
Direct measurement of DOAC in plasma by LC-MS/MS
Plasma concentrations of apixaban, rivaroxaban, and dabigatran were determined using liquid chromatography-tandem mass spectrometry (LC-MS/MS) as previously described in detail elsewhere [Citation49–51].
aPTT using the Automate® reagent (DiagnosticaStagoAsnieres, France) was performed on a Sysmex® CS2100i (Sysmex, Kobe, Japan). Results are given in seconds with a normal range of ≤40 s.
PT-INR using the Owren reagent SPA+® (DiagnosticaStagoAsnieres, France) was performed on a Sysmex® CS2100i (Sysmex, Kobe, Japan). Results are presented as INR with a normal range <1.2.
Statistical methods
Normality distribution was tested using the D’Agostine–Pearson test. Pearson’s or Spearman’s correlation coefficients were used for the estimation of simple correlations between variables depending on normality distribution.
Differences across groups were evaluated with one-way ANOVA followed by Tukey’s multiple comparisons (if ANOVA significant) or Kruskal-Wallis followed by Dunn’s multiple comparisons (if Kruskal–Wallis significant) depending on normality distribution. For comparison of the distribution of nominal variables, Fisher’s exact test was used. Statistical analyses and figures were made using GraphPad Prism version 7 (GraphPad Software, Inc., USA), and IBM SPSS version 22 (IBM Inc., USA). A p-value <0.05 was considered statistically significant for all tests.
Results
In total, 96 patients were included in the study, and their clinical characteristics are presented in . The DOAC treatment groups consisted of AF patients only, whereas the warfarin treatment group consisted of patients with AF (n = 1), prior arterial embolism (n = 1), prior VTE (n = 23) and mechanical heart valves (n = 2) as an indication for treatment. One of the VTE patients also had antiphospholipid syndrome. Patients in the warfarin treatment group were younger than patients in each of the DOAC treatment groups (p < 0.01), whereas there were no significant differences in age between the DOAC treatment groups. More DOAC-treated patients had a history of previous stroke/transitory ischemic attack (p < 0.05), whereas more warfarin-treated patients had a history of previous VTE (p < 0.01). Warfarin-treated patients had a slightly higher platelet count than rivaroxaban-treated patients (p < 0.05) and higher eGFR than apixaban-treated patients (p < 0.01). There were no other significant differences between the treatment groups regarding the other parameters listed in . Two of the rivaroxaban-treated patients and one of the warfarin-treated patients were concomitantly treated with a platelet inhibitor (aspirin).
Table 1. Clinical characteristics of patients.
Fibrin network permeability—patient samples
The fibrin network permeability was compared between treatment groups (, ). Dabigatran-treated patients formed more permeable fibrin gels (i.e. highest values of the permeability coefficient Ks) than each of the other treatment groups (p < 0.01). Warfarin-treated patients had higher Ks than apixaban (p < 0.01) but not compared to rivaroxaban-treated patients, and there were no significant differences in Ks between patients on apixaban and rivaroxaban.
Figure 1. Fibrin network permeability (Ks—see method section—clotting triggered with TF) in samples from patients treated with dabigatran (n = 23), rivaroxaban (n = 26), apixaban (n = 20), and warfarin (n = 27)—results presented as Ks % of normal Pool plasma (NPP). All treatment groups had higher permeability than commercial NPP (p < 0.01). Differences between groups evaluated with Kruskal Wallis test followed by Dunn’s post-hoc testing if significant. p-Values represent the significance level of post-hoc testing.
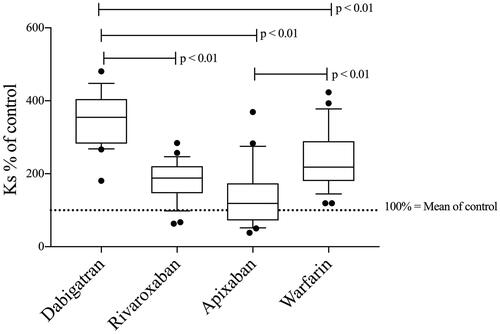
Table 2. Results from tests of hemostasis.
There was no significant correlation between DOAC concentration and Ks in patient samples (Supplementary Table) but there was a significant correlation between PT-INR and Ks in samples from patients on warfarin treatment (r = 0.40; n = 27; p < 0.05).
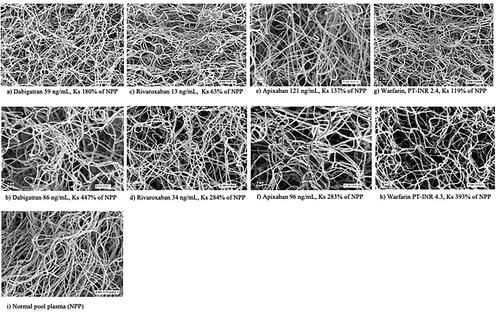
Images of the structure of the fibrin network in samples from OAC-treated patients using scanning electronic microscopy are shown in .
Figure 2. Scanning electronic microscope images showing the fibrin network structure in selected dabigatran- (a,b), apixaban- (c,d), rivaroxaban- (e,f), and warfarin-treated (g,h) patients with different fibrin network permeability (Ks) as well as NPP for comparison (i). The respective DOAC concentration or PT-INR is provided below each image.
Fibrin network permeability—in vitro experiments
In vitro experiments (; Supplementary Table) revealed strong correlations between DOAC concentrations and Ks (r = 0.97; n = 8; p < 0.001 for dabigatran- and apixaban-treated samples, respectively and r = 0.93; n = 8; p < 0.001 for rivaroxaban treated samples). In the plasma pool from warfarin-treated patients, the correlation between PT-INR and Ks was r = 0.96 (n = 7; p < 0.001). With only one analysis per drug concentration, the experiments don’t allow for a statistical comparison of the relative effects of each DOAC on fibrin network permeability, but dose-response curves demonstrate a stronger relative effect of dabigatran than apixaban and rivaroxaban (). That is, at similar drug-concentrations dabigatran-treated samples had more porous fibrin networks. The exposure intervals at trough measured in the pivotal studies for each DOAC are provided in the legend for comparison.
Figure 3. Fibrin network permeability in commercial NPP spiked with eight different concentrations of DOAC (13–1000 ng/mL) and in PPP from warfarin-treated patients with PT-INR values ranging from 1 to 9 (n = 7; each sample concentration analyzed once). Results presented as Ks % of NPP. Expected range of concentration [10th–90th percentile (median)] at the trough for each DOAC: Dabigatran (150 mg × 2) 40–215 (93), apixaban (5 mg × 2) 41–230 (103), rivaroxaban (20 mg × 1) 6–239 (32) [Citation10–12].
![Figure 3. Fibrin network permeability in commercial NPP spiked with eight different concentrations of DOAC (13–1000 ng/mL) and in PPP from warfarin-treated patients with PT-INR values ranging from 1 to 9 (n = 7; each sample concentration analyzed once). Results presented as Ks % of NPP. Expected range of concentration [10th–90th percentile (median)] at the trough for each DOAC: Dabigatran (150 mg × 2) 40–215 (93), apixaban (5 mg × 2) 41–230 (103), rivaroxaban (20 mg × 1) 6–239 (32) [Citation10–12].](/cms/asset/f4e59059-5cb3-4a1f-9b04-69e4f3b654f7/iclb_a_2369993_f0003_b.jpg)
Thrombin generation (CAT)—patient samples
CAT variables were compared between treatment groups (; ). Lag time was significantly longer in patients taking dabigatran compared to apixaban- and rivaroxaban-treated patients (p < 0.01). Patients on warfarin had significantly longer lag time than rivaroxaban-treated patients (p < 0.05). There were no significant differences between patients taking apixaban and rivaroxaban.
Figure 4. CAT (see method section—thrombin generation after clotting triggered with TF) lag time (A), ETP (B), and peak thrombin (C) in samples from patients treated with dabigatran (n = 23), rivaroxaban (n = 26), apixaban (n = 20), and warfarin (n = 26). Peak thrombin and ETP data were not analyzed in dabigatran-treated patients due to the interaction between dabigatran and α2-macroglobulin-thrombin complex in the calibration sample as previously described [Citation48–52]. Differences between groups evaluated with Kruskal Wallis test followed by Dunn’s post-hoc testing if significant. p-Values represent the significance level of post-hoc testing.
![Figure 4. CAT (see method section—thrombin generation after clotting triggered with TF) lag time (A), ETP (B), and peak thrombin (C) in samples from patients treated with dabigatran (n = 23), rivaroxaban (n = 26), apixaban (n = 20), and warfarin (n = 26). Peak thrombin and ETP data were not analyzed in dabigatran-treated patients due to the interaction between dabigatran and α2-macroglobulin-thrombin complex in the calibration sample as previously described [Citation48–52]. Differences between groups evaluated with Kruskal Wallis test followed by Dunn’s post-hoc testing if significant. p-Values represent the significance level of post-hoc testing.](/cms/asset/e20c8108-a576-4184-8553-f04098eb9c5e/iclb_a_2369993_f0004_b.jpg)
Peak thrombin and ETP were lower in warfarin-treated patients than in rivaroxaban- and apixaban-treated patients (p < 0.001), whereas there were no significant differences between patients on rivaroxaban and apixaban. Peak thrombin and ETP data were not analyzed in dabigatran-treated patients due to interaction between dabigatran and α2-macroglobulin-thrombin complex in the calibration sample as previously described [Citation52–56].
The correlations between DOAC concentrations (LC-MS/MS assay), or PT-INR for warfarin, and CAT variables are presented in Supplementary Table. There were statistically significant correlations between DOAC concentrations and lag time for dabigatran- (r = 0.55; n = 23; p < 0.01) and apixaban-treated patients (r = 0.55; n = 20; p < 0.01) and between PT-INR and lag time for warfarin-treated patients (r = 0.77; n = 27; p < 0.001). There were statistically significant inverse correlations between drug concentrations and peak thrombin for patients on rivaroxaban (r = −0.60; n = 26; p < 0.01) and apixaban (r = −0.61; n = 20; p < 0.01), and between PT-INR and peak thrombin for patients on warfarin (−0.92; n = 27; p < 0.001). Further, there was a statistically significant inverse correlation between the drug concentration and ETP in rivaroxaban-treated patients (r = −0.43; n = 26; p < 0.05) and an inverse correlation between PT-INR and ETP in warfarin-treated patients (r = −0.86; n = 27; p < 0.001).
Turbidimetric clotting and lysis assay—patient samples
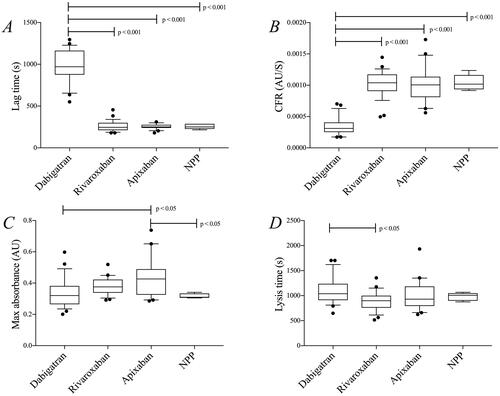
Variables from the turbidimetric assays were compared between treatment groups (; ). Patients on dabigatran had a longer lag time and a lower clot formation rate than the other treatment groups, and also compared to NPP (p < 0.001), and a longer lysis time compared to patients on rivaroxaban (p < 0.05). Max absorbance was higher in apixaban-treated patients compared to dabigatran-treated patients and compared to NPP (p < 0.05 for both). An inverse correlation was found between dabigatran concentration and CFR (−0.42; n = 23; p < 0.05); other than that, we found no correlations between DOAC concentrations and variables from the turbidimetric assays (Supplementary Table).
Figure 5. Results from the turbidimetric clotting and lysis assay (see method section—clotting triggered with thrombin) in samples from patients treated with dabigatran (n = 23), rivaroxaban (n = 26), and apixaban (n = 20). Commercial NPP was used for comparison (five repeated runs). (A) lag time, (B) CFR, (C) max absorbance, and (D) lysis time. Differences between groups were evaluated with one-way ANOVA followed by Tukey’s post-hoc testing if significant. p-Values represent the significance level of post-hoc testing.
Thrombin-antithrombin complex (TAT)—patient samples
There were no significant differences in TAT levels between treatment groups () and no significant correlations between DOAC concentrations or PT-INR and TAT levels (Supplementary Table).
D-dimer—patient samples
D-dimer concentrations were lower in dabigatran-treated patients than in rivaroxaban- (p < 0.05) and apixaban- (p < 0.01) treated patients, respectively (). There were no significant correlations between any DOAC concentration and D-dimer levels (Supplementary Table). Due to a lack of plasma, warfarin samples were not analyzed for D-dimer.
Fibrinogen—patient samples
The fibrinogen concentration was significantly lower in the dabigatran treatment group compared to the apixaban-treated group (; p < 0.01). No other significant differences were detected between the groups and there was no significant correlation between DOAC concentration or PT-INR and fibrinogen concentration (Supplementary Table). Further, no significant correlation between the fibrinogen concentration and the fibrin network permeability was found.
Routine variables; PT INR and aPTT—patient samples
As anticipated, aPTT was more prolonged during treatment with dabigatran than during treatment with either of the two FXa inhibitors (). The PT-INR levels did not differ significantly between the three DOACs. Patients on warfarin had elevated PT INR and aPTT levels as expected ().
Discussion
The stronger effect on fibrin network permeability by dabigatran compared to the FXa-inhibitors could be explained by both direct and indirect inhibition of thrombin. Dabigatran may directly inhibit thrombin bound to the fibrin clot [Citation57] but could also attenuate cross-linking of fibrin fibers in the network through inhibition of thrombin-induced activation of Factor XIII, thus making the fibrin network less dense [Citation58]. Of note, the results on fibrin network permeability in the patient samples were supported by in vitro experiments where the effect comparative to a therapeutic PT-interval comes below the expected trough concentration range and the relative effect of dabigatran seems to be stronger at any given concentration compared to apixaban and rivaroxaban. This is especially interesting as proposed cut-offs for performing surgery or administering thrombolysis do not differ between DOACs [Citation59–61]. Of note, there was a lack of correlation between DOAC concentration and Ks in the patient samples but not in the in vitro experiments. A likely explanation is that the patient samples were collected at trough and therefore the range of DOAC concentrations was too low to detect concentration-dependent relationships. Supporting this notion are previous studies on samples with a wider range of DOAC concentrations where dose-dependent effects of DOACs on the fibrin network permeability were reported [Citation32,Citation34,Citation35,Citation62]. The effects of the FXa-inhibitors were less pronounced in virtually all analyses performed. In the CAT assay, there was a shorter time for thrombin formation as compared to patients on dabigatran and warfarin, and the total amount of thrombin generated was higher than in patients on warfarin (). Our data agree with previous studies which have shown a more pronounced effect of dabigatran than FXa-inhibitors on the time to initiation of thrombin formation (i.e. CAT lag time) [Citation63,Citation64]. It should be noted that the CAT data obtained in our study lacks information on peak thrombin and ETP for dabigatran-treated patients due to interference with calibration [Citation52–56]. This limitation can now be overcome by different methods and comparisons between FXa-inhibitors and dabigatran have shown that FXa-inhibitors have a stronger effect on peak thrombin while dabigatran has a stronger effect on lag time [Citation65–69]. The reason for the discrepancy between these two drug types with respect to the outcome of CAT data is not entirely clear, but it reflects that direct thrombin inhibitors and FXa-inhibitors influence the activation of the coagulation cascade differently.
The turbidimetric assay, which measures fibrin formation and fibrin degradation, could not detect any significant effects in samples from patients on FXa-inhibitors, whereas in samples from dabigatran-treated patients, the time to clot formation was prolonged and the clot formation rate was reduced. These findings may at least in part be due to the use of thrombin as a trigger in the turbidimetric assay, which of course should lead to a higher sensitivity to the direct thrombin inhibitor dabigatran. However, others have reported more pronounced effects of dabigatran compared to FXa inhibitors even when using a TF-based trigger in a turbidimetric clotting assay [Citation70]. Similar to the results in our study, DOACs had limited effects on max absorbance (reflects the total amount of fibrin formed) [Citation70].
The data on clot lysis time, which is considered to reflect fibrinolysis, was not that impressive in our study. There was a small but statistically significant difference between dabigatran and rivaroxaban, with a slightly longer clot lysis time in samples from the dabigatran patients. This is contrary to what you might expect, considering more permeable fibrin networks should be more accessible for fibrinolysis [Citation71]. Indeed, previous reports from Ammollo et al. and Semeraro et al. showed a dose-dependent shortening of lysis time with dabigatran, but not with apixaban and rivaroxaban [Citation41,Citation72]. There are some differences between our study and these studies, e.g. TF-triggers were used instead of thrombin by both Ammollo et al. and Semeraro et al. [Citation41,Citation72], as we did for fibrin network permeability experiments. Furthermore, lower concentrations of tPA were used in their assays, and a wider range of DOAC concentrations were studied, perhaps allowing the effects of dabigatran to be more apparent [Citation41,Citation72]. As clot lysis time in dabigatran-treated patients was prolonged only compared to rivaroxaban-treated patients and not to controls (NPP) in our study, the significance of this finding is probably limited.
D-dimer levels in plasma were lower in patients on dabigatran compared to patients on FXa-inhibitors. D-dimers reflect fibrin turnover and are considered a general marker of an activated coagulation system. Lower circulating levels of D-dimer have been interpreted as a sign of a more intensive anticoagulation [Citation44,Citation73], and in the large RE-LY study, which investigated the protective effects of dabigatran on cardio-embolism in atrial fibrillation, elevated D-dimer levels were associated with an increased risk of ischemic stroke [Citation74]. Importantly, dabigatran-treated patients had lower D-dimer levels than warfarin-treated patients [Citation74]. This assay is probably not useful to guide DOAC treatment in the individual patient. However, the lower levels of D-dimer in dabigatran-treated patients in the present study are in line with data from the other assays in this study, supporting a stronger ‘anticoagulative effect’ of dabigatran treatment. The findings are also partly in agreement with data from the large, randomized trials on the DOACs, as dabigatran was the only DOAC associated with less ischemic stroke compared to warfarin treatment [Citation3]. On the other hand, real-life data from the large ARISTOPHANES trial did not report less ischemic stroke with dabigatran compared to apixaban or rivaroxaban [Citation75]. Further, there is a concern regarding more myocardial infarctions with dabigatran treatment compared to other OACs [Citation3,Citation76,Citation77].
Our study has limitations. The anticoagulant effect of DOACs was probably lower than at other timepoints during the dosing interval as samples were collected at the trough, making comparisons with warfarin treatment difficult. The turbidimetric assay was triggered with thrombin which should be more sensitive to dabigatran treatment and thereby might skew the comparison with the other DOACs. In the CAT assay, only the lag time could be compared between dabigatran and the other OACs whereas peak thrombin has been suggested to be the most sensitive variable to treatment with FXa-inhibitors [Citation69]. The assumed DOAC concentrations were not confirmed by measurement of DOAC concentration in the in vitro experiments.
As there was no correlation between DOAC concentrations and the fibrin network permeability, there might be some concern as to whether differences between the treatment groups actually reflect a difference in the drug effect, and to what extent, e.g. differences in some clinical characteristics between the patient groups confound the comparisons. The same applies to clot lysis time, where the clinical relevance of the difference between dabigatran- and rivaroxaban-treated patients might also be questioned, as there was no difference when compared to NPP. A limitation of the study design is that the treatment groups are not matched for important clinical characteristics so confounding factors might affect the results, especially with regard to the warfarin treatment group which mostly consisted of VTE-patients.
To summarize, we have studied the anticoagulant effects of three different DOACs in comparison to warfarin with a broad panel of coagulation assays using different triggers in patients treated according to clinical routine. Results from this study indicate dabigatran treatment is a more potent anticoagulant than apixaban and rivaroxaban. However, as these results are not supported by clinical data, they are probably more related to the assays used and highlight the difficulty of measuring and comparing the effect of anticoagulants. It also illustrates that drug concentration does not provide the complete picture of DOAC effect on hemostasis in the individual patient and that measured concentrations might have to be interpreted differently depending on the type of DOAC analyzed.
Supplemental Material
Download MS Word (15.1 KB)Acknowledgements
The authors wish to thank Faris Al-Khalili at Stockholm Heart Centre for helping with the recruitment of patients, Kjell Hultenby at Department of Laboratory Medicine, Karolinska Institutet for helping with acquiring electron microscope images of fibrin networks, and Katherina Aguilera and Lena Gabrielsson for their skillful care of the study population.
Disclosure statement
No potential conflict of interest was reported by the author(s).
Additional information
Funding
References
- Hart RG, Pearce LA, Aguilar MI. Meta-analysis: antithrombotic therapy to prevent stroke in patients who have nonvalvular atrial fibrillation. Ann Intern Med. 2007;146(12):857–867. doi: 10.7326/0003-4819-146-12-200706190-00007.
- Ansell J, Hirsh J, Hylek E, et al. Pharmacology and management of the vitamin K antagonists: American College of Chest Physicians evidence-based clinical practice guidelines (8th edition). Chest. 2008;133(6 Suppl):160S–198S. doi: 10.1378/chest.08-0670.
- Connolly SJ, Ezekowitz MD, Yusuf S, et al. Dabigatran versus warfarin in patients with atrial fibrillation. N Engl J Med. 2009;361(12):1139–1151. doi: 10.1056/NEJMoa0905561.
- Patel MR, Mahaffey KW, Garg J, et al. Rivaroxaban versus warfarin in nonvalvular atrial fibrillation. N Engl J Med. 2011;365(10):883–891. doi: 10.1056/NEJMoa1009638.
- Granger CB, Alexander JH, McMurray JJ, et al. Apixaban versus warfarin in patients with atrial fibrillation. N Engl J Med. 2011;365(11):981–992. doi: 10.1056/NEJMoa1107039.
- Giugliano RP, Ruff CT, Braunwald E, et al. Edoxaban versus warfarin in patients with atrial fibrillation. N Engl J Med. 2013;369(22):2093–2104. doi: 10.1056/NEJMoa1310907.
- Hindricks G, Potpara T, Dagres N, et al. 2020 ESC guidelines for the diagnosis and management of atrial fibrillation developed in collaboration with the European Association for Cardio-Thoracic Surgery (EACTS): the task force for the diagnosis and management of atrial fibrillation of the European Society of Cardiology (ESC) developed with the special contribution of the European Heart Rhythm Association (EHRA) of the ESC. Eur Heart J. 2021;42(5):373–498. doi: 10.1093/eurheartj/ehaa612.
- Loo SY, Dell’Aniello S, Huiart L, et al. Trends in the prescription of novel oral anticoagulants in UK primary care. Br J Clin Pharmacol. 2017;83(9):2096–2106. doi: 10.1111/bcp.13299.
- Maura G, Billionnet C, Drouin J, et al. Oral anticoagulation therapy use in patients with atrial fibrillation after the introduction of non-vitamin K antagonist oral anticoagulants: findings from the French healthcare databases, 2011–2016. BMJ Open. 2019;9(4):e026645. doi: 10.1136/bmjopen-2018-026645.
- European Medicines Agency. Pradaxa – summary of product characteristics; 2018 [accessed 2019 Mar 7]. Available from: https://www.ema.europa.eu/en/documents/product-information/pradaxa-epar-product-information_en.pdf
- European Medicines Agency. Xarelto – summary of product characteristics; 2018 [accessed 2019 Mar 7]. Available from: https://www.ema.europa.eu/en/documents/product-information/xarelto-epar-product-information_en.pdf
- European Medicines Agency. Apixaban – summary of product characteristics; 2018 [accessed 2019 Mar 7]. Available from: https://www.ema.europa.eu/en/documents/product-information/eliquis-epar-product-information_en.pdf
- European Medicines Agency. Edoxaban – summary of product characteristics; 2018 [accessed 2019 Mar 7]. Available from: https://www.ema.europa.eu/en/documents/product-information/lixiana-epar-product-information_en.pdf
- Cohen AT, Hill NR, Luo X, et al. A systematic review of network meta-analyses among patients with nonvalvular atrial fibrillation: a comparison of efficacy and safety following treatment with direct oral anticoagulants. Int J Cardiol. 2018;269:174–181. doi: 10.1016/j.ijcard.2018.06.114.
- Stanifer JW, Pokorney SD, Chertow GM, et al. Apixaban versus warfarin in patients with atrial fibrillation and advanced chronic kidney disease. Circulation. 2020;141(17):1384–1392. doi: 10.1161/CIRCULATIONAHA.119.044059.
- Patel SM, Braunwald E, Steffel J, et al. Efficacy and safety of non-vitamin-K antagonist oral anticoagulants versus warfarin across the spectrum of body mass index and body weight: an individual patient data meta-analysis of four randomized clinical trials of 58 464 patients with atrial fibrillation. Circulation. 2024;149(12):932–943. doi: 10.1161/CIRCULATIONAHA.123.066279.
- Lawal OD, Aronow HD, Shobayo F, et al. Comparative effectiveness and safety of direct oral anticoagulants and warfarin in patients with atrial fibrillation and chronic liver disease: a nationwide cohort study. Circulation. 2023;147(10):782–794. doi: 10.1161/CIRCULATIONAHA.122.060687.
- Hydes TJ, Lip GYH, Lane DA. Use of direct-acting oral anticoagulants in patients with atrial fibrillation and chronic liver disease. Circulation. 2023;147(10):795–797. doi: 10.1161/CIRCULATIONAHA.122.063195.
- Gilbert C, White I, Marder VJ, et al. Overview of basic coagulation and fibrinolysis. In: Marder VJ, editor. Hemostasis and thrombosis basic principles and clinical practice. 6th ed. Philadelphia (PA): Lippincott Williams & Wilkins; 2013.
- Posma JJ, Posthuma JJ, Spronk HM. Coagulation and non-coagulation effects of thrombin. J Thromb Haemost. 2016;14(10):1908–1916. doi: 10.1111/jth.13441.
- Crawley JT, Zanardelli S, Chion CK, et al. The central role of thrombin in hemostasis. J Thromb Haemost. 2007;5 Suppl 1:95–101. doi: 10.1111/j.1538-7836.2007.02500.x.
- Blombäck B, Okada M. Fibrin gel structure and clotting time. Thromb Res. 1982;25(1–2):51–70. doi: 10.1016/0049-3848(82)90214-6.
- Pieters M, Undas A, Marchi R, et al. An international study on the standardization of fibrin clot permeability measurement: methodological considerations and implications for healthy control values. J Thromb Haemost. 2012;10(10):2179–2181. doi: 10.1111/j.1538-7836.2012.04883.x.
- Rooth E, Wallen NH, Blombäck M, et al. Decreased fibrin network permeability and impaired fibrinolysis in the acute and convalescent phase of ischemic stroke. Thromb Res. 2011;127(1):51–56. doi: 10.1016/j.thromres.2010.09.011.
- Drabik L, Wołkow P, Undas A. Fibrin clot permeability as a predictor of stroke and bleeding in anticoagulated patients with atrial fibrillation. Stroke. 2017;48(10):2716–2722. doi: 10.1161/STROKEAHA.117.018143.
- Undas A, Zawilska K, Ciesla-Dul M, et al. Altered fibrin clot structure/function in patients with idiopathic venous thromboembolism and in their relatives. Blood. 2009;114(19):4272–4278. doi: 10.1182/blood-2009-05-222380.
- Undas A, Szułdrzynski K, Stepien E, et al. Reduced clot permeability and susceptibility to lysis in patients with acute coronary syndrome: effects of inflammation and oxidative stress. Atherosclerosis. 2008;196(2):551–557. doi: 10.1016/j.atherosclerosis.2007.05.028.
- Fatah K, Silveira A, Tornvall P, et al. Proneness to formation of tight and rigid fibrin gel structures in men with myocardial infarction at a young age. Thromb Haemost. 1996;76(4):535–540. doi: 10.1055/s-0038-1650618.
- Collet JP, Allali Y, Lesty C, et al. Altered fibrin architecture is associated with hypofibrinolysis and premature coronary atherothrombosis. Arterioscler Thromb Vasc Biol. 2006;26(11):2567–2573. doi: 10.1161/01.ATV.0000241589.52950.4c.
- Ząbczyk M, Blombäck M, Majewski J, et al. Assays of fibrin network properties altered by VKAs in atrial fibrillation – importance of using an appropriate coagulation trigger. Thromb Haemost. 2015;113(4):851–861. doi: 10.1160/TH14-07-0591.
- He S, Blombäck M, Bark N, et al. The direct thrombin inhibitors (argatroban, bivalirudin and lepirudin) and the indirect Xa-inhibitor (danaparoid) increase fibrin network porosity and thus facilitate fibrinolysis. Thromb Haemost. 2010;103(5):1076–1084. doi: 10.1160/TH09-05-0306.
- Blombäck M, He S, Bark N, et al. Effects on fibrin network porosity of anticoagulants with different modes of action and reversal by activated coagulation factor concentrate. Br J Haematol. 2011;152(6):758–765. doi: 10.1111/j.1365-2141.2010.08546.x.
- Ząbczyk M, Majewski J, Karkowski G, et al. Vitamin K antagonists favourably modulate fibrin clot properties in patients with atrial fibrillation as early as after 3 days of treatment: relation to coagulation factors and thrombin generation. Thromb Res. 2015;136(4):832–838. doi: 10.1016/j.thromres.2015.08.007.
- He S, Johnsson H, Zabczyk M, et al. A fibrinogen concentrate haemocomplettan (Riastap) or a factor XIII concentrate fibrogammin combined with a mini dose of tranexamic acid can reverse the fibrin instability to fibrinolysis induced by thrombin- or FXa-inhibitor. Br J Haematol. 2013;160(6):806–816. doi: 10.1111/bjh.12189.
- Janion-Sadowska A, Natorska J, Siudut J, et al. Plasma fibrin clot properties in the G20210A prothrombin mutation carriers following venous thromboembolism: the effect of rivaroxaban. Thromb Haemost. 2017;117(9):1739–1749. doi: 10.1160/TH17-01-0060.
- Hemker HC, Giesen P, AlDieri R, et al. The calibrated automated thrombogram (CAT): a universal routine test for hyper- and hypocoagulability. Pathophysiol Haemost Thromb. 2002;32(5–6):249–253. doi: 10.1159/000073575.
- Rooth E, Sobocinski-Doliwa P, Antovic J, et al. Thrombin generation in acute cardioembolic and non-cardioembolic ischemic stroke. Scand J Clin Lab Invest. 2013;73(7):576–584. doi: 10.3109/00365513.2013.826817.
- Lutsey PL, Folsom AR, Heckbert SR, et al. Peak thrombin generation and subsequent venous thromboembolism: the longitudinal investigation of thromboembolism etiology (LITE) study. J Thromb Haemost. 2009;7(10):1639–1648. doi: 10.1111/j.1538-7836.2009.03561.x.
- Skeppholm M, Kallner A, Malmqvist K, et al. Is fibrin formation and thrombin generation increased during and after an acute coronary syndrome? Thromb Res. 2011;128(5):483–489. doi: 10.1016/j.thromres.2011.03.011.
- Sumaya W, Wallentin L, James SK, et al. Fibrin clot properties independently predict adverse clinical outcome following acute coronary syndrome: a PLATO substudy. Eur Heart J. 2018;39(13):1078–1085. doi: 10.1093/eurheartj/ehy013.
- Ammollo CT, Semeraro F, Incampo F, et al. Dabigatran enhances clot susceptibility to fibrinolysis by mechanisms dependent on and independent of thrombin-activatable fibrinolysis inhibitor. J Thromb Haemost. 2010;8(4):790–798. doi: 10.1111/j.1538-7836.2010.03739.x.
- Lisman T, de Groot PG, Meijers JC, et al. Reduced plasma fibrinolytic potential is a risk factor for venous thrombosis. Blood. 2005;105(3):1102–1105. doi: 10.1182/blood-2004-08-3253.
- Carter AM, Cymbalista CM, Spector TD, et al. Heritability of clot formation, morphology, and lysis: the EuroCLOT study. Arterioscler Thromb Vasc Biol. 2007;27(12):2783–2789. doi: 10.1161/ATVBAHA.107.153221.
- Weitz JI, Fredenburgh JC, Eikelboom JW. A test in context: D-dimer. J Am Coll Cardiol. 2017;70(19):2411–2420. doi: 10.1016/j.jacc.2017.09.024.
- McFarland CP, Lind SE. Thrombin generation biomarkers decline with parenteral anticoagulation–an overlooked means of anticoagulation monitoring? Clin Appl Thromb Hemost. 2018;24(5):708–717. doi: 10.1177/1076029617746506.
- Lippi G, Cervellin G, Franchini M, et al. Biochemical markers for the diagnosis of venous thromboembolism: the past, present and future. J Thromb Thrombolysis. 2010;30(4):459–471. doi: 10.1007/s11239-010-0460-x.
- He S, Cao H, Antovic A, et al. Modifications of flow measurement to determine fibrin gel permeability and the preliminary use in research and clinical materials. Blood Coagul Fibrinolysis. 2005;16(1):61–67. doi: 10.1097/00001721-200501000-00010.
- Dey S. A new rapid air-drying technique for scanning electron microscopy using tetramethylsilane: application to mammalian tissue. Cytobios. 1993;73:17–23.
- Antovic JP, Skeppholm M, Eintrei J, et al. Evaluation of coagulation assays versus LC-MS/MS for determinations of dabigatran concentrations in plasma. Eur J Clin Pharmacol. 2013;69(11):1875–1881. doi: 10.1007/s00228-013-1550-4.
- Skeppholm M, Al-Aieshy F, Berndtsson M, et al. Clinical evaluation of laboratory methods to monitor apixaban treatment in patients with atrial fibrillation. Thromb Res. 2015;136(1):148–153. doi: 10.1016/j.thromres.2015.04.030.
- Al-Aieshy F, Malmström RE, Antovic J, et al. Clinical evaluation of laboratory methods to monitor exposure of rivaroxaban at trough and peak in patients with atrial fibrillation. Eur J Clin Pharmacol. 2016;72(6):671–679. doi: 10.1007/s00228-016-2060-y.
- Helin TA, Lemponen M, Hjemdahl P, et al. From laboratory to clinical practice: dabigatran effects on thrombin generation and coagulation in patient samples. Thromb Res. 2015;136(1):154–160. doi: 10.1016/j.thromres.2015.04.032.
- Wagenvoord RJ, Deinum J, Elg M, et al. The paradoxical stimulation by a reversible thrombin inhibitor of thrombin generation in plasma measured with thrombinography is caused by alpha-macroglobulin-thrombin. J Thromb Haemost. 2010;8(6):1281–1289. doi: 10.1111/j.1538-7836.2010.03822.x.
- Freyburger G, Macouillard G, Labrouche S, et al. Coagulation parameters in patients receiving dabigatran etexilate or rivaroxaban: two observational studies in patients undergoing total hip or total knee replacement. Thromb Res. 2011;127(5):457–465. doi: 10.1016/j.thromres.2011.01.001.
- Samama MM, Le Flem L, Guinet C, et al. Three different patterns of calibrated automated thrombogram obtained with six different anticoagulants. J Thromb Haemost. 2007;5(12):2554–2556. doi: 10.1111/j.1538-7836.2007.02753.x.
- Bloemen S, Zwaveling S, Douxfils J, et al. The anticoagulant effect of dabigatran is reflected in the lag time and time-to-peak, but not in the endogenous thrombin potential or peak, of thrombin generation. Thromb Res. 2018;171:160–166. doi: 10.1016/j.thromres.2018.10.005.
- Hankey GJ, Eikelboom JW, Etexilate D. Dabigatran etexilate: a new oral thrombin inhibitor. Circulation. 2011;123(13):1436–1450. doi: 10.1161/CIRCULATIONAHA.110.004424.
- He S, Cao H, Thålin C, et al. The clotting trigger is an important determinant for the coagulation pathway in vivo or in vitro-inference from data review. Semin Thromb Hemost. 2021;47(1):63–73. doi: 10.1055/s-0040-1718888.
- Douxfils J, Adcock DM, Bates SM, et al. 2021 update of the International Council for Standardization in Haematology recommendations for laboratory measurement of direct oral anticoagulants. Thromb Haemost. 2021;121(8):1008–1020. doi: 10.1055/a-1450-8178.
- Tripodi A, Ageno W, Ciaccio M, et al. Position paper on laboratory testing for patients on direct oral anticoagulants. A consensus document from the SISET, FCSA, SIBioC and SIPMeL. Blood Transfus. 2018;16(5):462–470. doi: 10.2450/2017.0124-17.
- Tomaselli GF, Mahaffey KW, Cuker A, et al. 2020 ACC expert consensus decision pathway on management of bleeding in patients on oral anticoagulants: a report of the American College of Cardiology solution set oversight committee. J Am Coll Cardiol. 2020;76(5):594–622. doi: 10.1016/j.jacc.2020.04.053.
- Kopytek M, Zabczyk M, Natorska J, et al. Effects of direct oral anticoagulants on thromboelastographic parameters and fibrin clot properties in patients with venous thromboembolism. J Physiol Pharmacol. 2020;71(1):47–53. doi: 10.26402/jpp.2020.1.03.
- Herrmann R, Thom J, Wood A, et al. Thrombin generation using the calibrated automated thrombinoscope to assess reversibility of dabigatran and rivaroxaban. Thromb Haemost. 2014;111(5):989–995. doi: 10.1160/TH13-07-0607.
- Dinkelaar J, Patiwael S, Harenberg J, et al. Global coagulation tests: their applicability for measuring direct factor Xa- and thrombin inhibition and reversal of anticoagulation by prothrombin complex concentrate. Clin Chem Lab Med. 2014;52(11):1615–1623. doi: 10.1515/cclm-2014-0307.
- Helin TA, Lemponen M, Lassila R, et al. Anticoagulated patients exhibit intact endogenous thrombin potential using ST Genesia unlike the calibrated automated thrombogram. Res Pract Thromb Haemost. 2021;5(3):439–446. doi: 10.1002/rth2.12497.
- Pfrepper C, Metze M, Siegemund A, et al. Direct oral anticoagulant plasma levels and thrombin generation on ST Genesia system. Res Pract Thromb Haemost. 2020;4(4):619–627. doi: 10.1002/rth2.12340.
- Giesen PLA, Gulpen AJW, van Oerle R, et al. Calibrated automated thrombogram II: removing barriers for thrombin generation measurements. Thromb J. 2021;19:60.
- Kopatz WF, Brinkman HJM, Meijers JCM. Use of DOAC stop for elimination of anticoagulants in the thrombin generation assay. Thromb Res. 2018;170:97–101. doi: 10.1016/j.thromres.2018.08.014.
- Artang R, Anderson M, Riley P, et al. Assessment of the effect of direct oral anticoagulants dabigatran, rivaroxaban, and apixaban in healthy male volunteers using a thrombin generation assay. Res Pract Thromb Haemost. 2017;1(2):194–201. doi: 10.1002/rth2.12044.
- Königsbrügge O, Weigel G, Quehenberger P, et al. Plasma clot formation and clot lysis to compare effects of different anticoagulation treatments on hemostasis in patients with atrial fibrillation. Clin Exp Med. 2018;18(3):325–336. doi: 10.1007/s10238-018-0490-9.
- Collet JP, Soria J, Mirshahi M, et al. Dusart syndrome: a new concept of the relationship between fibrin clot architecture and fibrin clot degradability: hypofibrinolysis related to an abnormal clot structure. Blood. 1993;82(8):2462–2469. doi: 10.1182/blood.V82.8.2462.2462.
- Semeraro F, Incampo F, Ammollo CT, et al. Dabigatran but not rivaroxaban or apixaban treatment decreases fibrinolytic resistance in patients with atrial fibrillation. Thromb Res. 2016;138:22–29. doi: 10.1016/j.thromres.2015.12.023.
- Johnson ED, Schell JC, Rodgers GM. The D-dimer assay. Am J Hematol. 2019;94(7):833–839. doi: 10.1002/ajh.25482.
- Siegbahn A, Oldgren J, Andersson U, et al. D-dimer and factor VIIa in atrial fibrillation – prognostic values for cardiovascular events and effects of anticoagulation therapy. A RE-LY substudy. Thromb Haemost. 2016;115(5):921–930. doi: 10.1055/s-0037-1615530.
- Lip GYH, Keshishian A, Li X, et al. Effectiveness and safety of oral anticoagulants among nonvalvular atrial fibrillation patients. Stroke. 2018;49(12):2933–2944. doi: 10.1161/STROKEAHA.118.020232.
- Uchino K, Hernandez AV. Dabigatran association with higher risk of acute coronary events: meta-analysis of noninferiority randomized controlled trials. Arch Intern Med. 2012;172(5):397–402. doi: 10.1001/archinternmed.2011.1666.
- Artang R, Rome E, Nielsen JD, et al. Meta-analysis of randomized controlled trials on risk of myocardial infarction from the use of oral direct thrombin inhibitors. Am J Cardiol. 2013;112(12):1973–1979. doi: 10.1016/j.amjcard.2013.08.027.